
EUR/USD
The EUR/USD pair managed to advance modestly this Monday, as half a holiday in the US, with Wall Street working, but pretty much everything else closed in the country, keeping majors within limited ranges. The pair ended the day marginally higher around 1.1750, merely 20 pips above Friday’s close, with trading also restricted ahead of first-tier events that will take place later this week, starting this Tuesday, with the possibility of Catalonia declaring its independence from Spain, something the markets fear, but are still underestimating. Mid week, the Fed will release the Minutes of its latest meeting, while on Friday, it will offer final September inflation figures.
Data released this Monday in Europe was EUR-supportive, as German industrial production rose by more than expected in August, posting its biggest monthly increase in more than six years, up by 2.6% in the month, bouncing from July’s 0.1% decline. When compared to a year earlier, production rose by 4.7%, from 4.2% in July. Also, the EU Sentix investor confidence jumped to 29.7 in October, its highest in 10 years, beating expectations of 28.5.
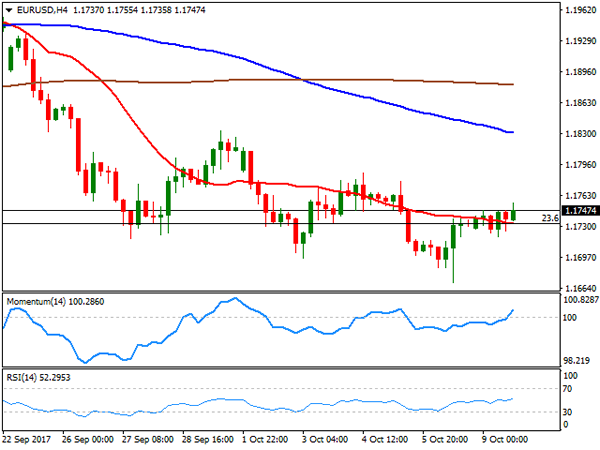
From a technical point of view, the pair has gained some bullish traction in the short term, but would take the price to settle above the 1.1820/30 strong static resistance area to see the pair actually turning positive and bulls daring for more. In the meantime, the 4 hours chart shows that the price advanced above 1.1730, which in the mentioned chart presents its 20 SMA, while the level also represents the 23.6% retracement of the April/September rally. Indicators in the mentioned chart head modestly higher after entering positive territory, supporting some additional gains up to the 1.1780 region, the immediate resistance. Below the mentioned Fibonacci support, on the other hand, the risk turns towards the downside, with scope then for a retest of the 1.1660 price zone.
Support levels: 1.1730 1.1695 1.1660
Resistance levels: 1.1780 1.1825 1.1850
USD/JPY
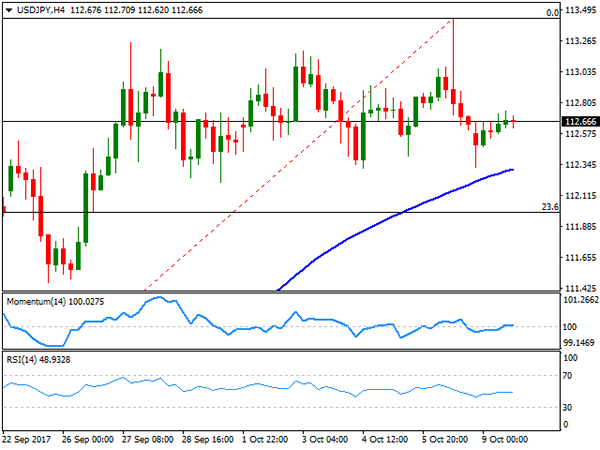
Following an early slide down to 112.31, the USD/JPY pair recovered, to end the day unchanged from Friday’s close in the 112.60 region. The Japanese yen gapped higher at the weekly opening, on headlines indicating that North Korea is preparing to test a long-range missile that could reach the US West Coast, although with Japan on holidays, the movement was short-lived. Furthermore, US Treasury yields held near recent highs, with the 10-year note yield ending the day barely lower at 2.36% from Friday’s 2.37%. In the macroeconomic front, Japan will release its current account and trade balance data for August, both expected below July’s levels, whilst BOJ’s Governor Kuroda is scheduled to speak, although there are little chances that he would add something new to its monetary policy stance. The pair has been trading uneventfully ever since reaching the 113.00 region, confined to a tight consolidative range for more than two weeks already, after adding around 600 pips from its September bottom, waiting for a catalyst that will give it the next directional impulse. Short term, the pair presents a neutral-to-bullish stance, give that the price is holding above its moving averages, with the 100 SMA heading higher around 112.30, providing an immediate support, followed by 112.00, the 23.6% retracement of the September run. Technical indicators in the mentioned chart, however, continue lacking directional strength, holding around their mid-lines. The pair would need to advance beyond 113.45, the high set last week, to be able to extend its bullish run during the following sessions.
Support levels: 112.30 112.00 111.65
Resistance levels: 113.00 113.45 113.80
GBP/USD
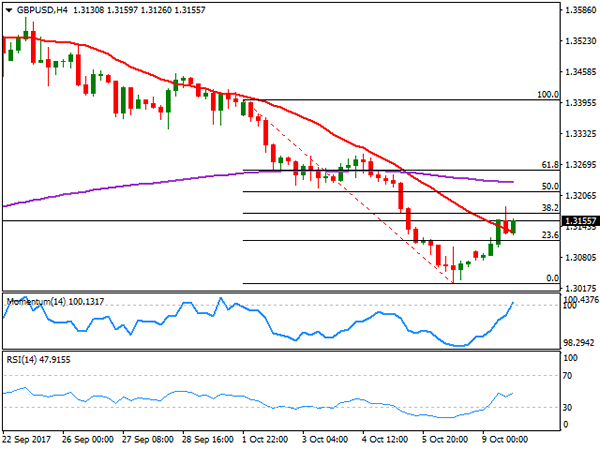
The Pound was among the best performers against the greenback this Monday, correcting part of last week’s slump. The GBP/USD pair jumped to 1.3183 early London, following news that after the UK’s Office for National Statistics announced a correction of employment inflation data, raising the Q2 unit labor costs to 2.4% from the previous estimate of 1.6% YoY. Later on the day, UK’s PM Theresa May delivered a speech to the parliament on Monday, as usual full of hopes. This time, she said that the "ball is in their court," referring to the EU negotiators so it’s their time to make proposals at a new round of talks opening the way to the next stage of negotiations. She additionally said to business leaders that companies should thing of a two-year transition period as assured. After the early advance, the pair retreated modestly, but held on to gains at the end of the day, entering the Asian session with a short-term positive technical outlook, as in the 4 hours chart, indicators aim higher, entering positive territory, whilst the price settled above an anyway bearish 20 SMA. The same chart shows also that the price was unable to rally beyond the 38.2% retracement of last week’s decline, at 1.3170, now the immediate resistance.
Support levels: 1.3110 1.3065 1.3025
Resistance levels: 1.3170 1.3210 1.3250
GOLD
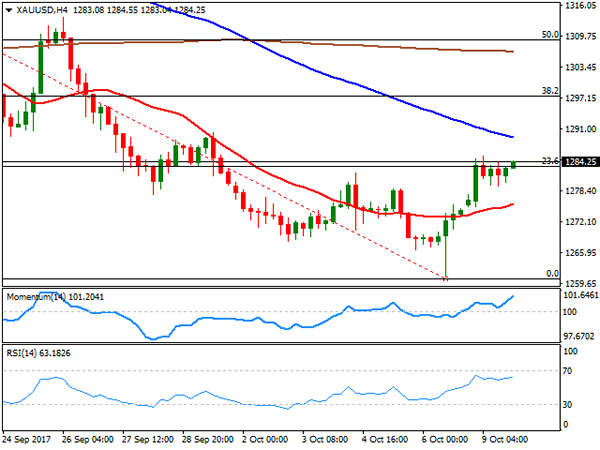
Gold prices extended their advance at the beginning of the week, with spot edging up to $ 1,285.40 a troy ounce, to close it modestly below the level. Gains were triggered by resurgent demand from safe-haven assets on renewed concerns over the US-North Korea conflict. A softer greenback across the board, added to the metal’s gains. These last two-day’s recovery seems corrective as the price currently stands around the 23.6% retracement of the September/October slide. Daily basis, technical indicators have lost oversold conditions, but pared their recovery within negative territory, whilst a strongly bearish 20 DMA offers an immediate resistance at 1,288.70. In the same chart, the price has managed to regain ground above a flat 100 DMA after bottoming around the 200 DMA last week, a sign that the bearish momentum eased long term. In the 4 hours chart and for the upcoming sessions, the risk is slowly gyrating towards the upside, as indicators aim north within positive territory, whilst the price has surpassed its 20 SMA. Further gains beyond the 1.288.70 level are required to confirm a stepper advance that can extend up to 1,297.45, the 38.2% retracement of the mentioned slide.
Support levels: 1,268.30 1,260.50 1,252.90
Resistance levels: 1,282.15 1.294.25 1,303.95
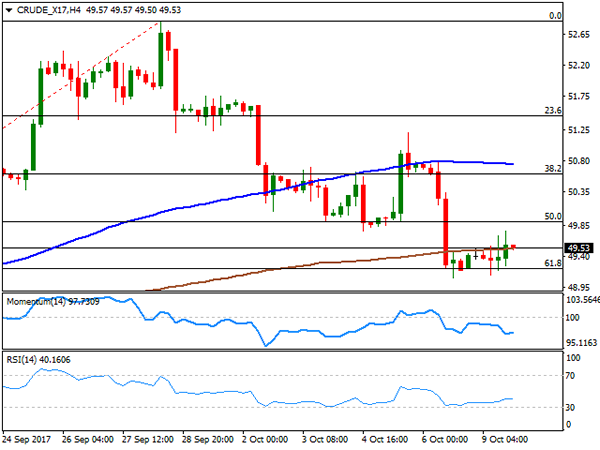
WTI CRUDE OIL
West Texas Intermediate crude oil futures edged higher, ending the day at $49.54 a barrel, after trading as high as 49.77 intraday, on comments from OPEC’s secretary general Mohammad Barking, who said that the oil market is rebalancing fast and has almost entirely erased the glut of refined products. Furthermore, the organization signaled the possibility of an extension of its output cut deal. The daily chart for the US barrel shows that the price held within Friday’s range lower end, but above a major Fibonacci support around 49.20, the 61.8% retracement of its latest bullish run. Indicators in the mentioned time frame lost their bearish strength, but hold flat within negative territory, suggesting buying interest remains limited at the time being. Shorter term and in the 4 hours chart, the upward potential is also limited, with indicators lacking directional strength within negative territory, and the price hovering around its 200 SMA. The commodity needs to advance above 49.90, the 50% retracement of the mentioned decline, to have a more constructive outlook for the upcoming sessions.
Support levels: 49.20 48.80 48.30
Resistance levels: 49.90 50.60 51.10
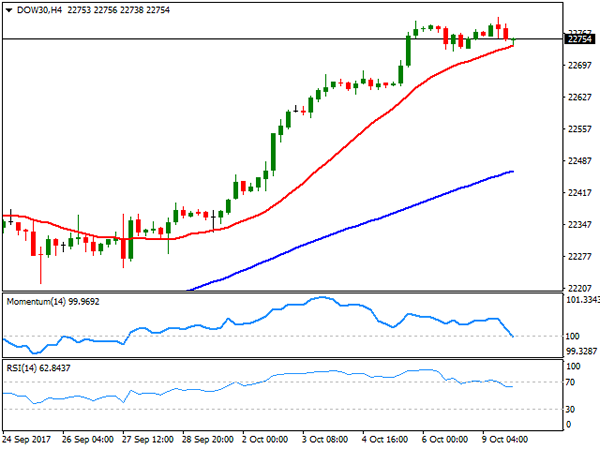
DJIA
The Dow Jones Industrial Average rallied to a record high early Monday, but closed in the red, as well as all US major indexes, in a dull trading session. The index lost 12 points, to end the day at 22,761.07, while the S&P lost 4 points, to end at 2,544.73. The Nasdaq Composite also lost ground down 10 points to 6.579.73. Within the Dow, Wal-Mart Stores was the best performer, up 1.80%, followed by IBM which added 0.61%. General Electric, on the other hand, was the worst performer, down 4.37% after an activist shareholder was appointed to the board of directors. Nike followed, down by 1.71%. The Dow peaked at 22,802 a new all time high before trimming intraday gains, confined anyway to a tight range amid a holiday in the US and Canada. Technical readings in the daily chart still favor additional gains ahead, as indicators picked up within overbought readings, whilst the price remains far above all of its moving averages. In the short term, however, the index is barely holding above its 20 SMA, meeting buying interest around it, the immediate support at 22,735, while the Momentum indicator retains its downward strength, heading south around its mid-line, as the RSI consolidates around 68, all of which favors a downward extension for this Tuesday, on a break below the mentioned support.
Support levels: 22,743 22,695 22,651
Resistance levels: 22,790 22,850 22,900
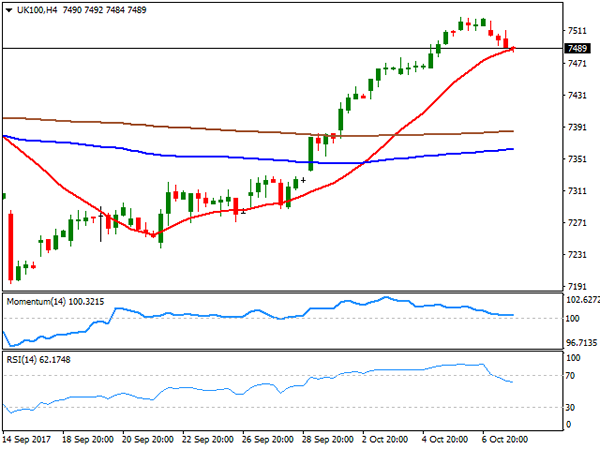
FTSE100
The FTSE 100 lost roughly 15 points, to end the day at 7,507.89, as local equities suffered from a stronger Pound. Market rumors indicating that PM Theresa May could reshuffle its cabinet to recover her lost authority brought some relief after speculation she may be forced to call for a snap election. The political situation is still unclear, and will be a weight for both, the currency and the index, beyond intraday moves. In London, Reckitt Benckiser was the best performer, up 1.49%, followed by Admiral Group, which added 1.195. Anglo American was the worst performer, down 3.38%, followed by Rio Tinto that shed 2.24%, as mining-related equities couldn’t shrug off Chinese negative news. Technically, the movement seems barely corrective according to the daily chart, as indicators are retreating from overbought territory, whilst the index holds above its 20 and 100 DMAs. In the 4 hours chart, and for the shorter term, further slides are likely, as the index ended the day a few points above its 20 SMA, whilst technical indicators retreated further from overbought levels, losing downward strength within positive territory, but still leaning the scale towards the downside.
Support levels: 7,444 7,408 7,371
Resistance levels: 7,513 7,552 7,599
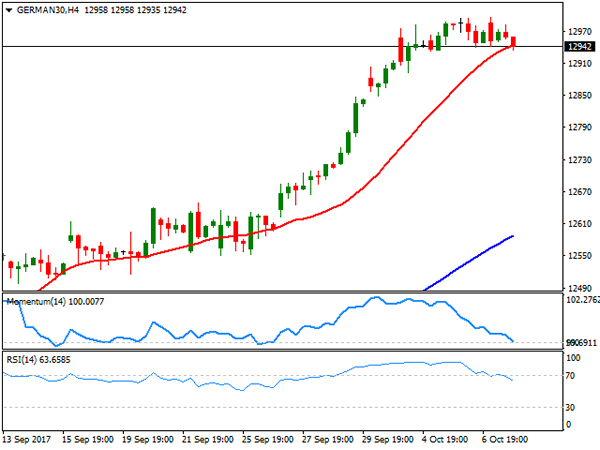
DAX
The German DAX added 20 points, or 0.16% this Monday, to end at 12,976.40, as European equities edged marginally higher on a recovery of the Spanish IBEX. Fears that Catalonia may declare its independence from Spain on Monday, eased partially ahead of the key parliamentary meeting that would take place this Tuesday, as anti-separatists marched in Barcelona on Sunday. In Germany RWE AG was the best performer, up 2.34%, followed by E.ON which added also 2.34%. Deutsche Bank led decliners, down by 1.94%, followed by Linde that lost 1.66%. The daily chart for the index shows that it settled at the lower end of its latest range, but still at record highs, and while technical indicators eased partially from overbought readings, the index remains far above all of its moving averages, suggesting that the long-term ruling trend remains firm in place. Shorter term, and according to the 4 hours chart, the downward potential increased, as the index is pressuring its 20 SMA, the Momentum indicator heading south around its 100 level, whilst the RSI retreats strongly from overbought levels, now around 63.
Support levels: 12,935 12,893 12,849
Resistance levels: 12,971 13,015 13,045


