
DXY:
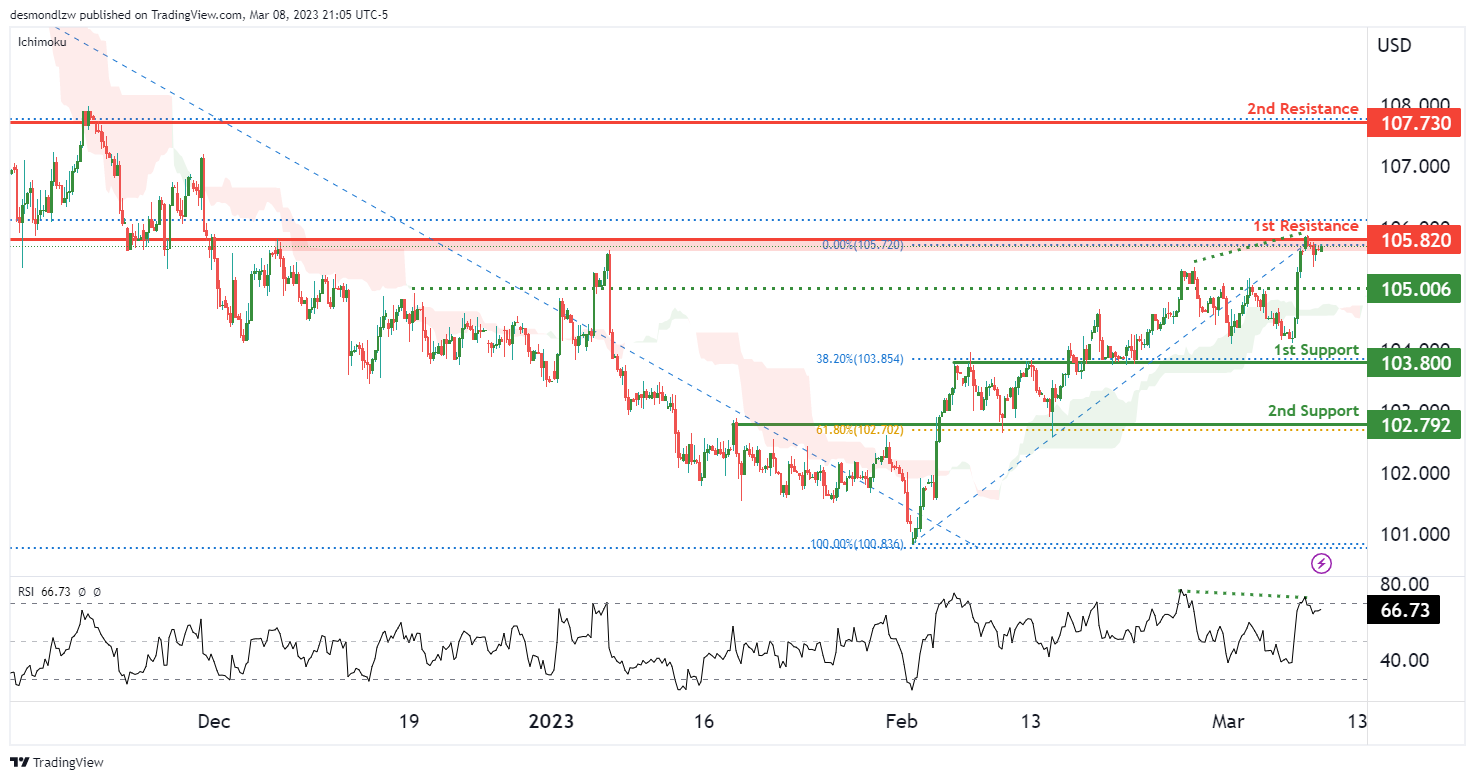
Price is still at the 1st resistance area of 105.82, which is an overlap resistance. If the price were to reverse from this level, it could potentially drop to our 1st support at 103.80, which has the 38.2% Fibonacci retracement. The next support level is at 102.79, which is an overlap support that lines up with the 61.8% Fibonacci retracement.
In terms of resistance, if the price were to break the 1st resistance, it could push up to 107.730, which is an overlap resistance. Worth noting that there’s a bearish divergence being formed against the RSI too which suggests a potential bearish reversal.
EUR/USD:
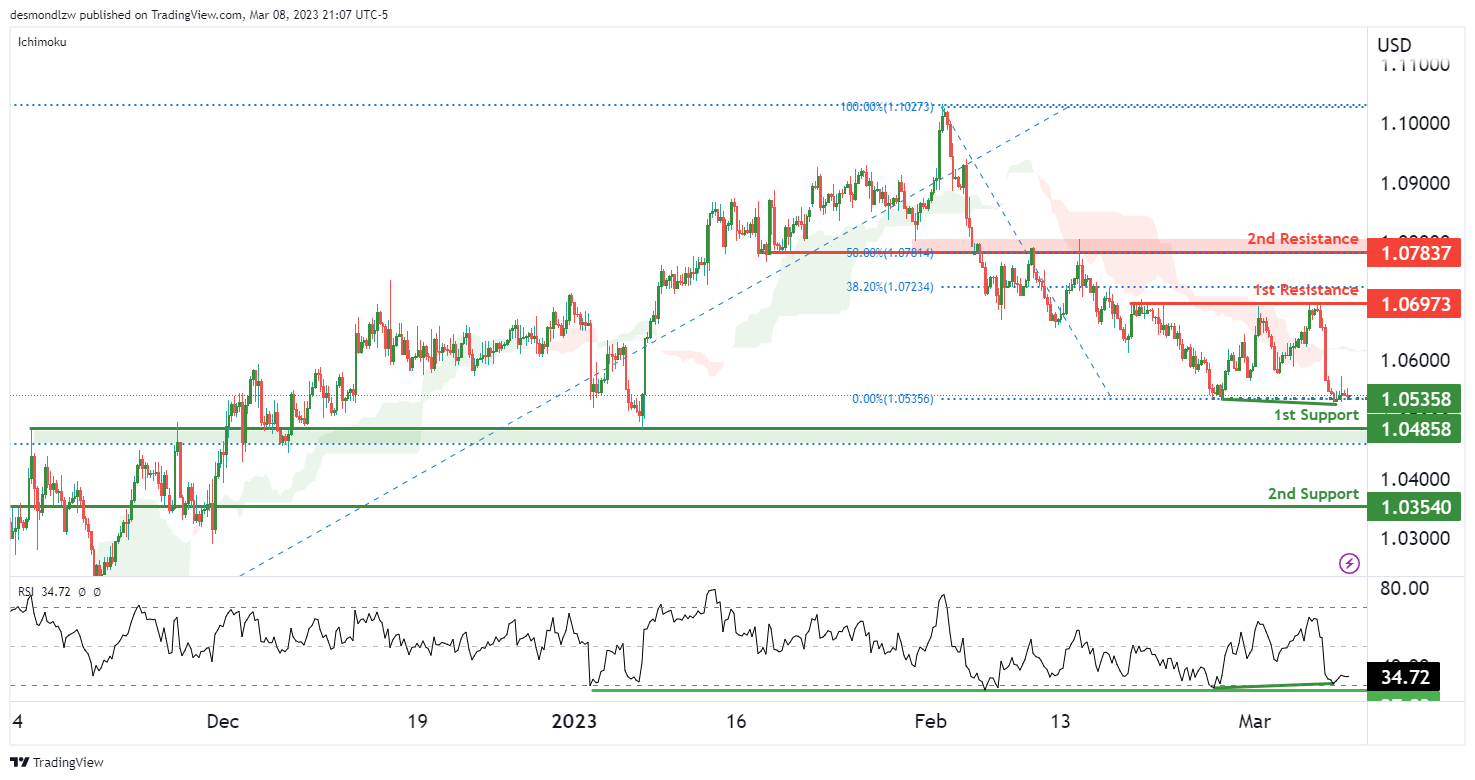
EURUSD has held well above our intermediate support at 1.0535 and is seeing bullish divergence vs RSI. A bounce from here could see prices rise to our 1st resistance at 1.0697 which is slightly below our 38.2% Fibonacci retracement.
The first major support is at 1.0485 which is a strong overlap support. If price were to break this level, we could see it drop further to 1.0354 which is our 2nd support.
GBP/USD:
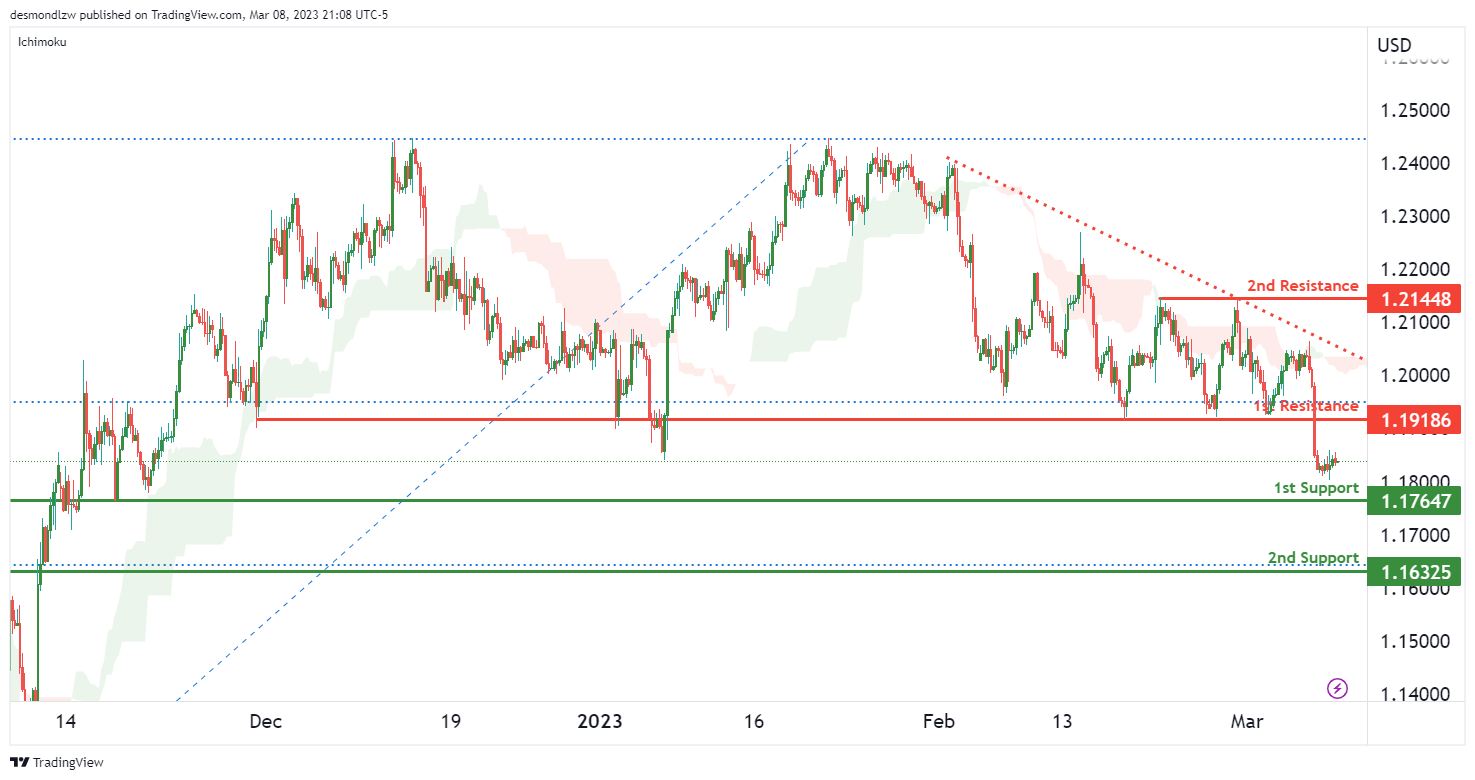
Price is respecting a descending resistance line, pushing prices down towards our 1st support at 1.1764, which is an overlap support. It’s worth noting that the price is also experiencing bearish momentum from the Ichimoku cloud, which could add to the conviction we have that the price will be pushed lower.
Regarding resistance levels, our 1st resistance is at 1.1918, which is an overlap resistance, and the 2nd resistance level is at 1.2144.
USD/CHF:
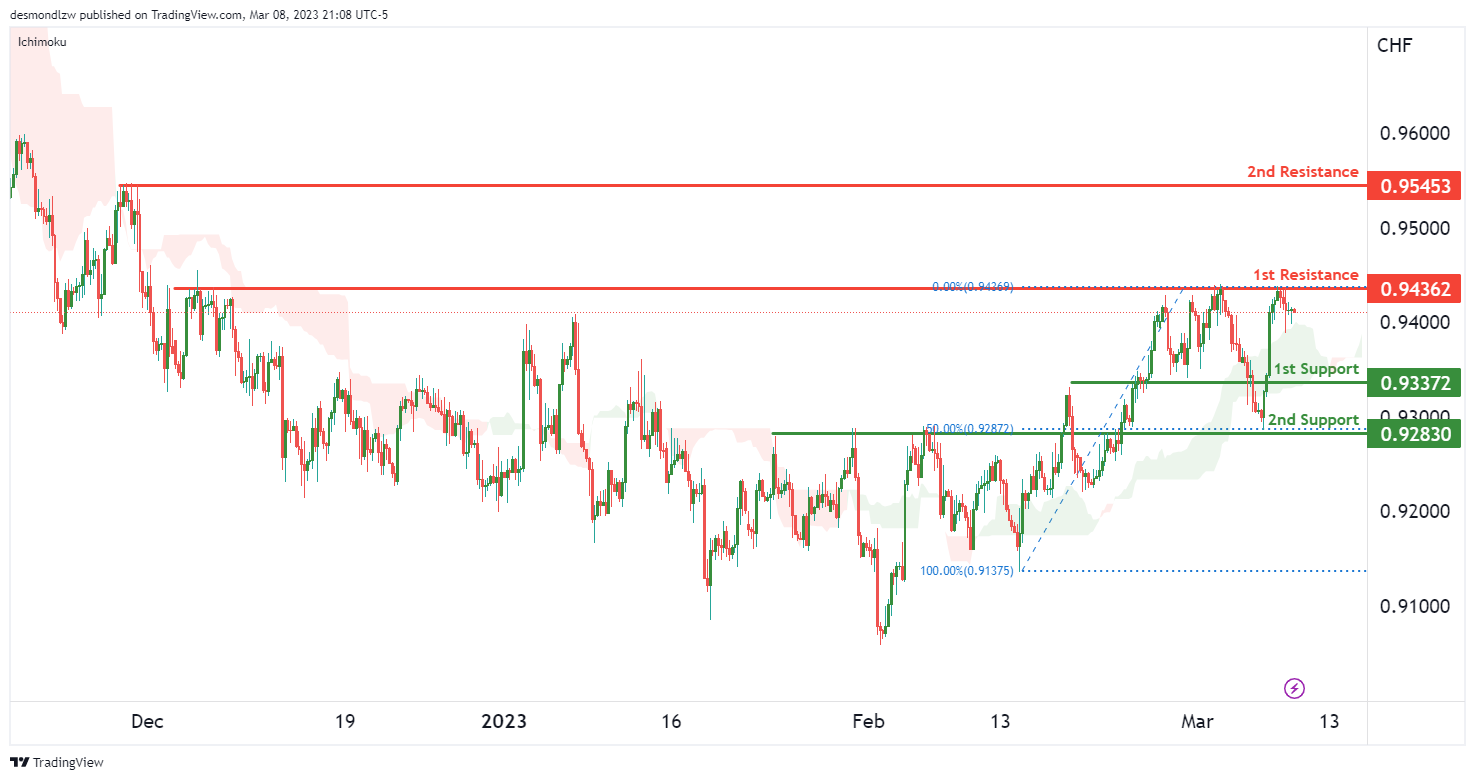
Price has tested and reversed nicely at the 1st resistance level of 0.9436, which is a strong resistance, as we have seen multiple touches on this level in the past. If the price were to break from this level, it could push up to the 2nd resistance at 0.9545.
Regarding support levels, if price were to reverse from the 1st resistance, we could see it drop to the 1st support at 0.9337. The 2nd support level is at 0.9283, which lines up with the 50% Fibonacci retracement.
USD/JPY:
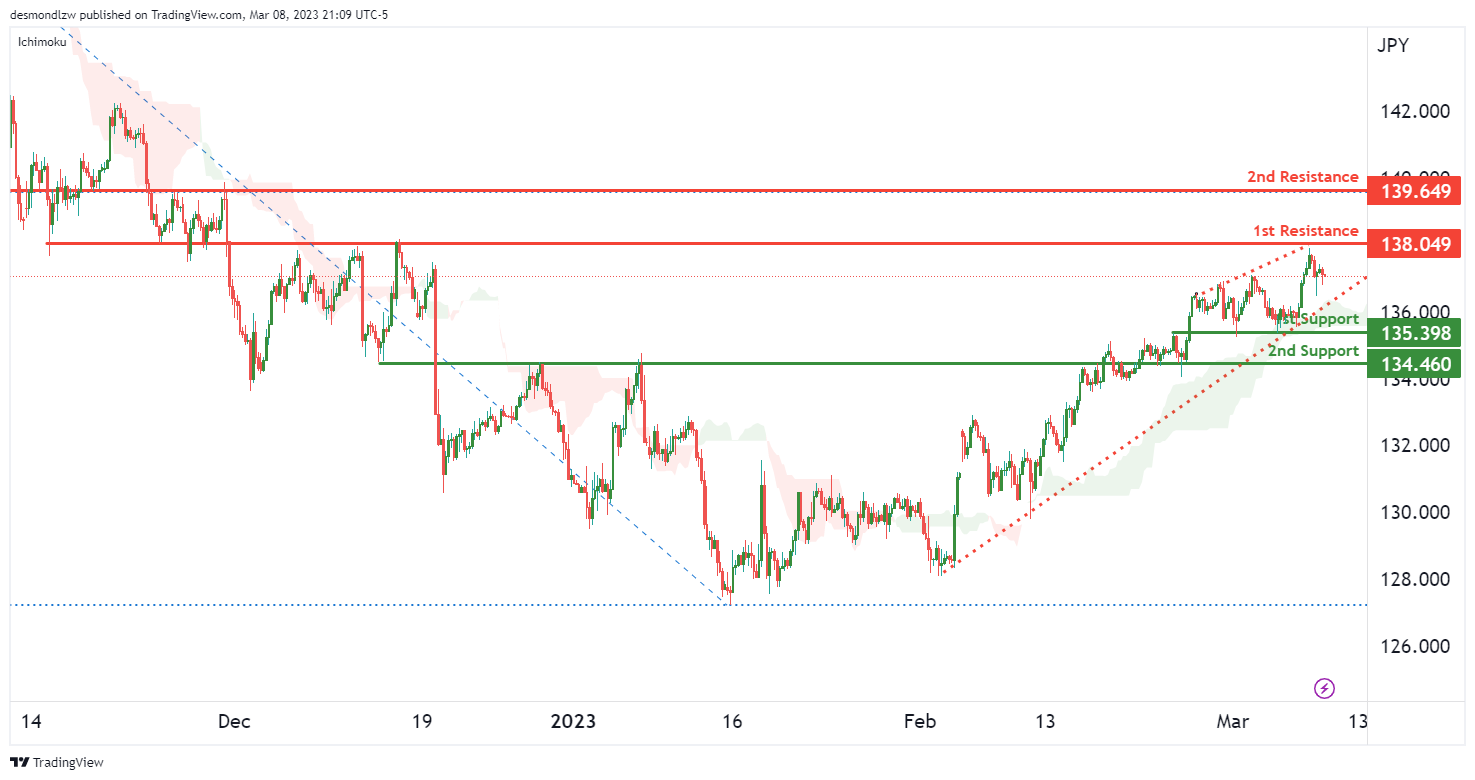
Price is seeing support from an ascending support line and bullish momentum from the Ichimoku cloud. We could see it continue to be squeezed against the 1st resistance of 138.04 which is a key overlap resistance. If price were to break that level, we could see a further push up to 2nd resistance at 139.64.
AUD/USD:
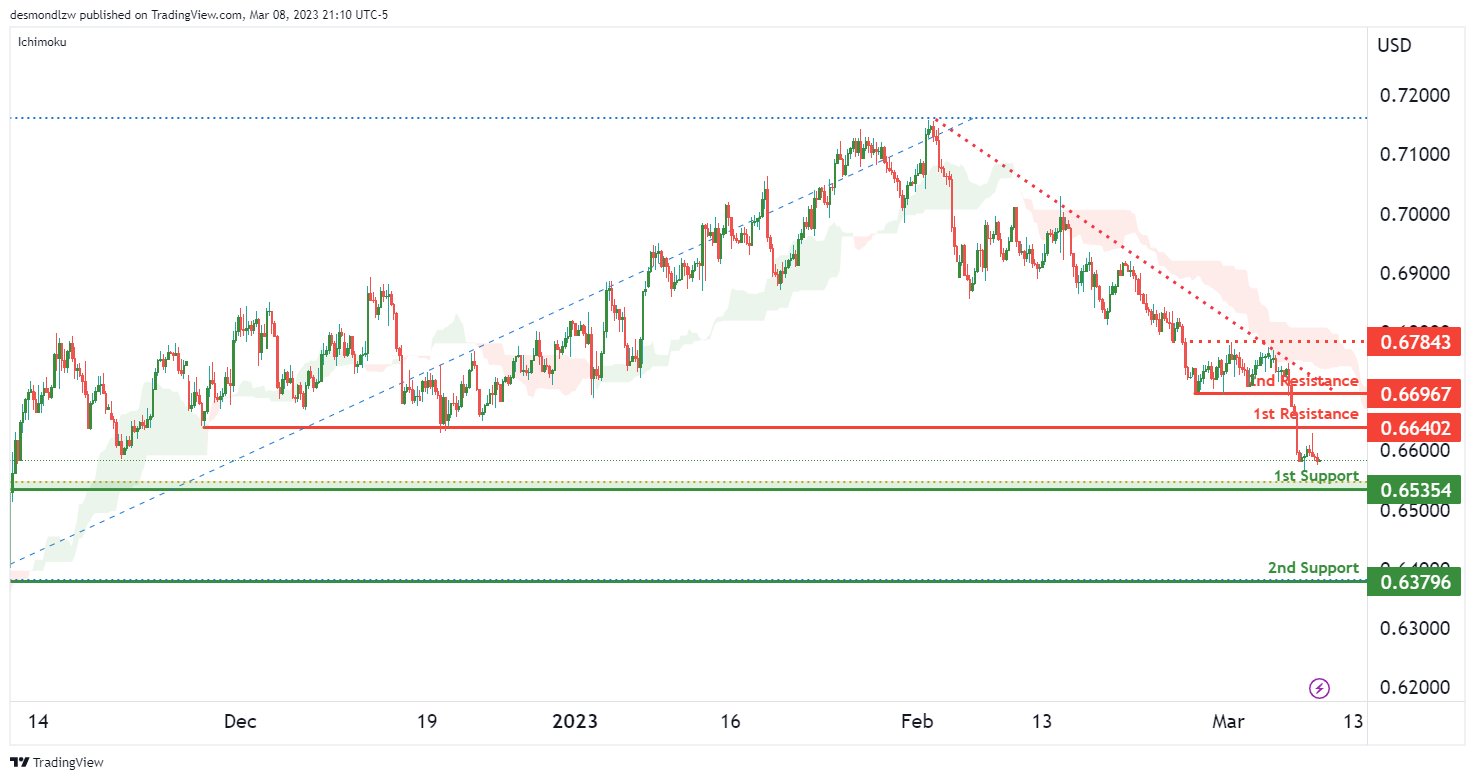
Price is experiencing strong bearish momentum from a long-term descending resistance line. Along with that, we can see the bearish Ichimoku cloud pushing prices further down. The 1st support that needs to be broken is at 0.6535, which is an overlap support. If the price were to break from this level, the next key support level would be at 0.6379, which is another overlap support.
Regarding resistance levels, the 1st resistance is at 0.6640 which is a strong Overlap Resistance, and the 2nd resistance is at 0.6696 which is a short term pullback resistance level.
NZD/USD:
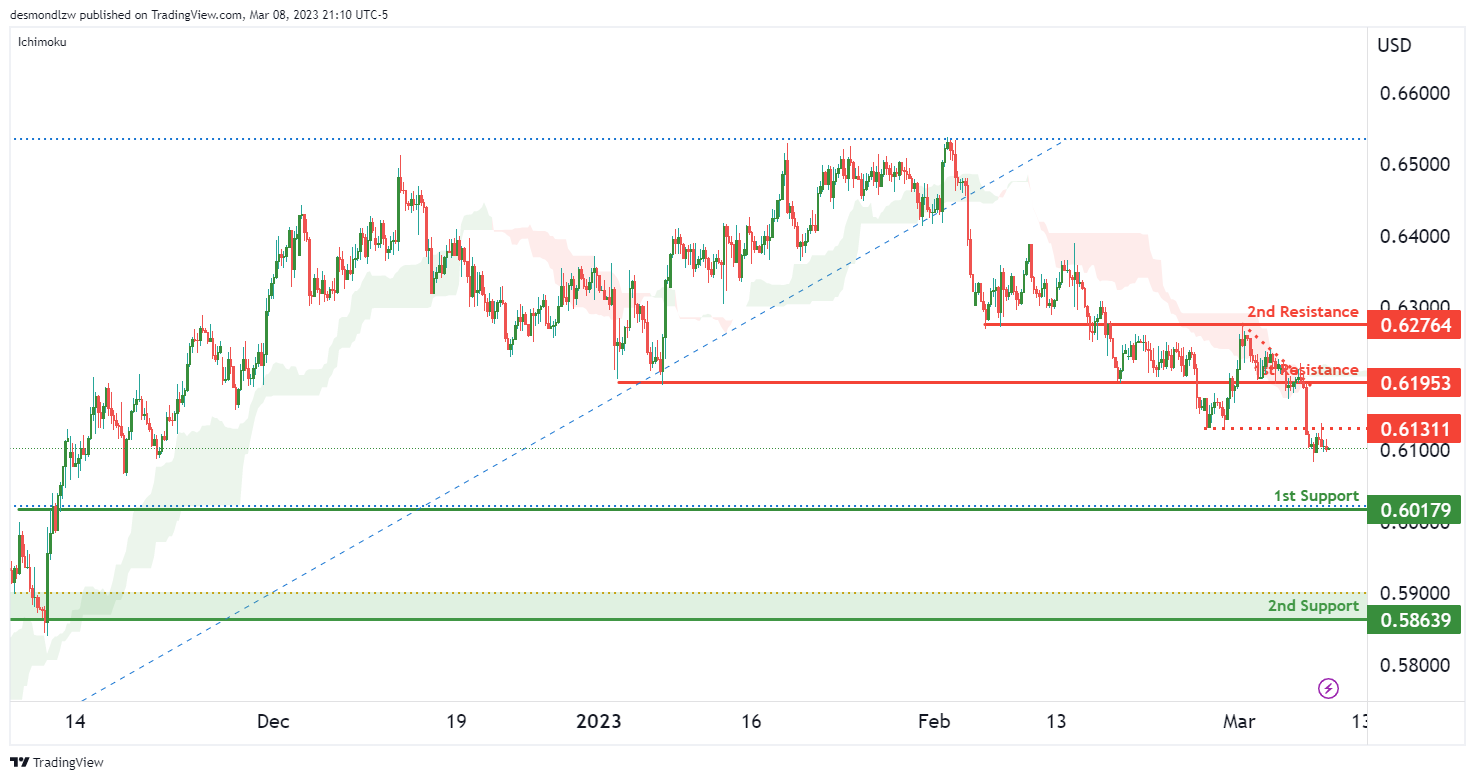
We are currently seeing a strong bearish momentum in the price, and the bearish Ichimoku cloud is pushing prices further down. Price could come down to the 1st support level at 0.6017, and if the price were to break from that level, it could drop down to the 2nd support level at 0.5863, which is another overlap support.
Regarding resistance levels, the 1st resistance is at 0.6131, which is an overlap resistance, and the 2nd resistance is at 0.6276 – yet another overlap resistance.
USD/CAD:
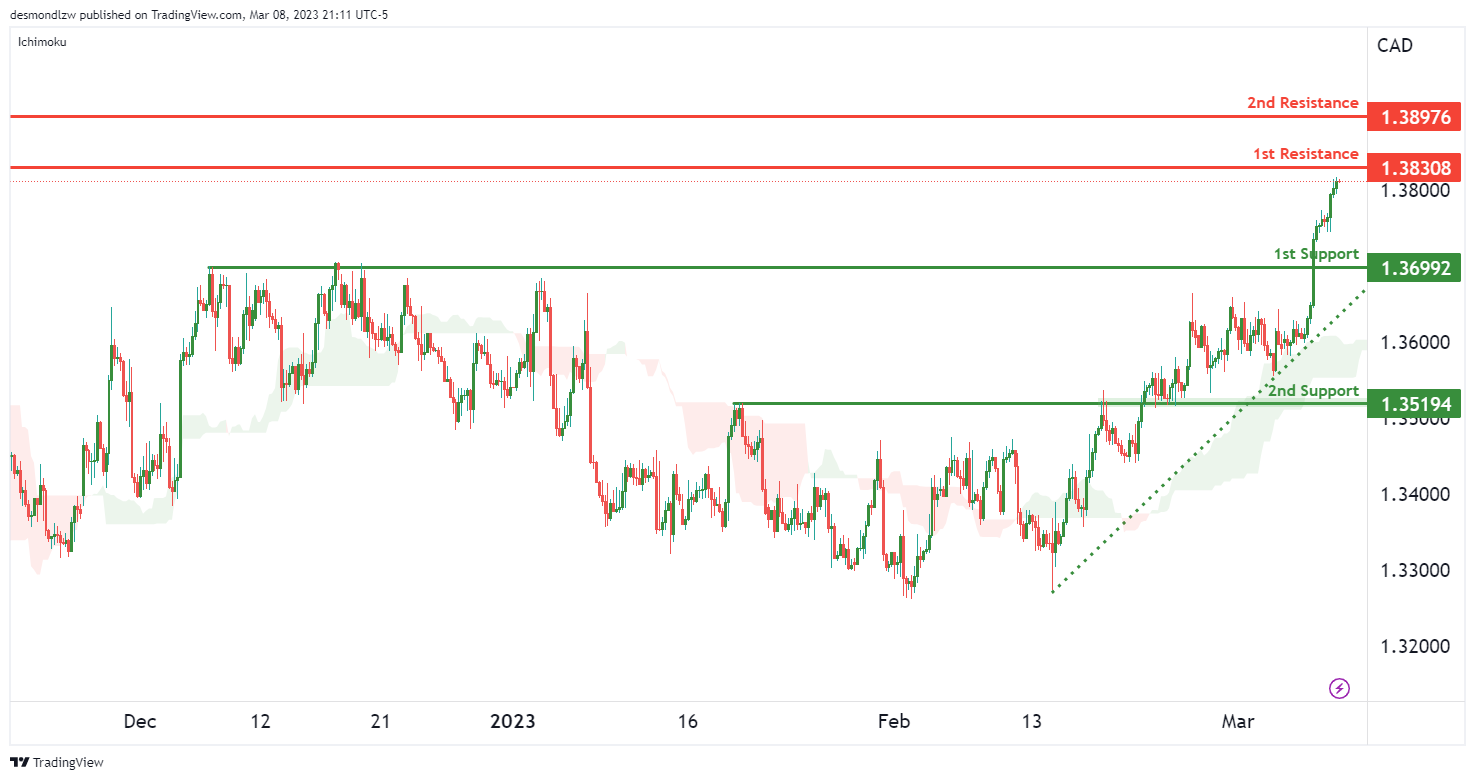
Price is approaching a major resistance at 1.3830 and is seeing strong bullish momentum from our ascending support line and Ichimoku cloud support. The 1st support we’re looking at is at 1.3699 which is a pullback support.
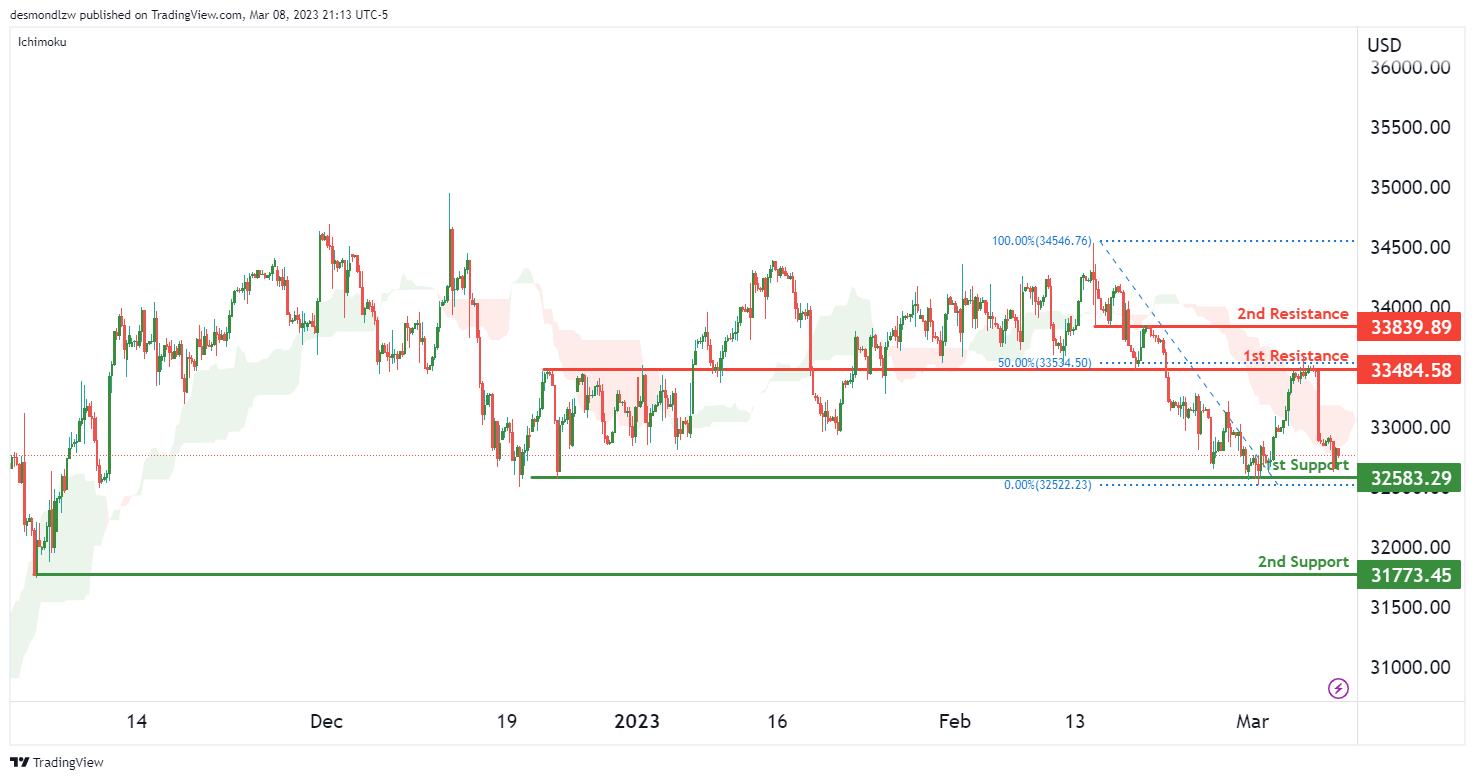
DJ30:
Price is currently dropping towards the 1st support level at 32583. If price were to break this level, the next support level is at 32083, which the price has had multiple touches in the past.
Regarding resistance levels, if price were to break from the 1st resistance level, the next resistance level is at 33839, which is a strong overlap resistance.
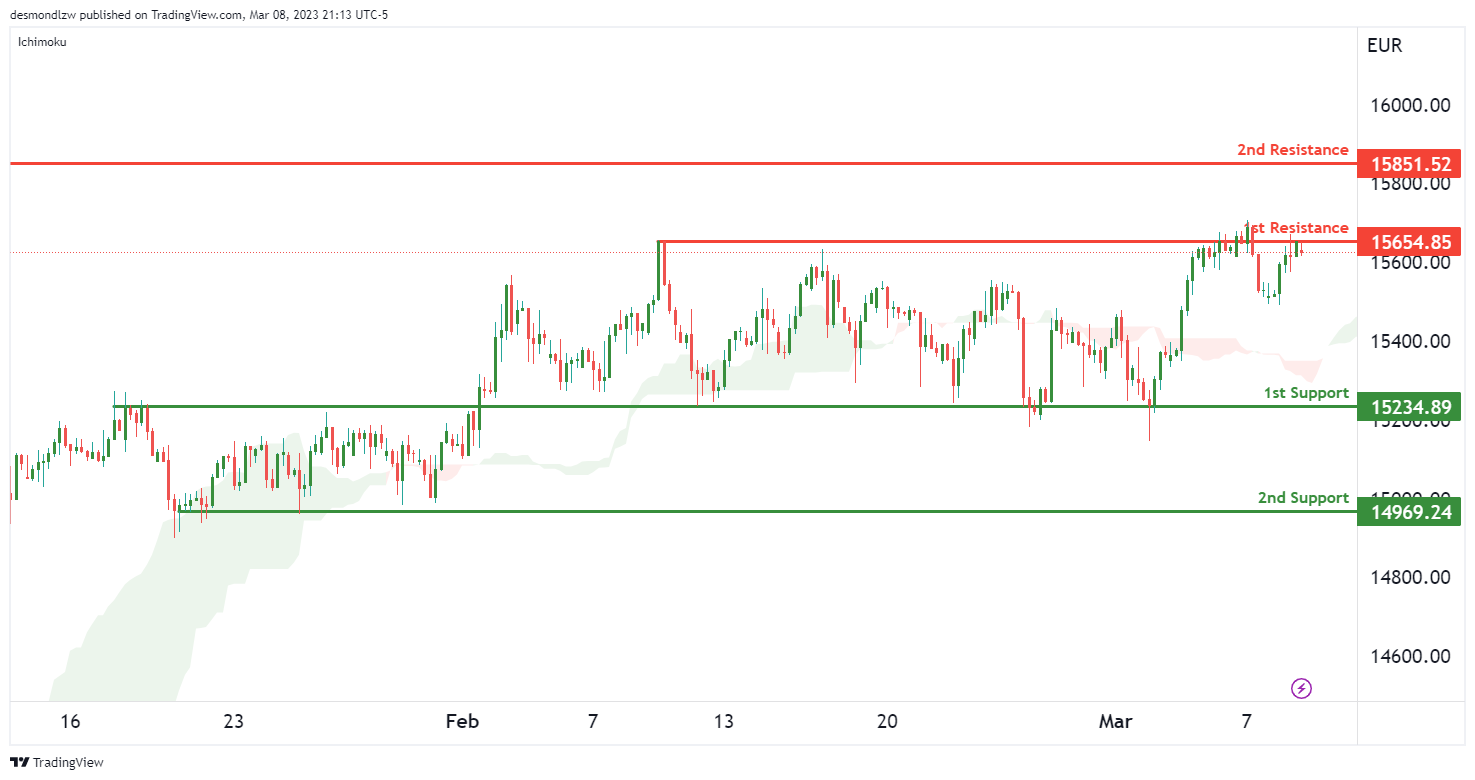
GER30:
Price is testing major swing high resistance at 15654 which is a swing high resistance. If price were to break this level, we could see a push up to 2nd resistance at 15851. However, a reversal from here could see prices drop to 1st support at 15234 which is an overlap support.
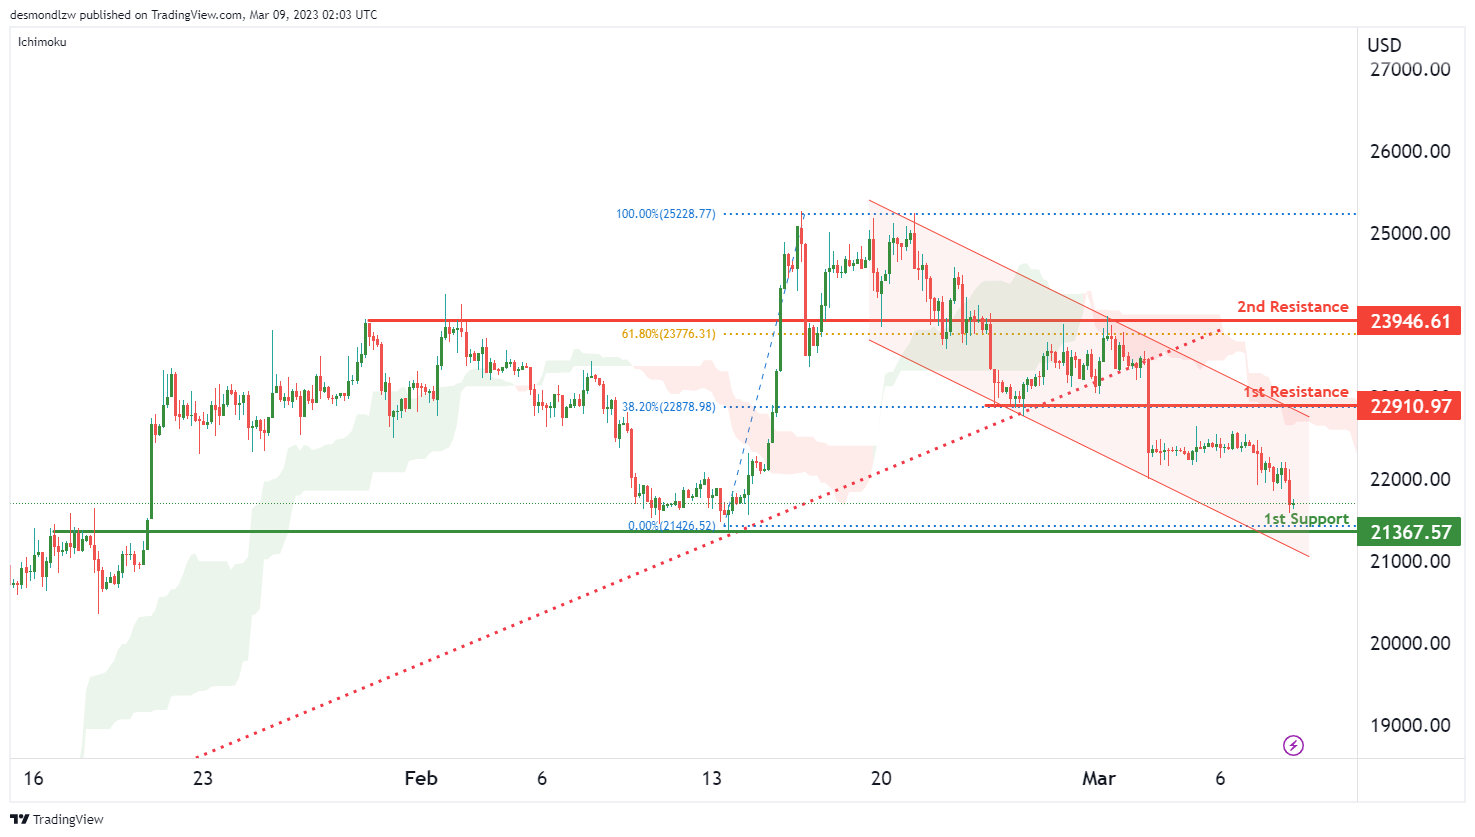
BTC/USD:
Price is in a descending channel and is fast approaching major support at 21367 which is a nice overlap support. From there, we could potentially see a short term bounce as price would be close to the lower support of the channel.
Our 1st resistance is at 22910 which is an overlap resistance.
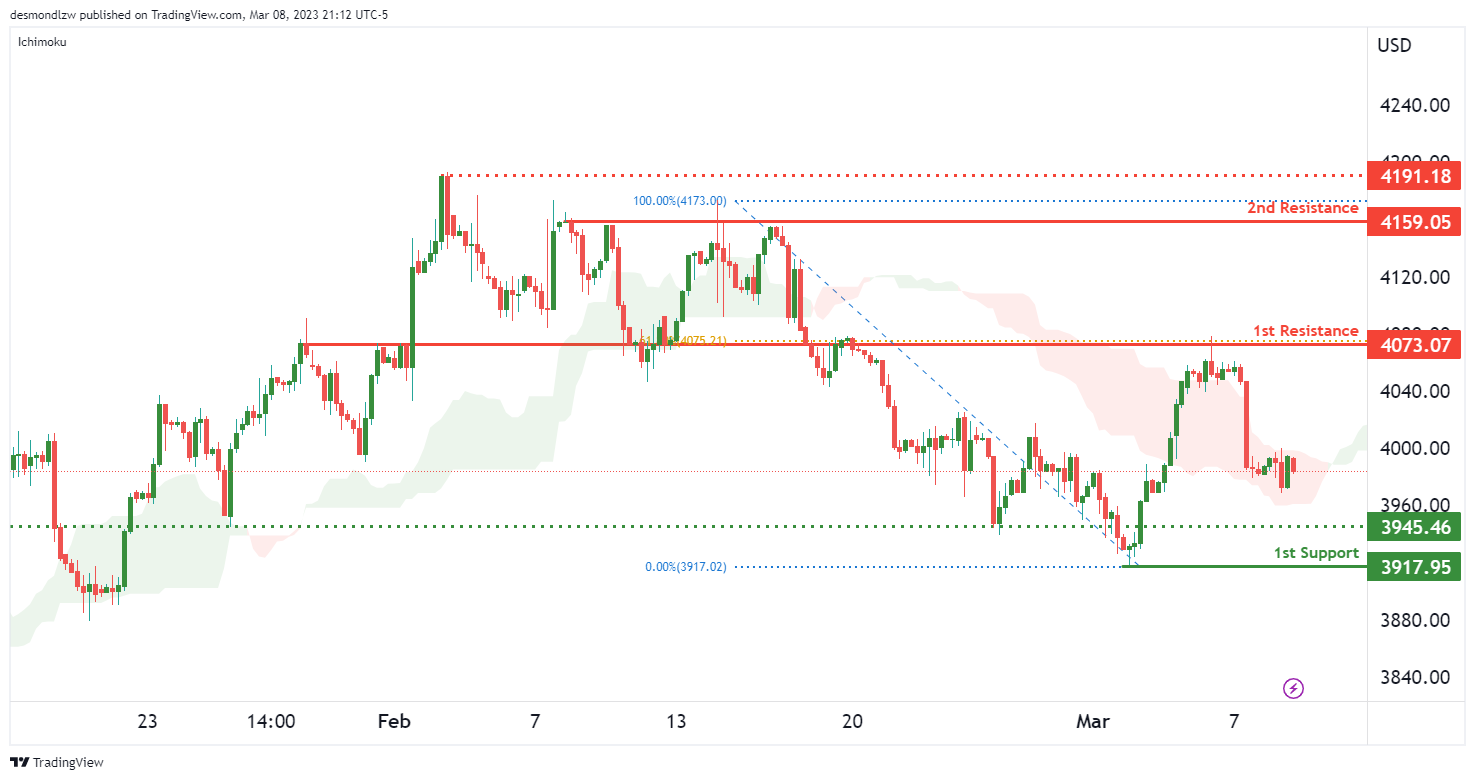
US500
Price has previously reversed from a major overlap resistance at 4073, which also lines up with the 61.8% Fibonacci retracement. We could see it drop to the 1st support level at 3917, which is the recent swing low. Please take note of the intermediate support level at 3945.
If the price were to break from the 1st resistance level, the next resistance level is at 4159.
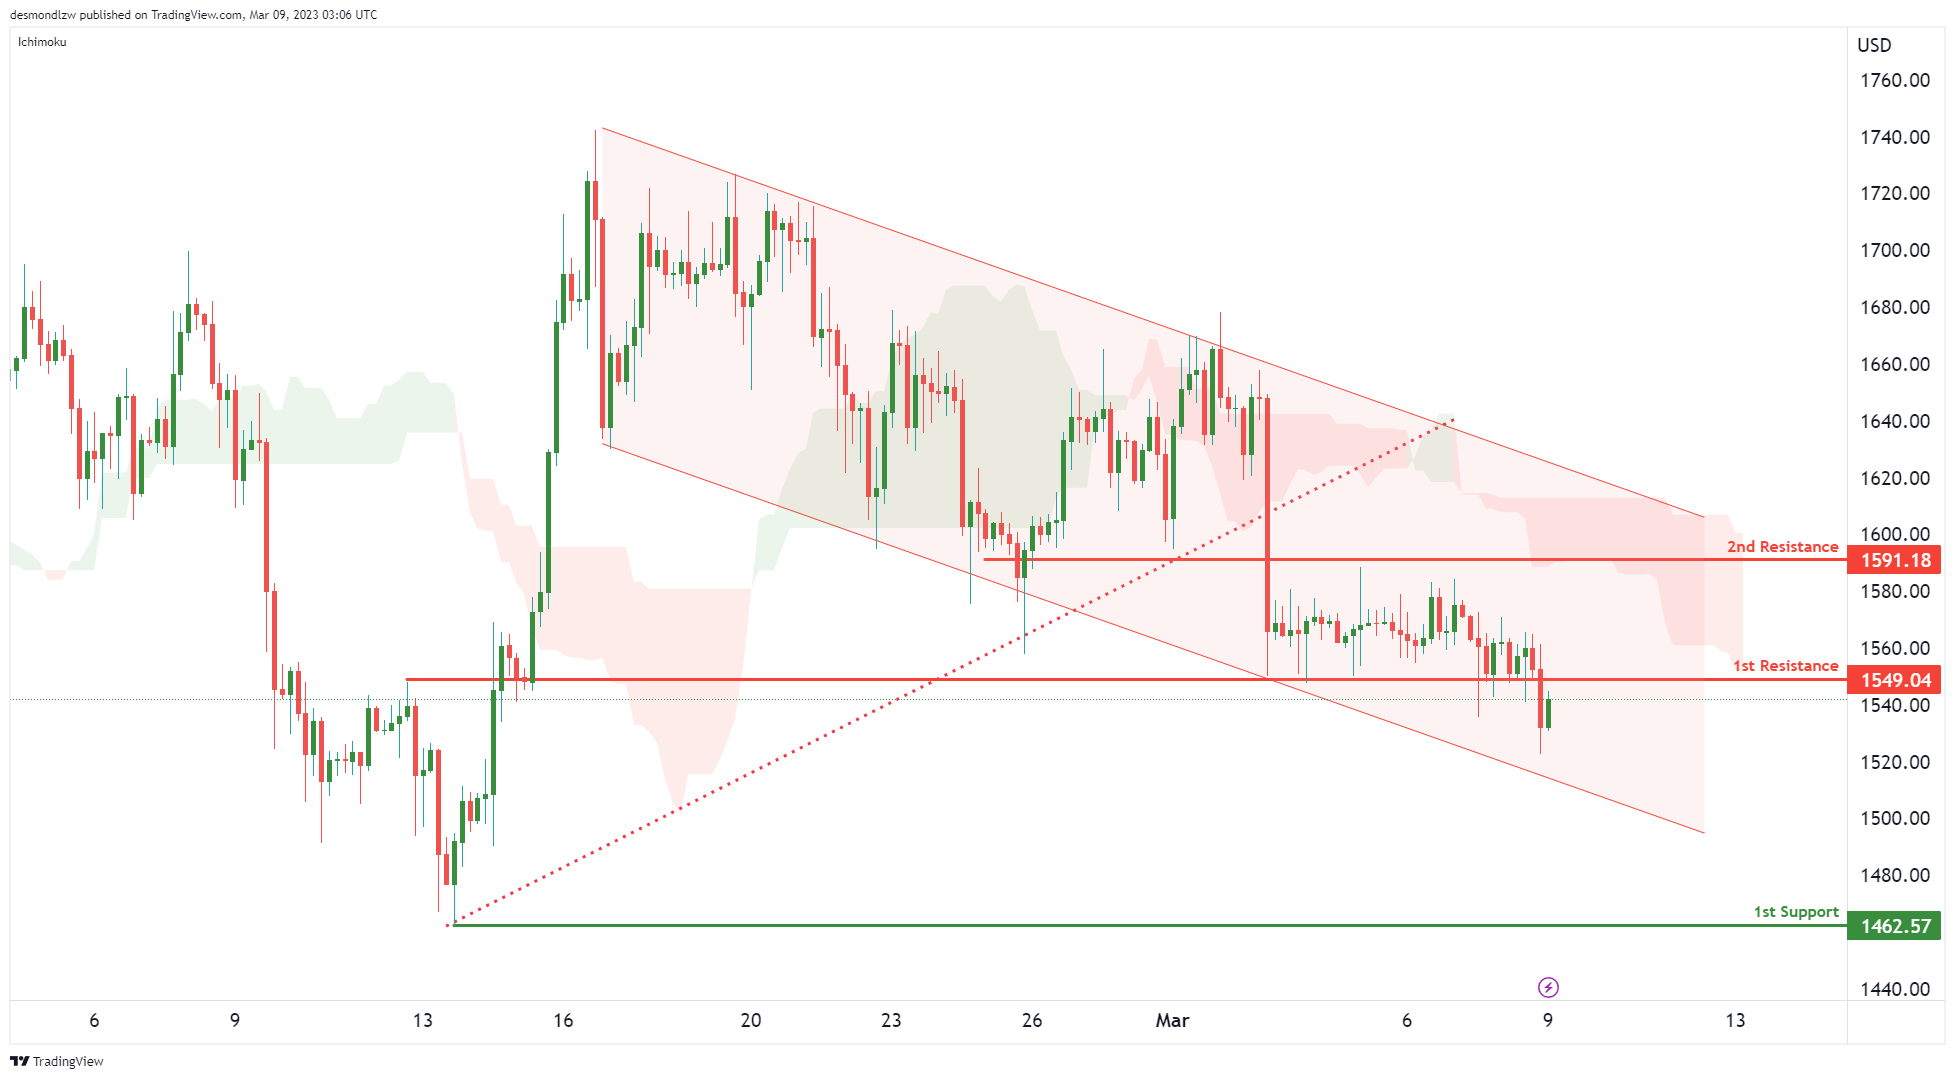
ETH/USD:
Price is in a descending channel and has finally broke our 1st support-turned-resistance at 1549 – this could trigger a bigger move down to 1st support at 1462.
It’s worth noting that there is a bearish Ichimoku cloud which is also pushing prices lower with its bearish momentum.
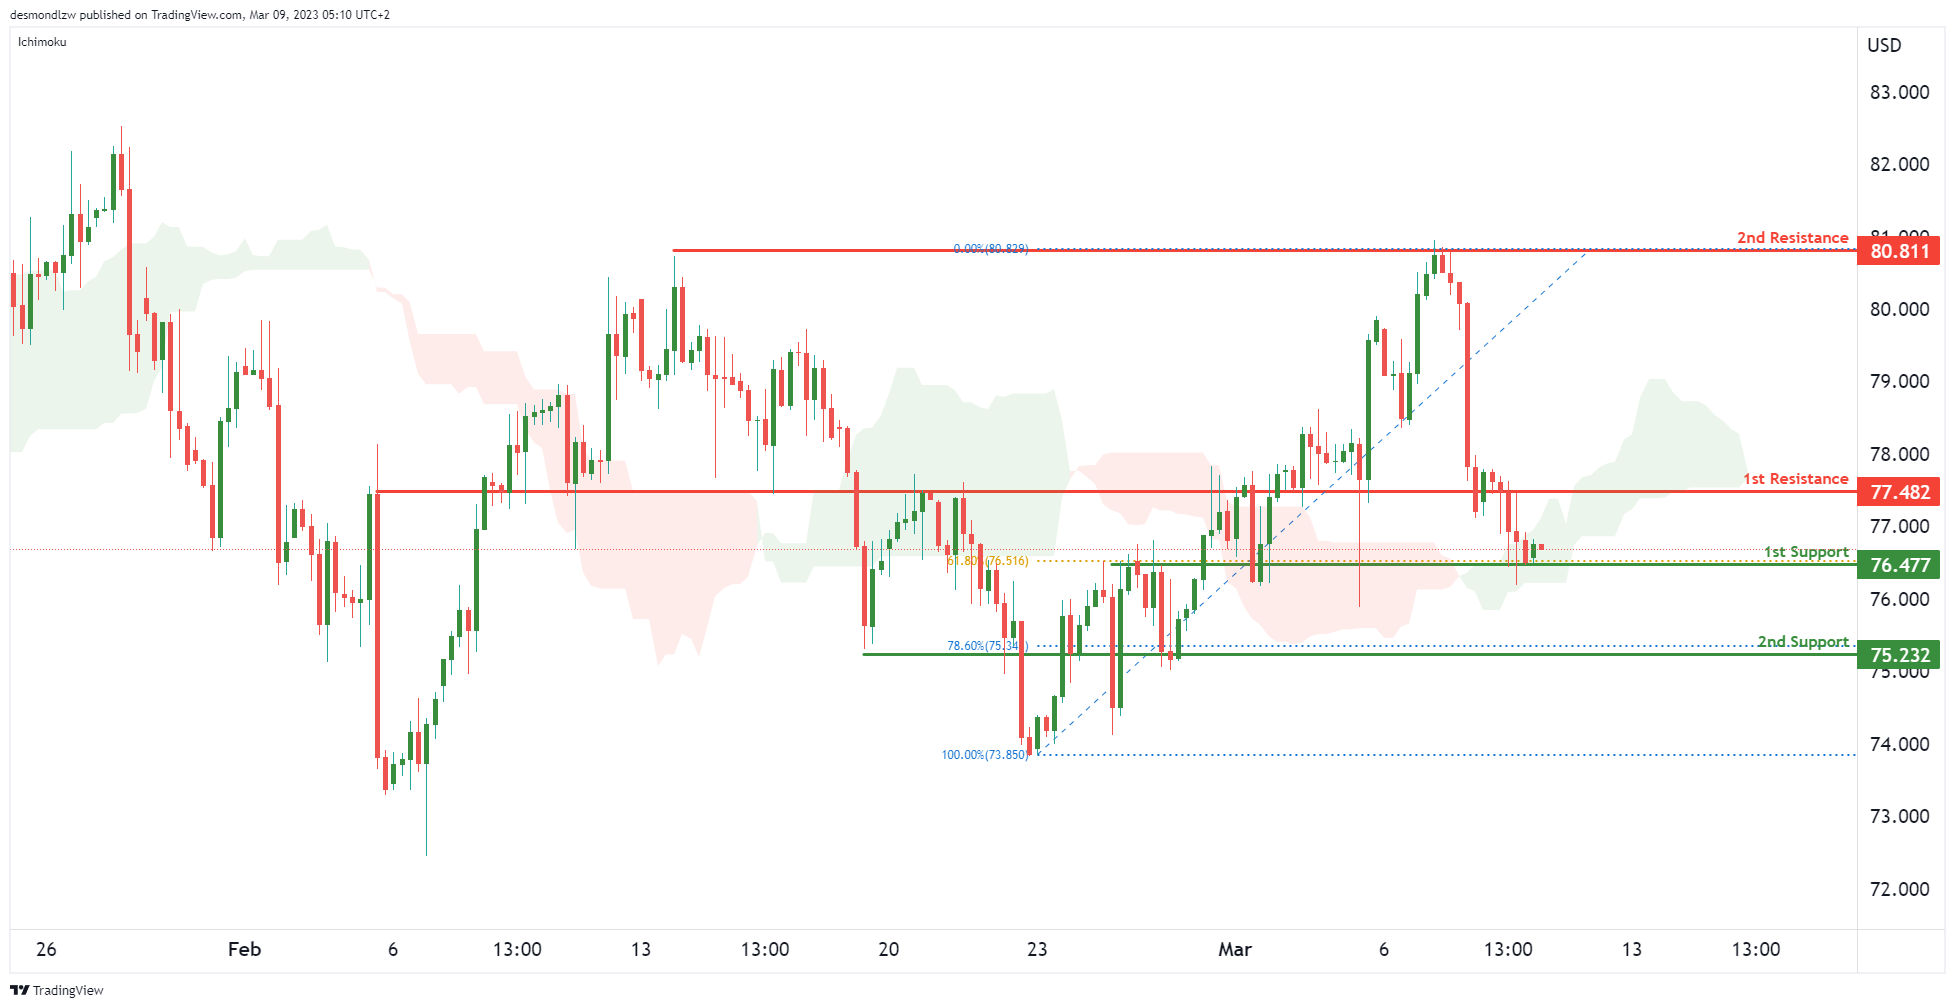
WTI/USD:
Price structure is a big messy on WTI/USD. We do see a first support at 76.47 which is a 61.8% Fibonacci retracement and our 2nd support is at 75.23 which is a 78.6% Fibonacci retracement.
In terms of resistance, we can see an overlap resistance at 77.48 – if price were to break that resistance, the next closest resistance is all the way up at 80.81 which is a major swing high resistance.
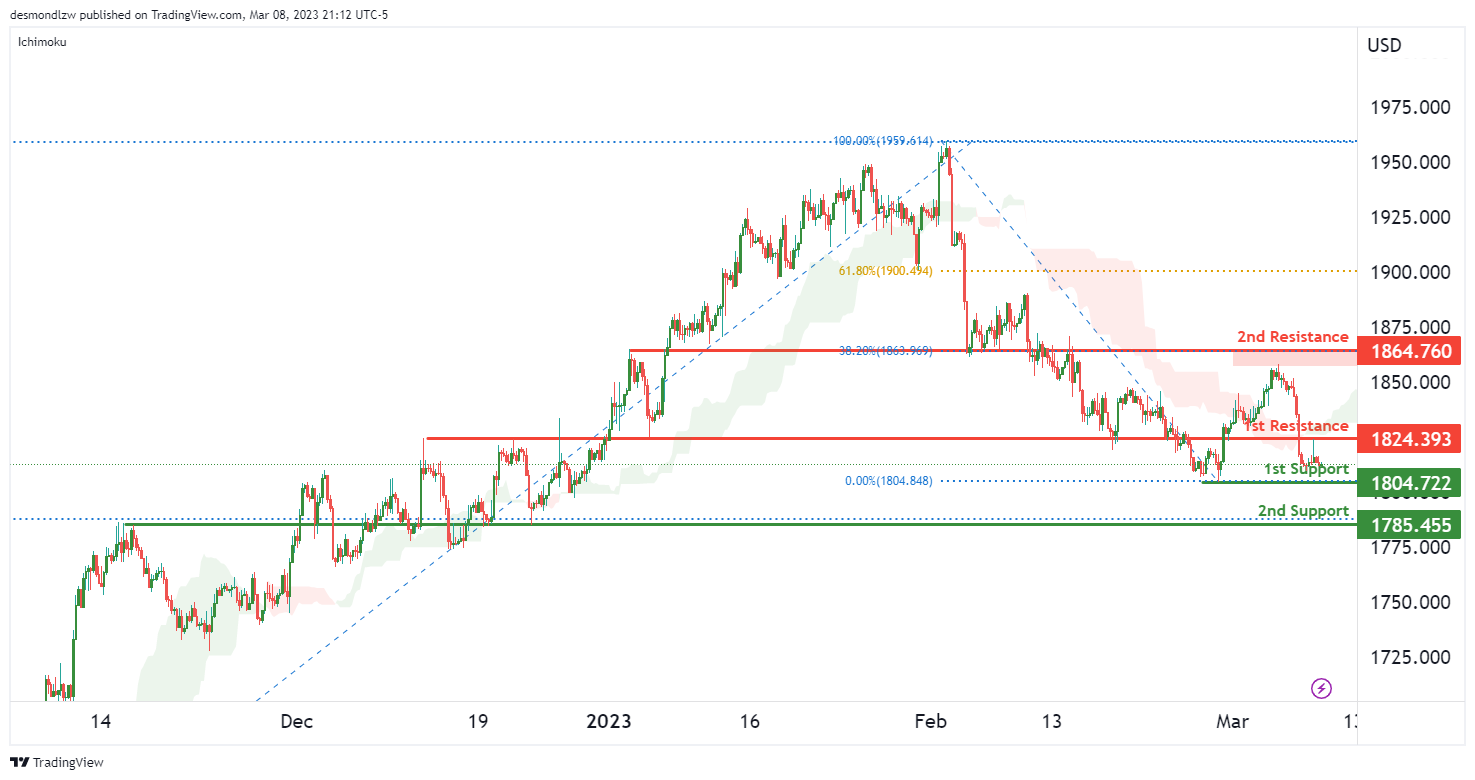
XAU/USD (GOLD):
Price is testing our 1st support level at 1804, which is an overlap support. If the price were to break from this level, we could see it drop back down to the 2nd support level at 1785, which is a major overlap support.
Regarding resistance levels, our 1st resistance level is at 1824, which is an overlap resistance, and the 2nd resistance level is at 1864, which is an overlap resistance that lines up with the 38.2% Fibonacci retracement.


