
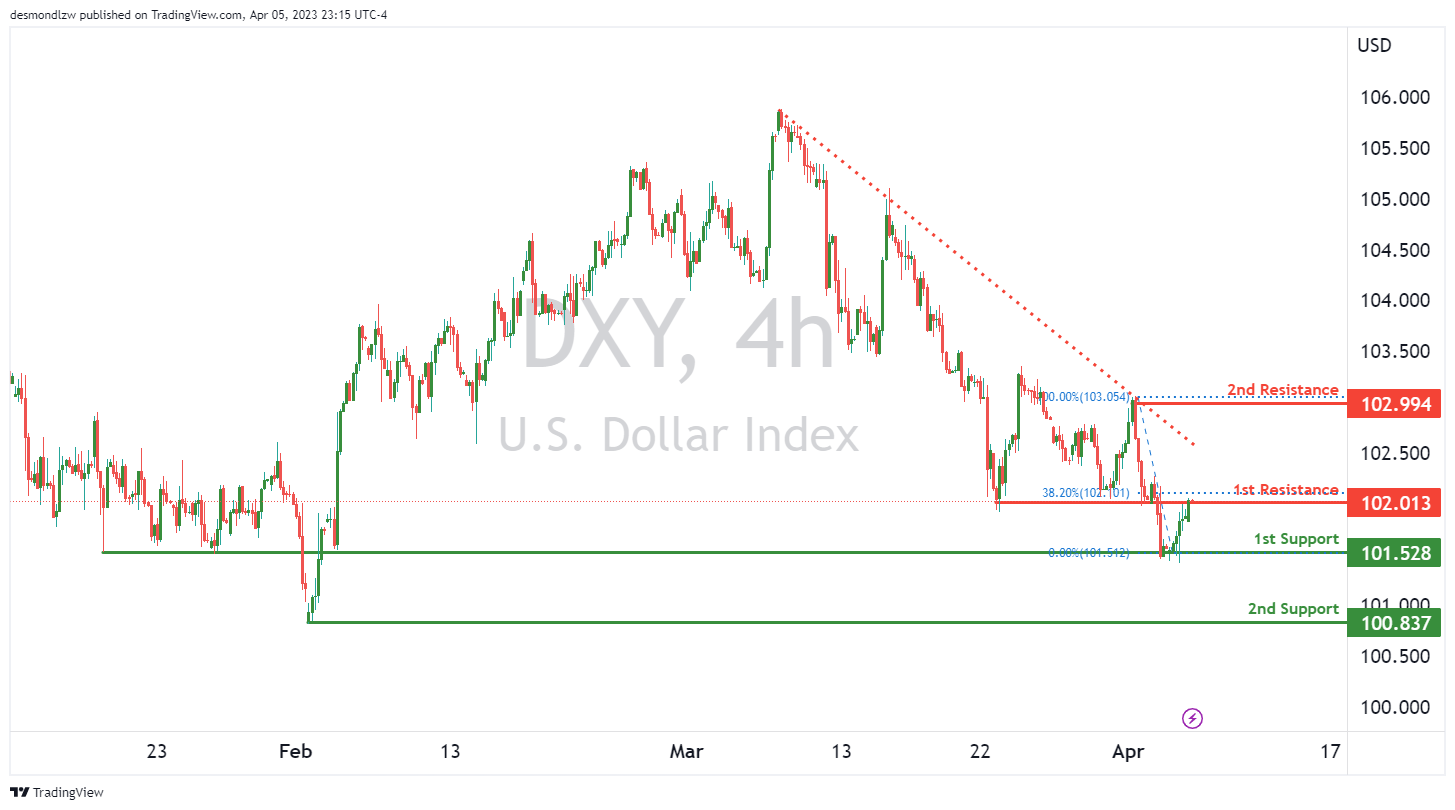
DXY:
The DXY chart is currently showing strong bearish momentum, with price below a major descending trend line, indicating that further bearish momentum may be in the cards.
Looking at the chart, it is possible that price may make a bearish reaction off the 1st resistance level and drop towards the 1st support level at 101.52. This level is a pullback support, which has been significant in the past and could potentially provide a strong support level.
Moving lower, the 2nd support level is at 100.83, which is a swing low support level. This level has also been significant in the past and is likely to provide support if the price were to drop further.
On the other hand, the 1st resistance level is at 102.01, which is a swing high resistance level. This level coincides with a 38.20% Fibonacci retracement, adding further significance to its potential as a resistance level. If the price were to break through this level, it may lead to a potential rise towards the 2nd resistance level at 102.99, which is another swing high resistance level.
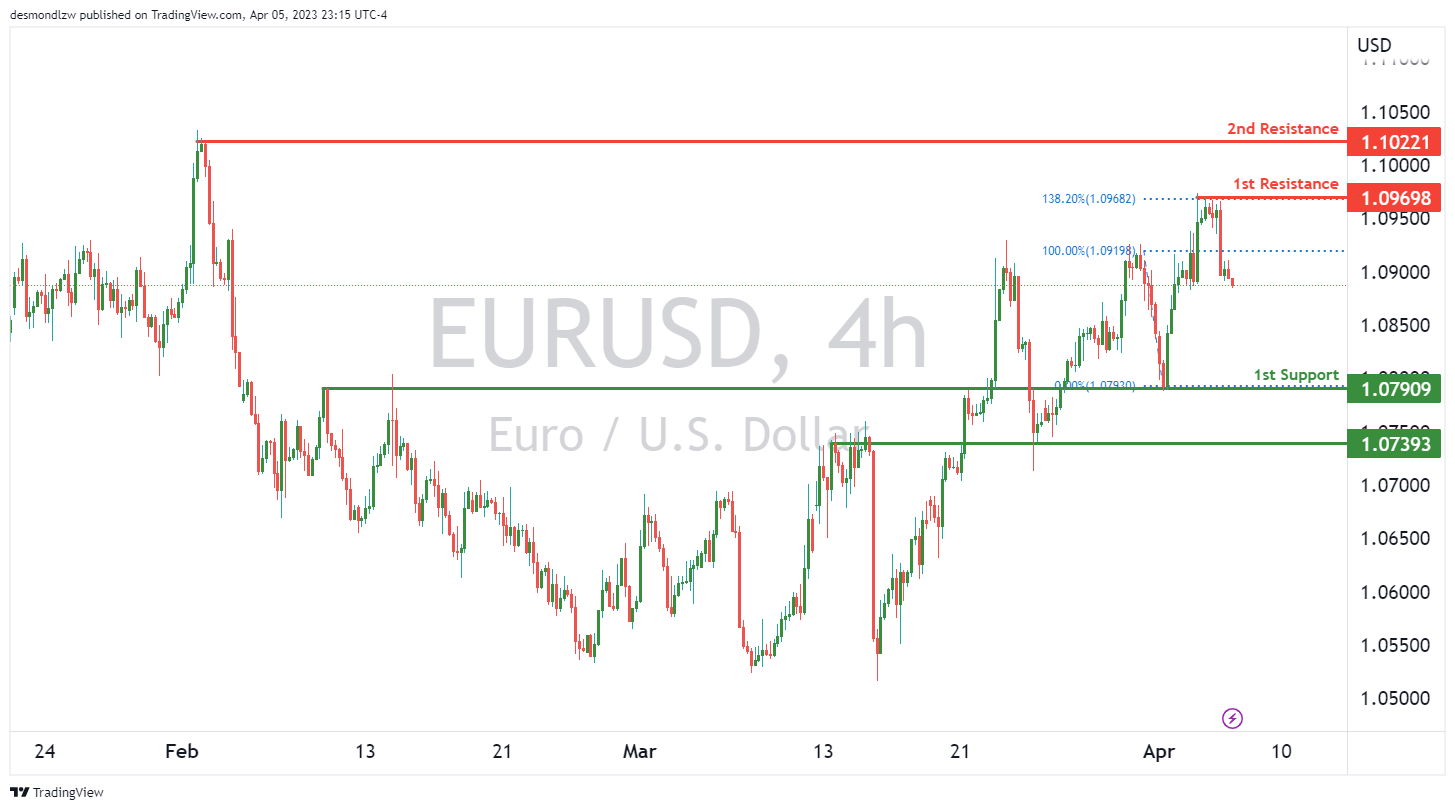
EUR/USD:
The EUR/USD chart is currently showing bearish momentum, with the potential for further downside towards the 1st support level at 1.0790. This support level is significant as it represents an overlap support, meaning that it has been tested multiple times in the past and is likely to provide a strong level of buying interest. Additionally, there is a secondary support level at 1.0739, which is also an overlap support and may act as a potential downside target if price were to break below the 1st support.
On the other hand, the chart shows that there is resistance at the 1st resistance level of 1.0969. This level has been tested multiple times in the past and is a multi-swing high resistance, indicating that it is likely to provide strong selling interest. Furthermore, this resistance level aligns with the 138.20% Fibonacci Extension level, adding more significance to its potential as a strong resistance level. There is also a secondary resistance level at 1.1022, which is a swing high resistance and may act as a potential upside target if price were to break above the 1st resistance.
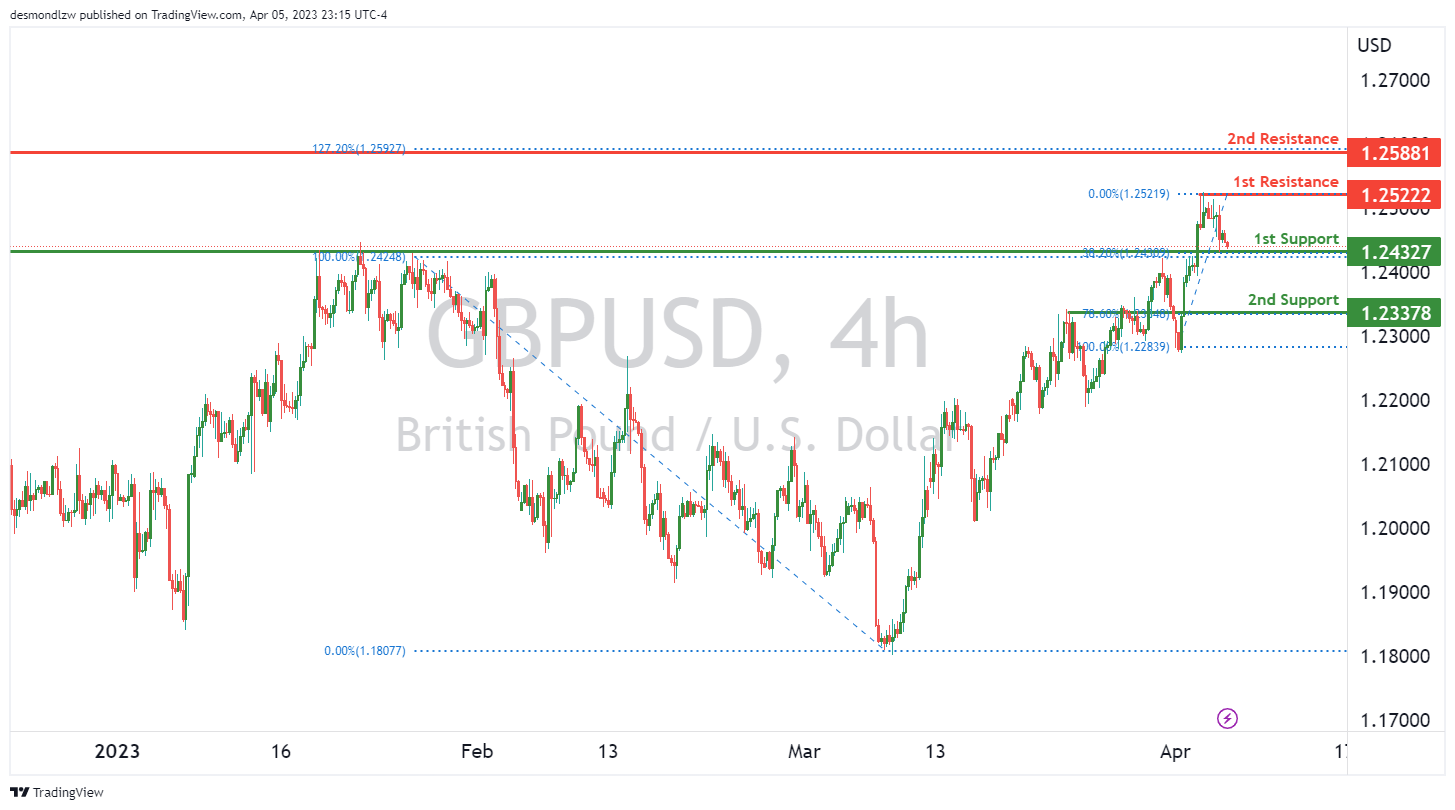
GBP/USD:
The GBP/USD chart is currently showing bearish momentum, with potential for a bearish break off the 1st support level and a drop towards the 2nd support.
The 1st support level is at 1.2432, which is a strong overlap support level that also happens to line up with a 38.20% Fibonacci retracement. This makes it a good level for potential buying opportunities, but if the price were to break below this level, it could trigger further bearish momentum.
The 2nd support level is at 1.2337, which is a pullback support level that coincides with a 78.60% Fibonacci retracement. This level has also been a previous support level that the price has bounced off of in the past, making it another potential buying opportunity.
In terms of resistance levels, the 1st resistance level is at 1.2522, which is a multi-swing high resistance level that lines up with a 138.20% Fibonacci extension. This level may prove difficult for the price to break above, and a reversal might occur to push prices back down towards the 1st support level.
The 2nd resistance level is at 1.2588, which is a swing high resistance level. If the price were to break above this level, it could potentially lead to further bullish momentum.
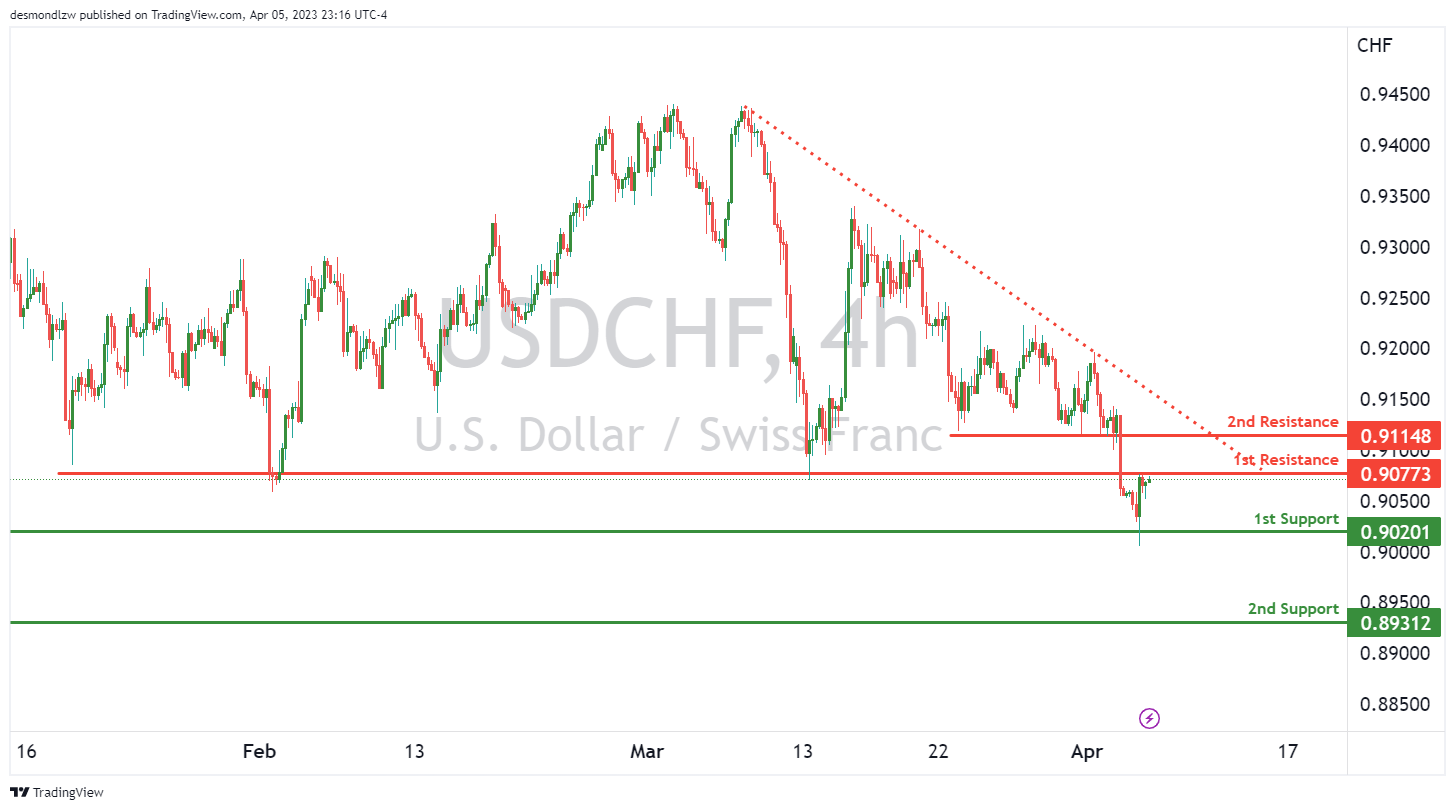
USD/CHF:
The USD/CHF chart is currently showing bearish momentum, with price below a major descending trend line which suggests the possibility of further downside movement.
Looking at the potential price movement, there is a chance for a bearish reaction off the 1st resistance level, which could result in a drop towards the 1st support.
The 1st support level is located at 0.9020, and is a swing low support level that could potentially hold and cause price to bounce back up. If the 1st support level does not hold, the next support level is at 0.8931, which is another swing low support level that has previously held and could potentially do so again.
On the resistance side, the 1st resistance level is at 0.9077 and is an overlap resistance level. If price were to break above this level, it could potentially continue to rise towards the 2nd resistance at 0.9114, which is a pullback resistance level.
USD/JPY:
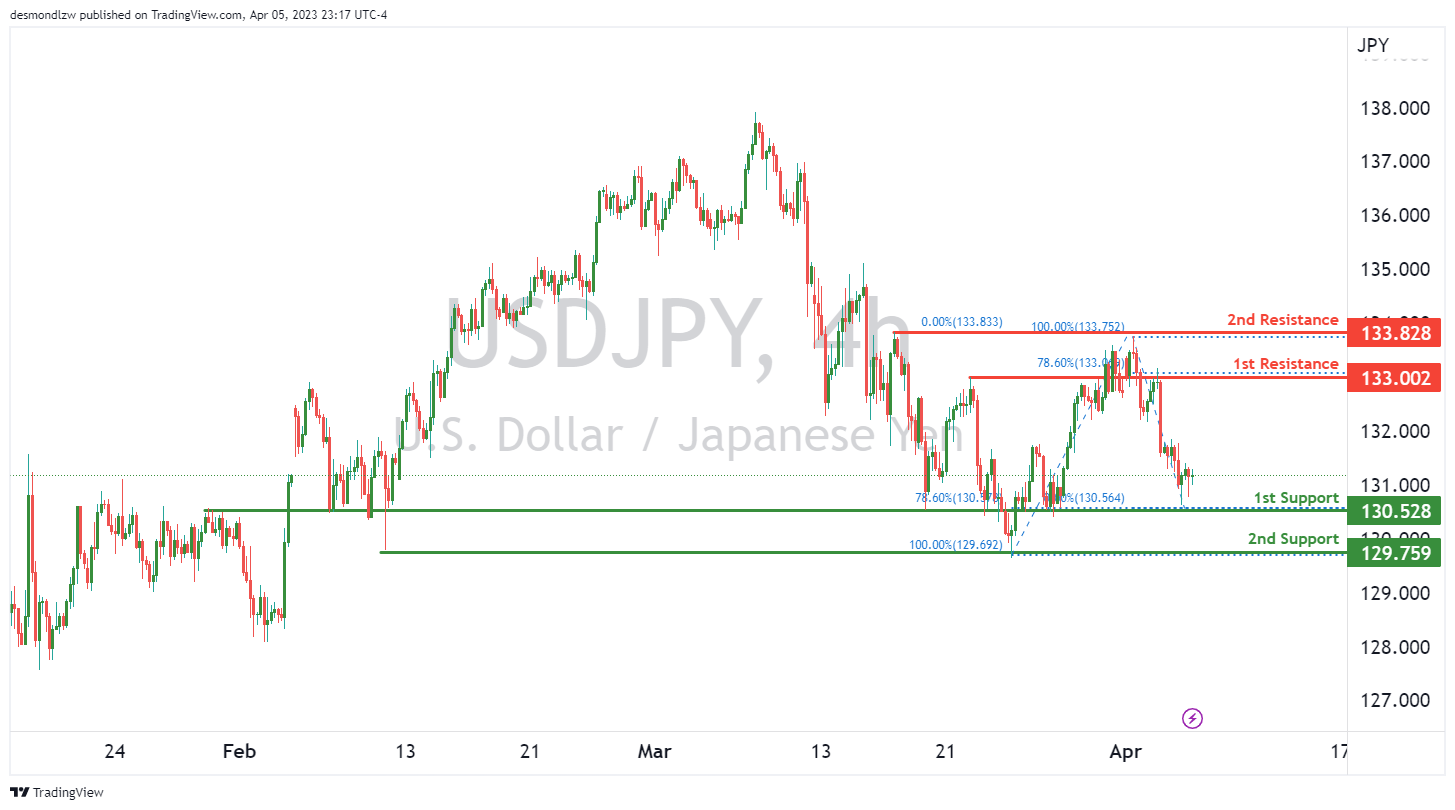
The USD/JPY chart has an overall bullish momentum, indicating that prices are likely to continue to rise. There are no specific factors contributing to the momentum at the moment.
Price could potentially continue to rise towards the 1st resistance level at 133.00. This level is a pullback resistance and is supported by a 78.60% Fibonacci retracement. If price manages to break through this resistance, it could potentially rise towards the 2nd resistance at 133.82 which is a multi-swing high resistance.
On the other hand, if the price were to decline, it could find support at the 1st support level of 130.52. This level is a strong overlap support and is also supported by a 78.60% Fibonacci retracement. If the price bounces off this support level, it could rise towards the 1st resistance level.
If the 1st support level fails to hold, the price could drop towards the 2nd support level at 129.75. This level is a multi-swing low support that the price has bounced off multiple times in the past.
Overall, the USD/JPY chart has a bullish bias, and the price could potentially rise towards the 1st resistance level at 133.00. However, if the support levels fail to hold, the price could drop towards the 2nd support level at 129.75.
AUD/USD:
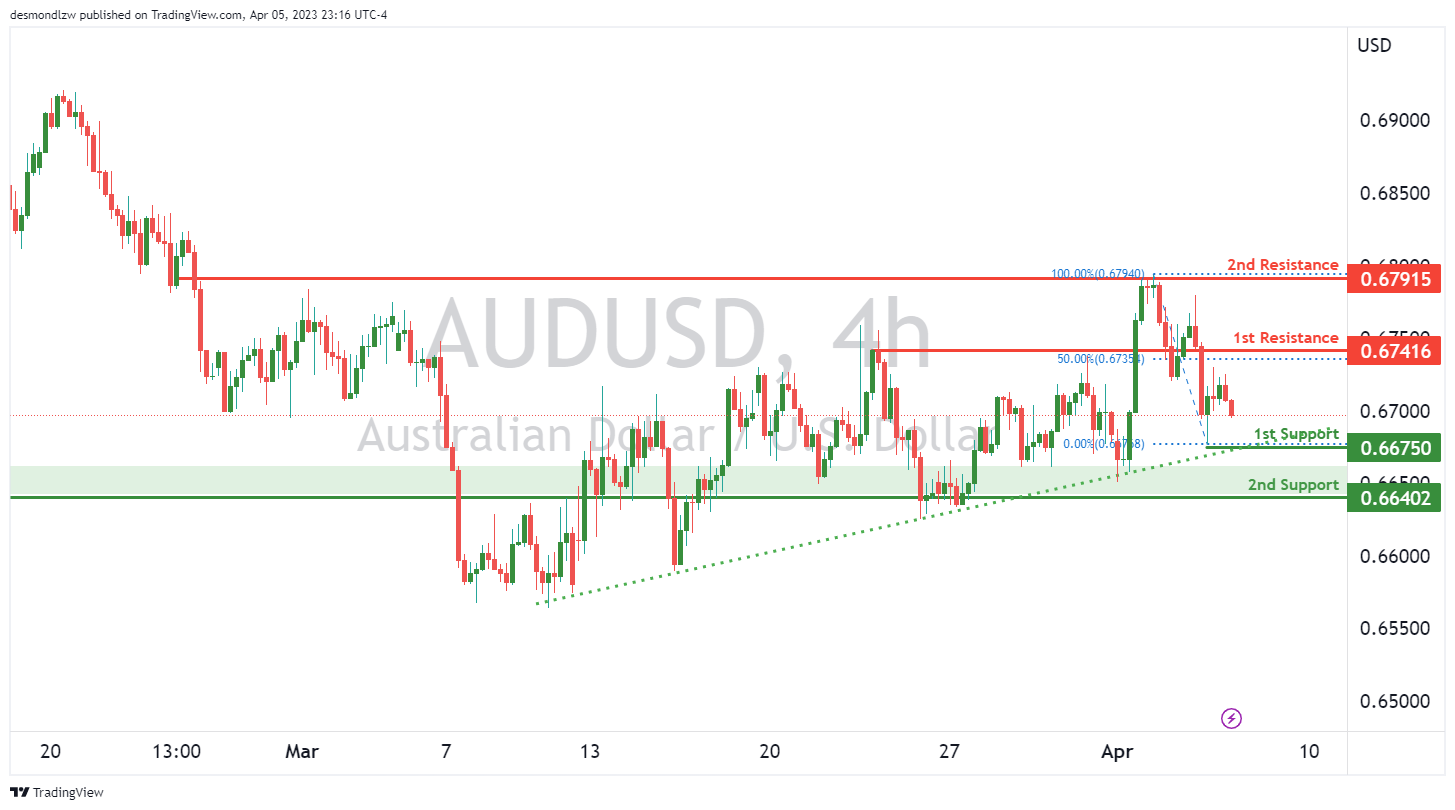
The AUD/USD chart has an overall bearish momentum, with price potentially continuing to drop towards the first support level. However, it’s worth noting that price is currently above a major ascending trend line which suggests further bullish momentum in the future.
If price were to continue downwards, it could potentially find support at the first support level of 0.6675. This level is a strong swing low support that has held in the past. If price were to break below this level, the next support level to look out for would be the second support level at 0.6640. This level is also an overlap support level and could provide additional support for price.
On the upside, there is a first resistance level at 0.6741 which coincides with a pullback resistance and the 50% Fibonacci retracement level. If price were to bounce off the first support level and continue to rise, it could potentially reach this level. The second resistance level is at 0.6791 and is a multi-swing high resistance level. If price were to break above this level, it could signal a shift in momentum towards a more bullish direction.
NZD/USD:
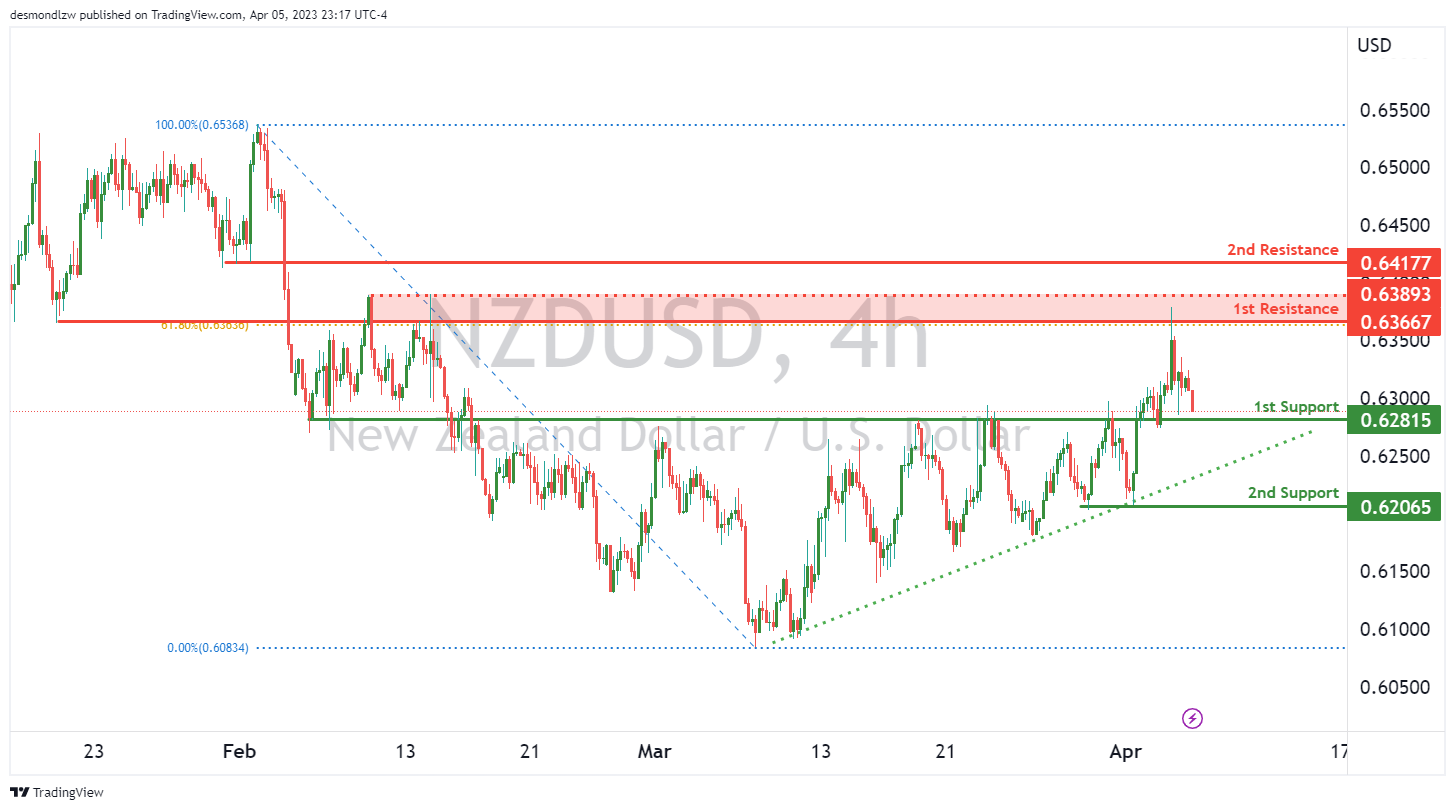
The NZD/USD chart is currently showing bearish momentum with the possibility of further downside potential. Price is currently above a major ascending trend line which could suggest bullish momentum, but other factors seem to suggest otherwise.
Price could potentially make a bearish continuation towards the 1st support level at 0.6281. This level is considered an overlap support and may offer some level of support to price. If the 1st support level is broken, the next support level to watch is the 2nd support at 0.6206. This support level has previously acted as a multi-swing low support and may offer stronger support to price.
On the resistance side, the 1st resistance level is at 0.6366. This level is considered a pullback resistance and coincides with a 61.80% Fibonacci retracement level. If price were to rise and break through the 1st resistance, the next level to watch is the 2nd resistance at 0.6417, which is also a pullback resistance level.
USD/CAD:
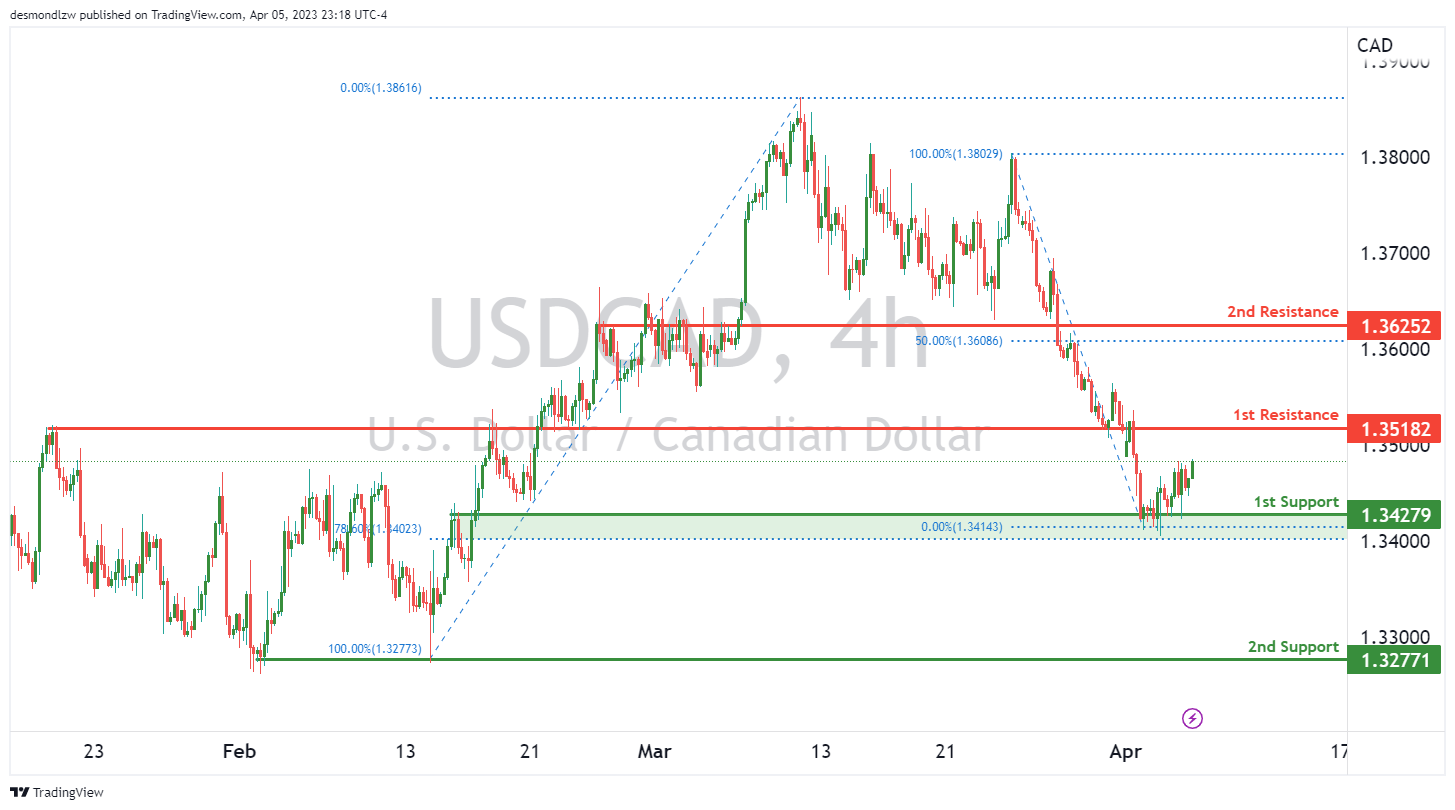
The USD/CAD chart is currently showing bullish momentum, indicating that the price of the pair might continue to rise in the near future. There are no clear factors contributing to the momentum at the moment.
The price could potentially make a bullish continuation towards the 1st resistance level, which is at 1.3518. This level is a pullback resistance level. If the price breaks through this level, it could potentially rise towards the 2nd resistance level at 1.3625. This level is a pullback resistance level and coincides with the 50% Fibonacci retracement.
On the other hand, if the price were to drop, it could potentially find support at the 1st support level of 1.3427. This level is an overlap support level and has a 78.60% Fibonacci retracement lining up with it. If the price breaks through the 1st support level, it could potentially drop towards the 2nd support level at 1.3277. This level is a multi-swing low support level.
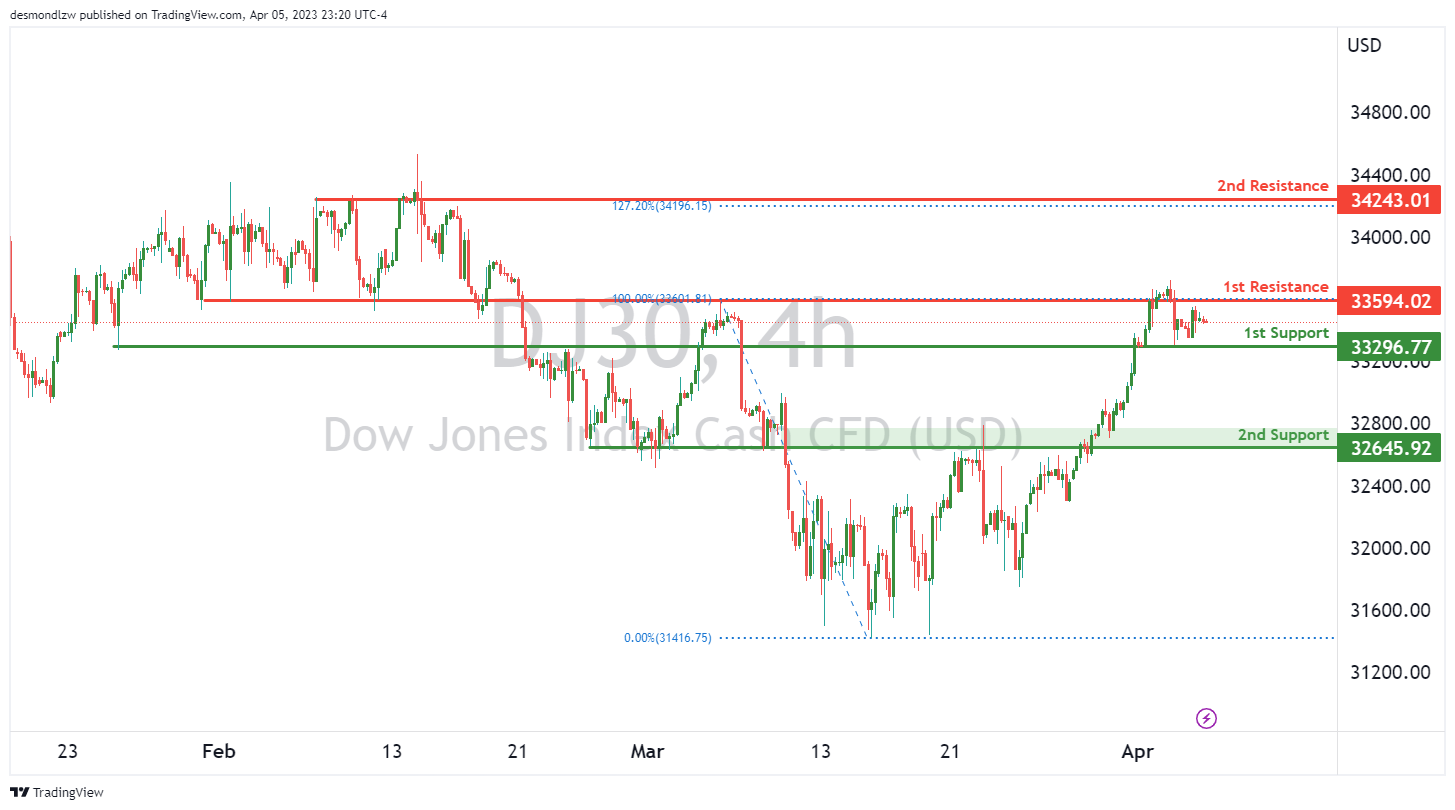
DJ30:
The Dow Jones Industrial Average (DJ30) is currently exhibiting bearish momentum, and there are several factors contributing to this. The price is currently below a major descending trend line, which suggests that bearish momentum is likely to continue.
In terms of potential price movement, there is a possibility of a bearish continuation towards the first support level of 33296.77, which is a strong overlap support. If the price were to break this level, it could drop to the second support level of 32645.92, which is a pullback support.
On the other hand, the first resistance level of 33594.02 is an overlap resistance, and if the price were to rise, it could potentially reach this level before encountering any significant resistance. If the price breaks above the first resistance level, the next resistance level is at 34243.01, which is a multi-swing high resistance.
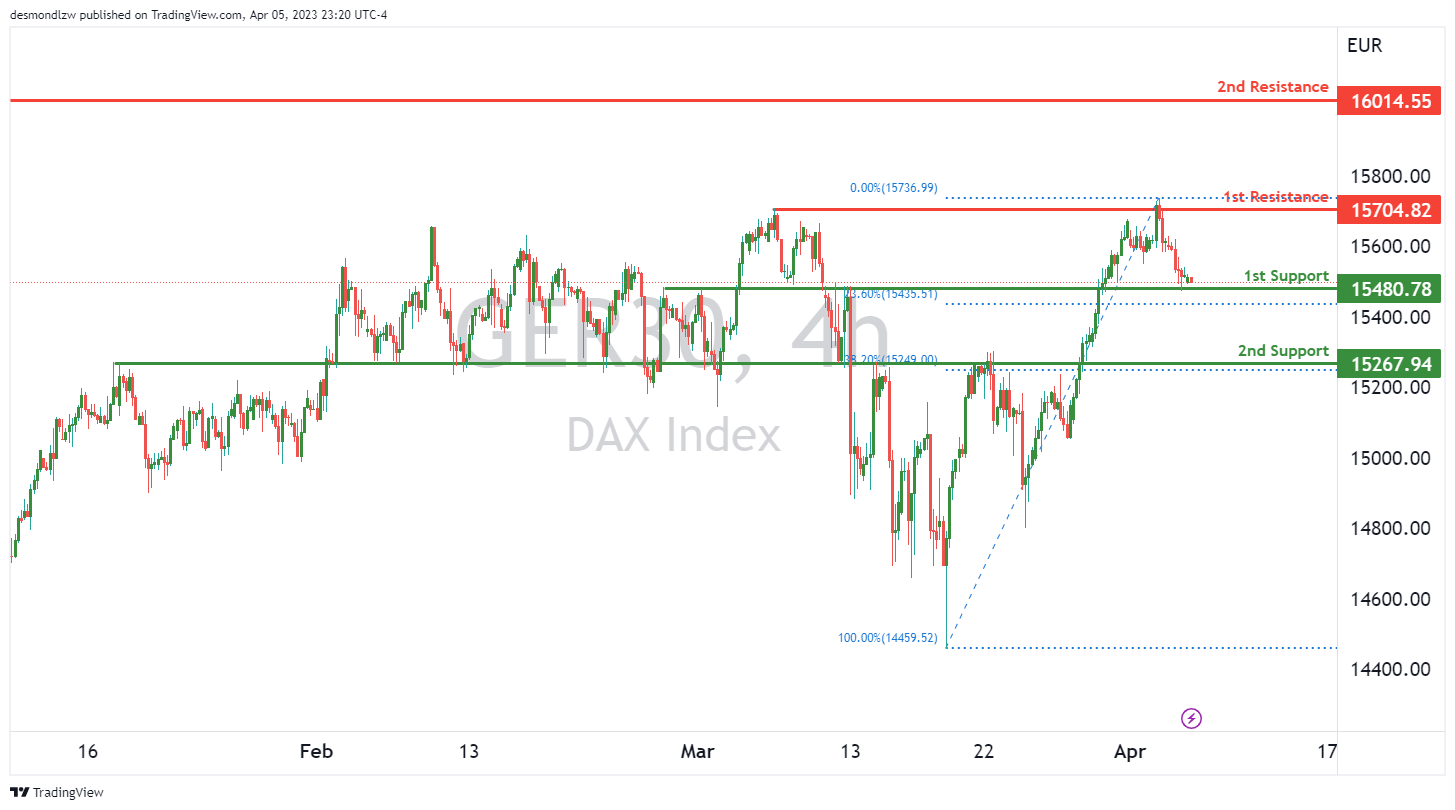
GER30:
The GER30 chart is currently showing bullish momentum, with potential for a bullish bounce off the 1st support and a move towards the 1st resistance. The 1st support level at 15480.78 is an overlap support and lines up with a 23.60% Fibonacci retracement, making it a strong level to watch. If the price were to bounce off this support, it could rise towards the 1st resistance at 15704.82 which is a multi-swing high resistance.
In case the price breaks the 1st support level, the next support to watch out for is the 2nd support at 15267.94 which is another overlap support and has a 38.20% Fibonacci retracement lining up with it.
The 1st resistance level at 15704.82 is a strong level to watch out for, as it is a multi-swing high resistance level. If the price were to break this resistance, it could potentially rise towards the 2nd resistance level at 16014.55 which is a swing high resistance.
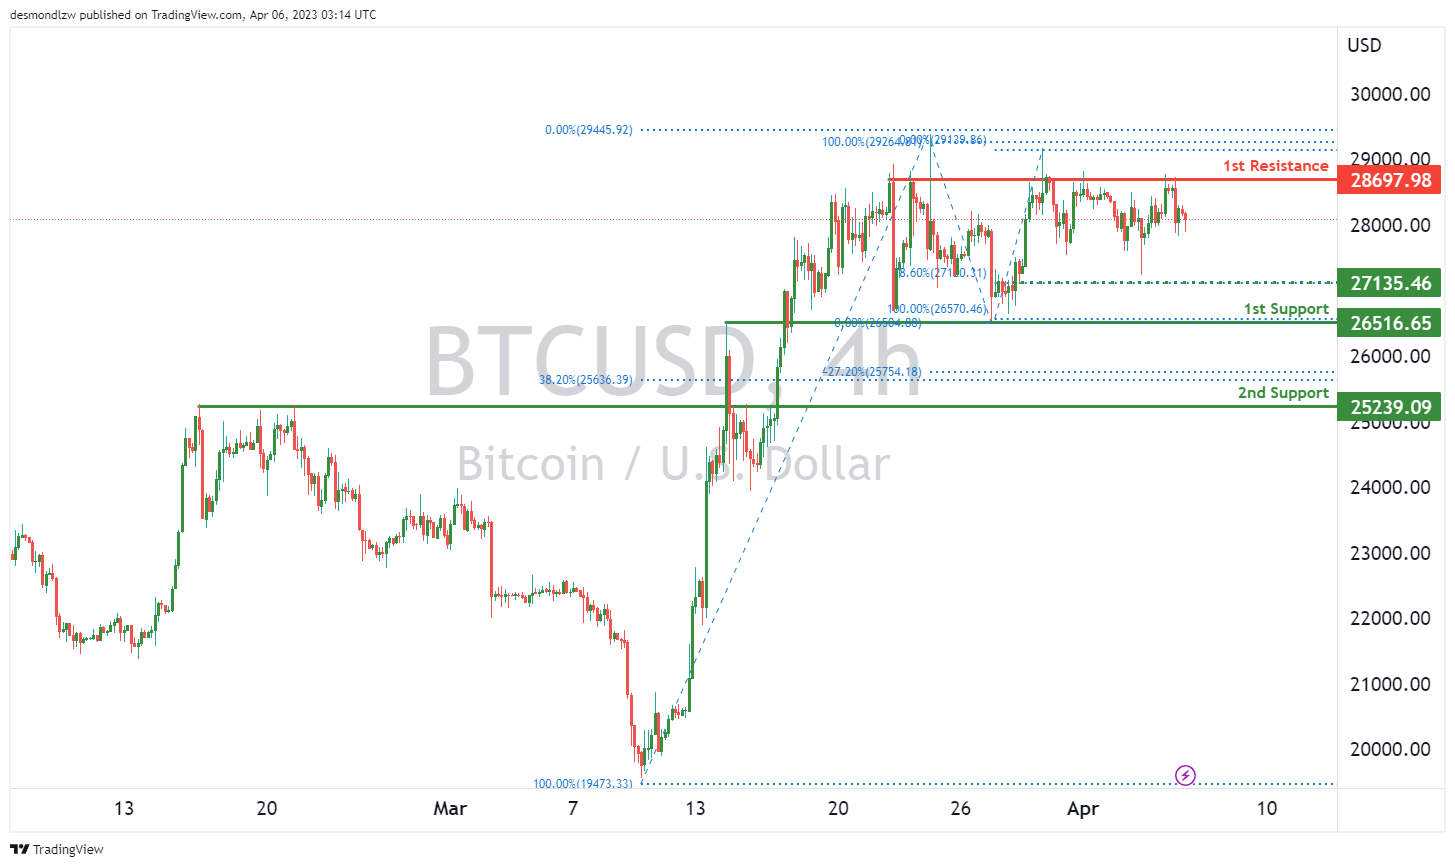
BTC/USD:
BTC/USD chart is currently showing a bearish momentum. The price has potential to continue its bearish movement towards the 1st support level at 26516.65. This level is a good pullback support and could help the price bounce back up. If the price breaks below the 1st support, the next support level to watch out for is the 2nd support at 25239.09 which also coincides with a pullback support.
On the other hand, if the price bounces off the 1st support level, it could potentially rise towards the 1st resistance at 28697.98 which is a multi-swing high resistance level. However, there is an intermediate support level at 27135.46 which is a swing low support. If the price breaks below this intermediate support, it could trigger a strong bearish acceleration towards the 2nd support level.
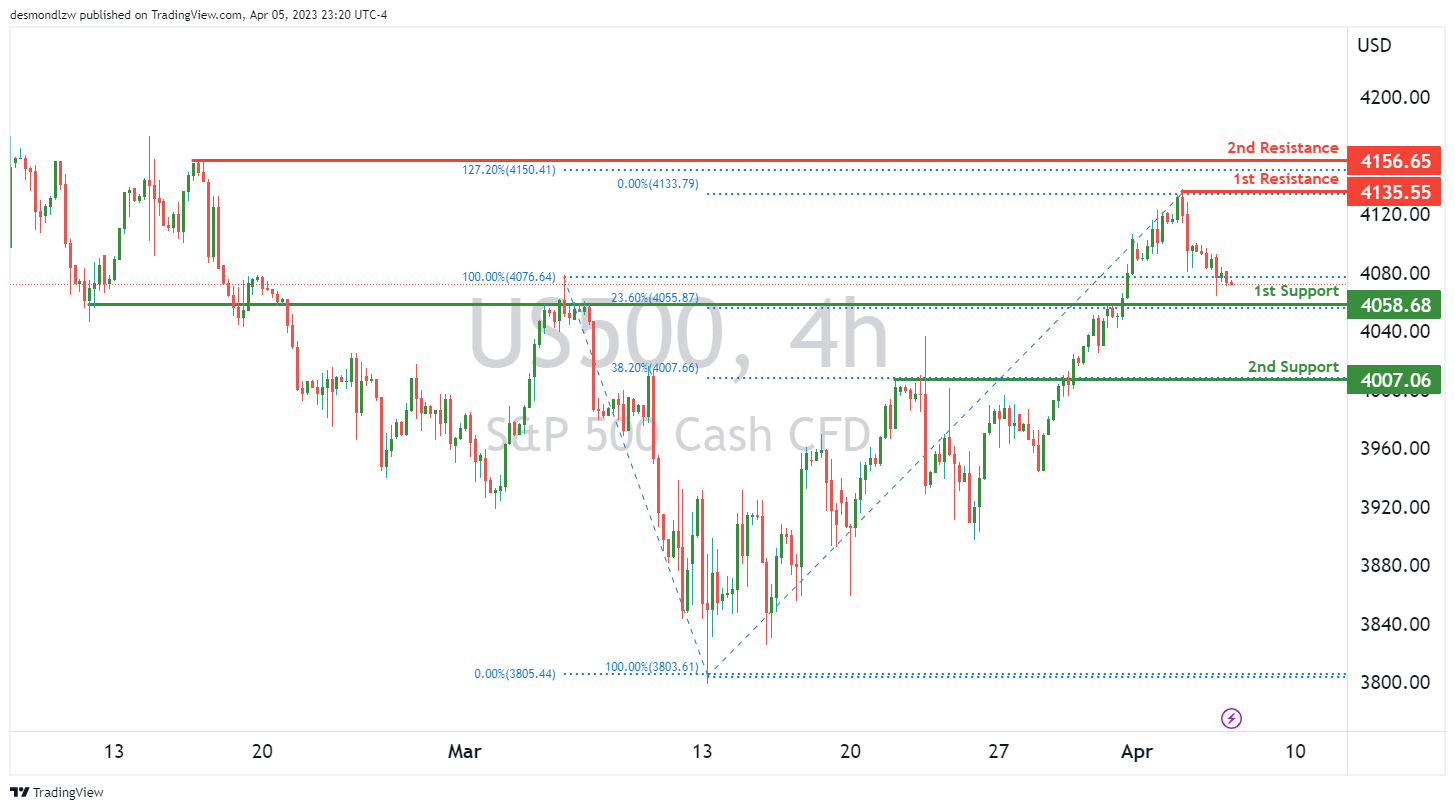
US500
The US500 chart shows a bearish momentum, with potential for a continued drop towards the first support level. The first support level is at 4058.68, and it is a pullback support with a 23.60% Fibonacci retracement. If price were to break this level, it could drop further towards the second support level at 4007.06, which is also a pullback support with a 38.20% Fibonacci retracement.
On the other hand, if price were to bounce from the first support level, it could rise towards the first resistance level at 4135.55, which is a swing high resistance. The second resistance level is at 4156.65, which is also a swing high resistance and coincides with a 127.20% Fibonacci extension.
It is worth noting that the chart is currently showing a bearish momentum, and the descending trend line is suggesting further bearish momentum could be on the cards. If price were to break below the first support level, it could trigger a stronger bearish acceleration towards the second support level. However, if price were to break above the first resistance level, it could trigger a stronger bullish acceleration towards the second resistance level.
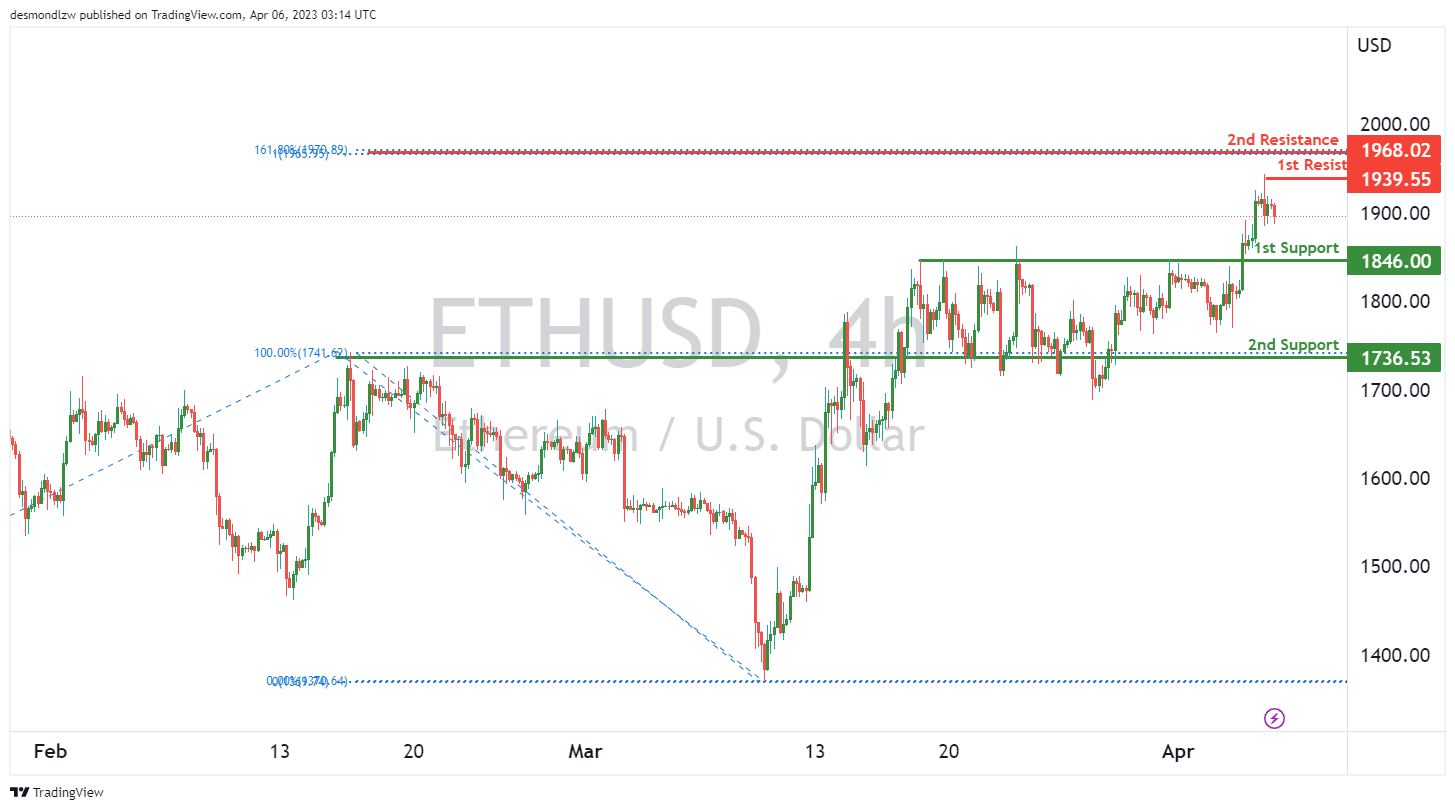
ETH/USD:
The overall momentum of ETH/USD chart is bearish, which suggests that the price may continue to decrease. The first support level is at 1846.00, which is a pullback support and is located at the 23.60% Fibonacci retracement level. This support level is significant as it could potentially provide a bounce to the price.
The second support level is at 1736.53, which is another pullback support level. This level is also important as it has previously acted as a support level in the past.
The first resistance level is at 1939.55, which is a swing high resistance level. This resistance level is significant as it has previously acted as a barrier to prevent the price from moving higher.
The second resistance level is at 1968.02, which is a swing high resistance level and is located at the 161.80% Fibonacci extension level. This resistance level is also significant as it could potentially act as a strong barrier to prevent the price from moving higher.
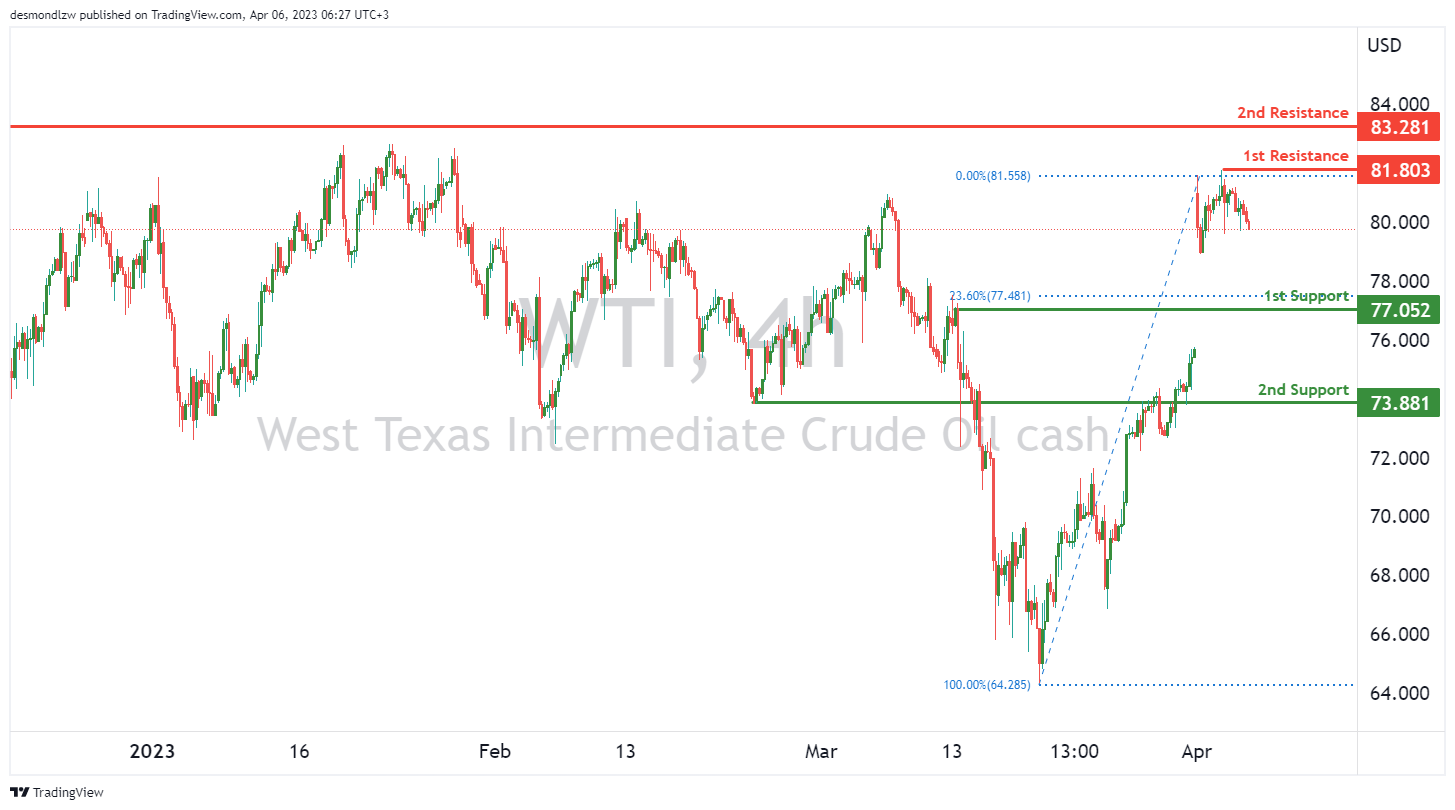
WTI/USD:
WTI crude oil has been experiencing bearish momentum recently, with the price potentially making a bearish continuation towards the first support level. Currently, the overall momentum of the chart is bearish.
The first support level to watch is at 77.05, which is a pullback support level and also the 23.60% Fibonacci retracement level. This is a key level as a break below it could potentially signal a continuation of the bearish momentum. The second support level to watch is at 73.88, which is an overlap support level.
On the resistance side, the first level to watch is at 81.80, which is a swing high resistance level. If the price manages to break above this level, it could potentially signal a reversal of the bearish momentum. The second resistance level to watch is at 83.28, which is another swing high resistance level.
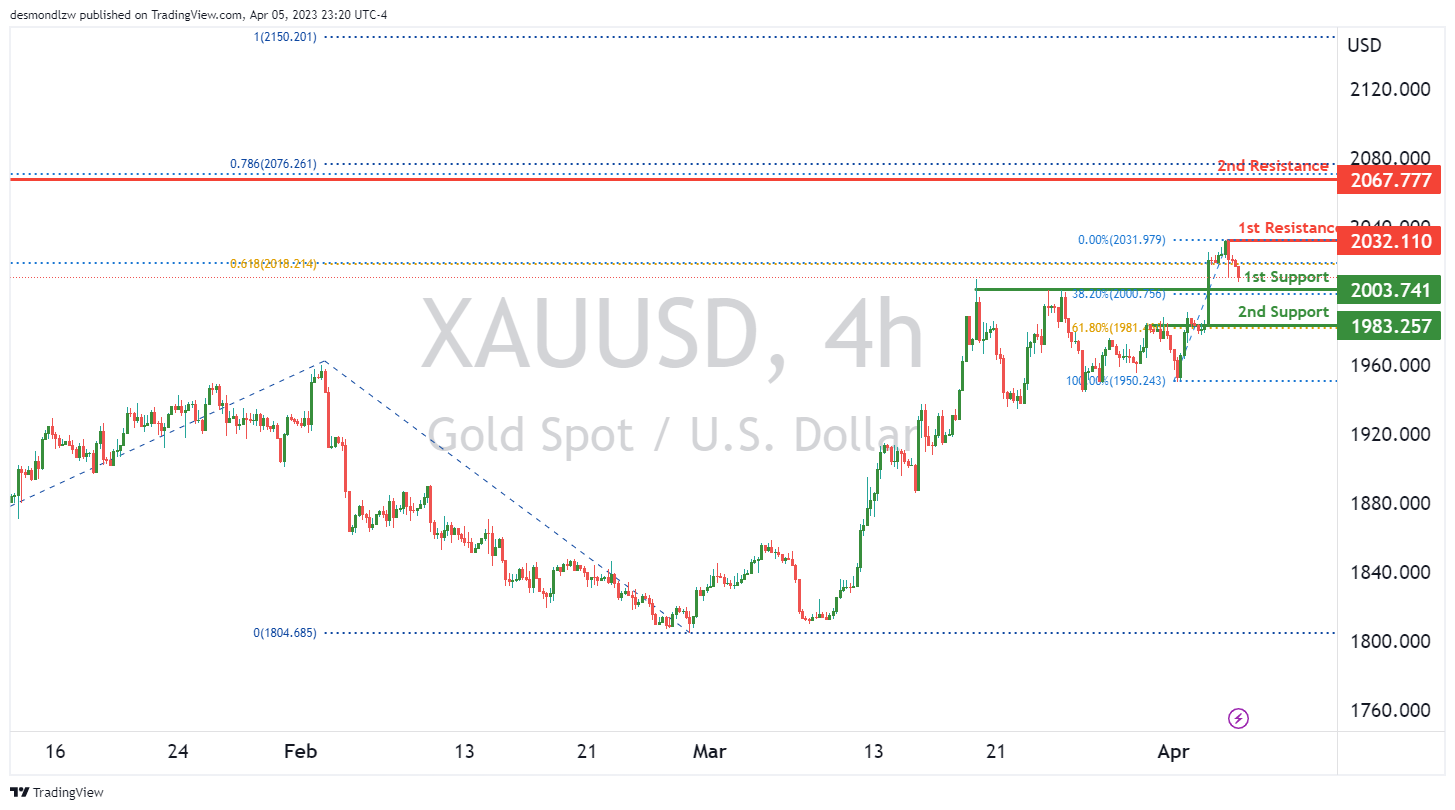
XAU/USD (GOLD):
Gold prices have been on a bearish trend recently, with the overall momentum of the XAU/USD chart pointing in a downward direction. This suggests that prices could potentially continue to decline in the near future.
If the bearish trend continues, the price could potentially make a move towards the first support level at $2003.74. This level is a good support zone, as it aligns with the 38.20% Fibonacci retracement level.
If the price breaks below the first support level, it could potentially continue to drop towards the second support level at $1983.25. This level is also a good support zone, as it aligns with the 61.80% Fibonacci retracement level.
On the other hand, if there is a bullish reversal, the price could potentially move towards the first resistance level at $2032.11. This level is a good resistance zone, as it aligns with a previous swing high.
If the bullish momentum continues, the price could potentially move towards the second resistance level at $2067.77, which is also a good resistance zone as it aligns with a previous swing high.


