
DXY:
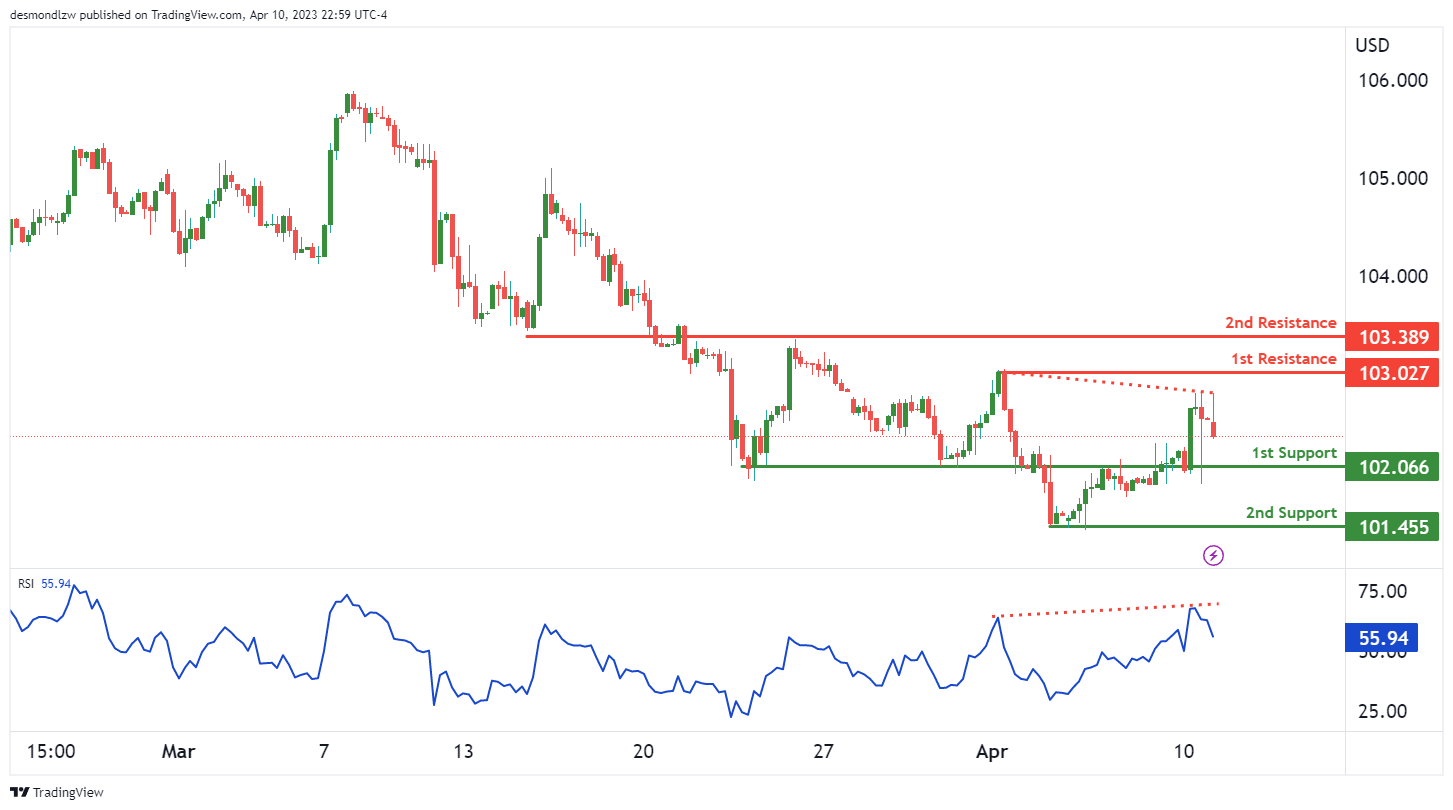
Looking at the DXY chart, the overall momentum is currently bearish. There is potential for a bearish continuation towards the 1st support level at 102.06, which is a pullback support level. If the price were to break below this level, the next support level it could drop to is the 2nd support level at 101.45, which is also a pullback support level.
On the other hand, the 1st resistance level is at 103.02, which is a swing high resistance level. If the price were to rise, the next resistance level it could face is the 2nd resistance level at 103.38, which is an overlap resistance level.
It’s worth noting that the RSI is displaying bearish divergence versus price, suggesting that a reversal might occur soon.
EUR/USD:
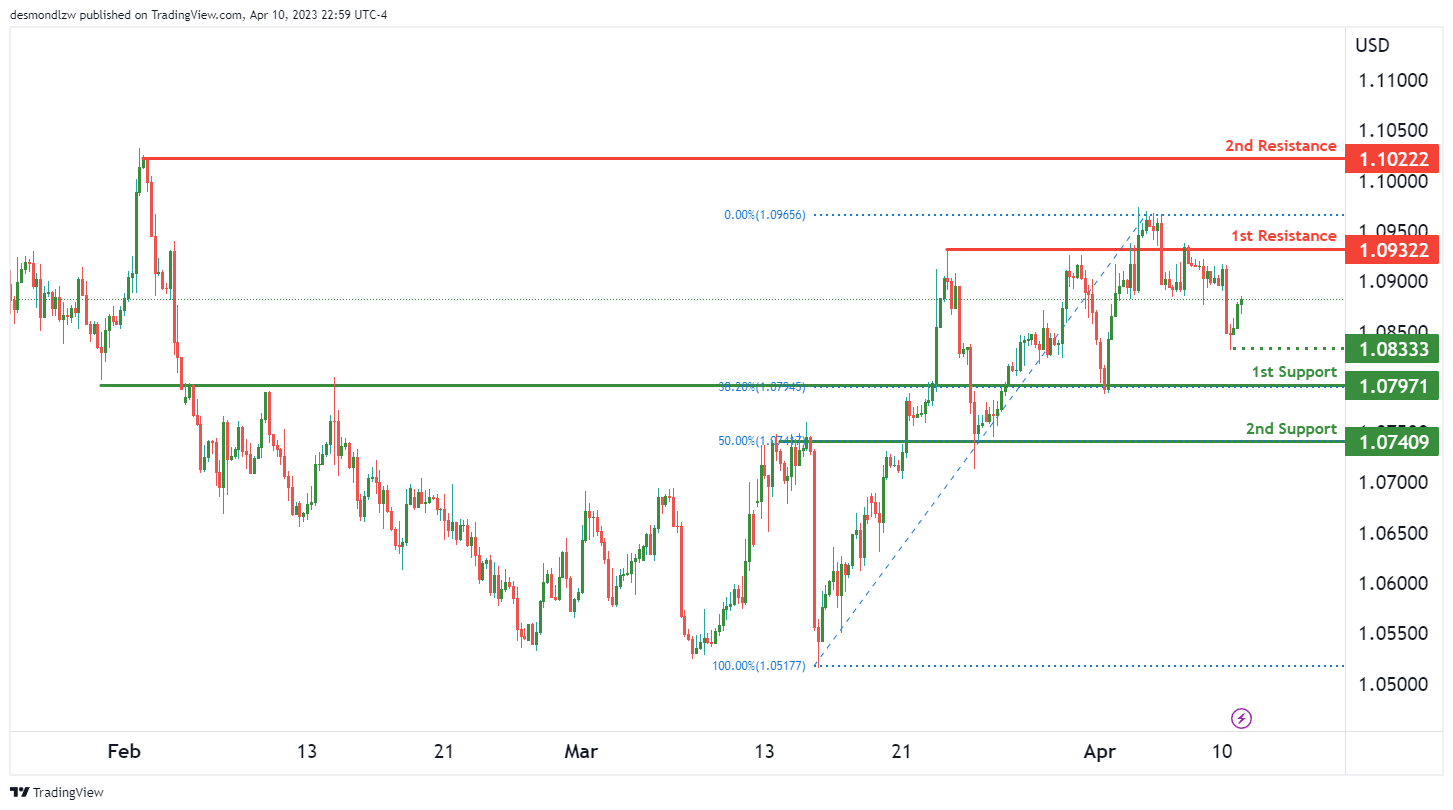
The EUR/USD chart is currently showing bullish momentum. Price could potentially make a bullish continuation towards the 1st resistance. The 1st support is at 1.0797, which is an overlap support level and also coincides with the 38.20% Fibonacci retracement level. The 2nd support level is at 1.0740, which is another overlap support level and also coincides with the 50% Fibonacci retracement level.
On the other hand, the 1st resistance level is at 1.0932, which is an overlap resistance level. The 2nd resistance level is at 1.1022, which is a swing high resistance level.
In addition to these levels, there is an intermediate support level at 1.0833, which is a swing low support level.
GBP/USD:
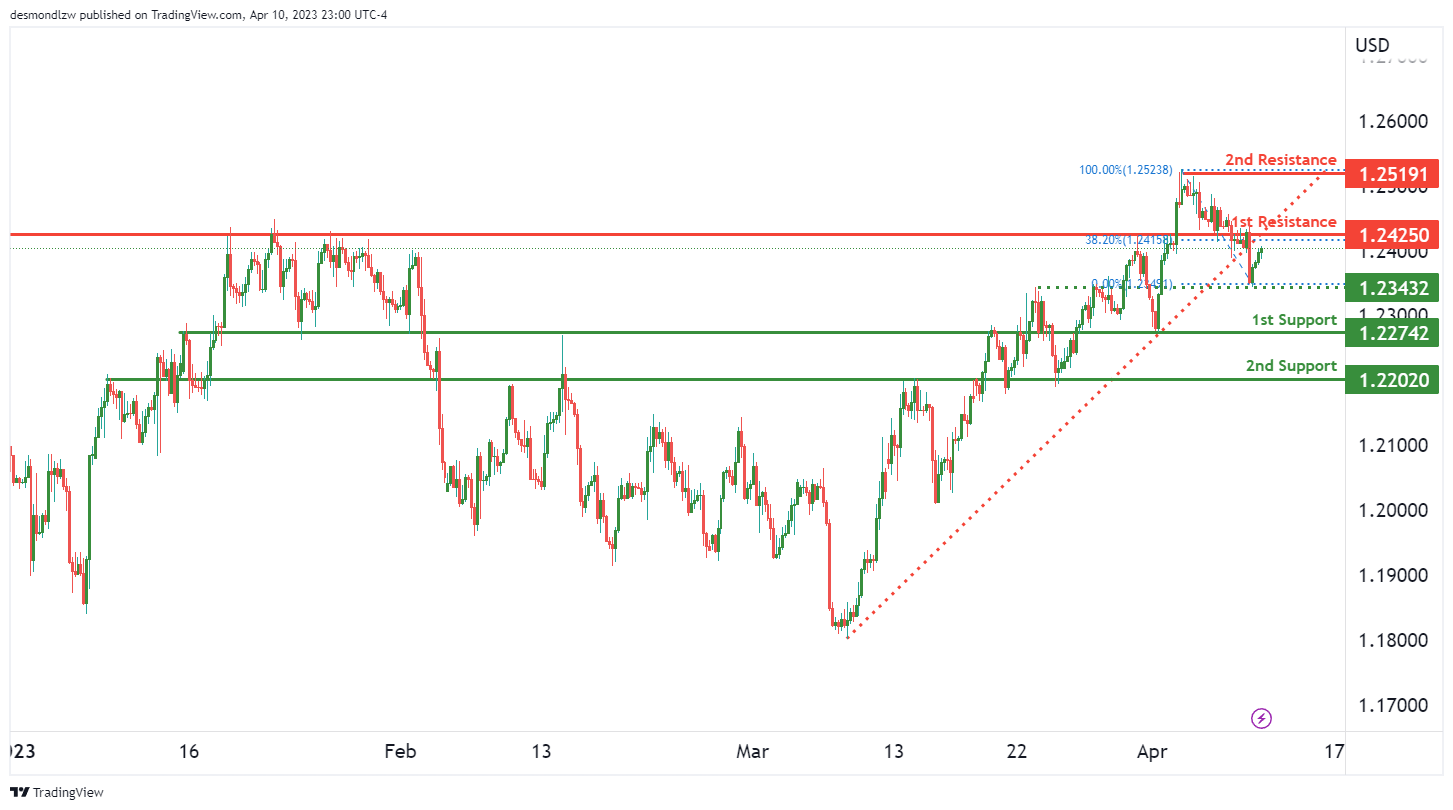
The overall momentum of the GBP/USD chart is currently bullish, despite breaking below an ascending support line, which has triggered a potential bearish move. Factors contributing to the bullish momentum include a potential bullish continuation towards the 1st resistance level.
At the moment, the 1st support level for GBP/USD is at 1.2274. This is a strong overlap support level and is followed by a 2nd support level at 1.2202, which is also an overlap support level. If the price were to bounce off either of these support levels, it could potentially rise to the 1st resistance level at 1.2425. This resistance level is also an overlap resistance level, and a break above it could trigger a bullish continuation towards the 2nd resistance level at 1.2519.
It’s worth noting that there is also an intermediate support level at 1.2343, which is also an overlap support level. This could be a potential area for a bounce if the price were to drop further.
USD/CHF:
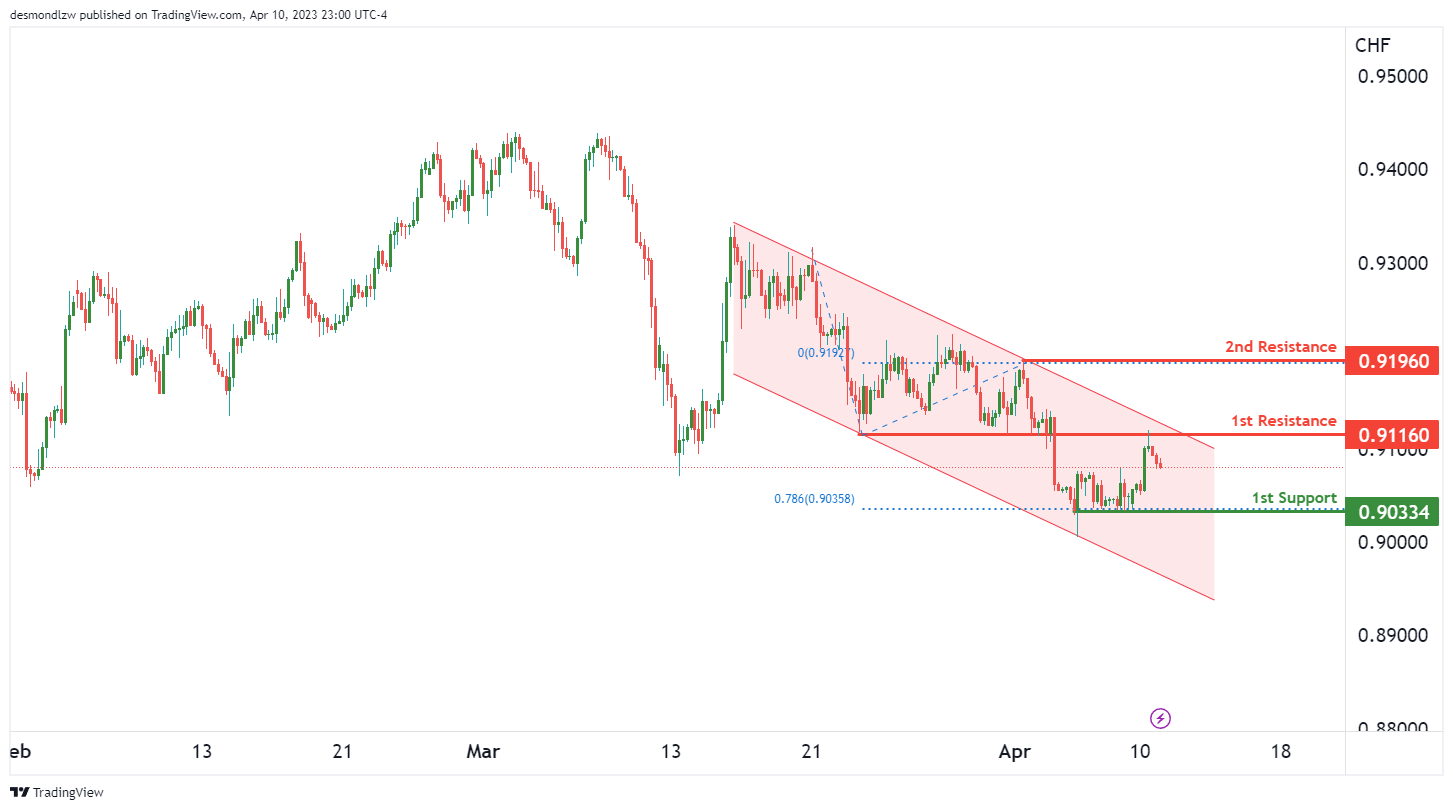
The USD/CHF chart is currently displaying bearish momentum, with the price potentially continuing its downtrend towards the first support at 0.9033. This level is a pullback support and has previously held as a support level in the past.
At the moment, there isn’t any particular bullish factor contributing to the momentum, making the chart outlook bearish. Additionally, price is not only below the Ichimoku cloud, indicating bearish momentum, but it has also broken below an ascending support line, which could potentially trigger further bearish momentum.
Looking at the resistance levels, the first resistance at 0.9116 is a strong overlap resistance. If price were to break above this level, it could potentially rise towards the second resistance at 0.9196, which is a swing high resistance. However, the overall bearish momentum suggests that a bearish continuation towards the first support is more likely.
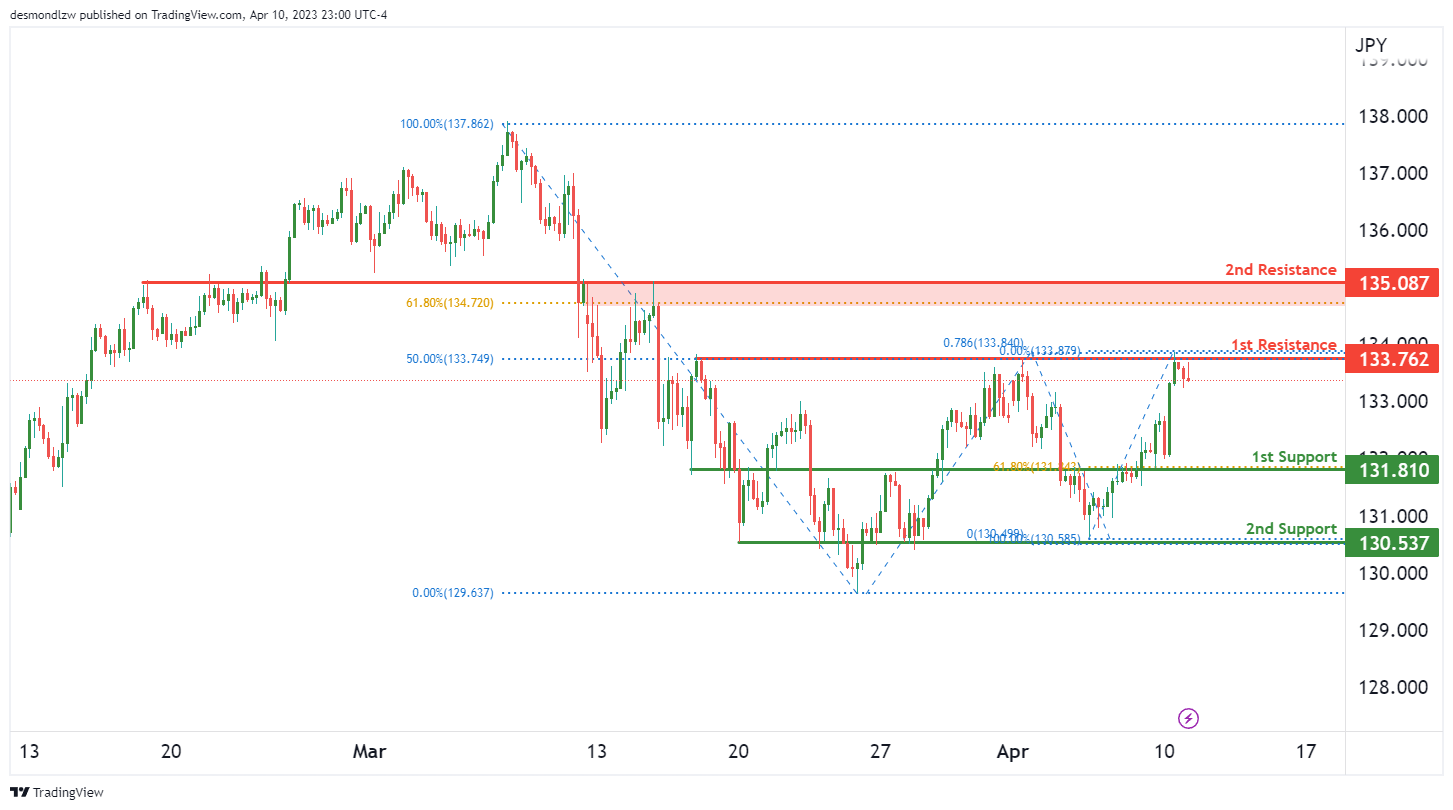
USD/JPY:
The USD/JPY chart is currently showing a bearish overall momentum, suggesting that we may see a drop in price in the near future. If we look at the chart, there is a potential for a bearish reaction off the 1st resistance level at 133.76, which is a strong pullback resistance level, coinciding with the 78.60% Fibonacci projection. If price drops from this resistance level, it could potentially fall towards the 1st support at 131.81. This level is an overlap support level and has the 61.80% Fibonacci retracement lining up with it, making it a good level for price to potentially bounce off of.
If price were to break below the 1st support, it could fall towards the 2nd support at 130.53, which is also an overlap support level. However, if price were to break above the 1st resistance, it could potentially rise towards the 2nd resistance at 134.08, which is an overlap resistance level and has the 61.80% Fibonacci retracement lining up with it.
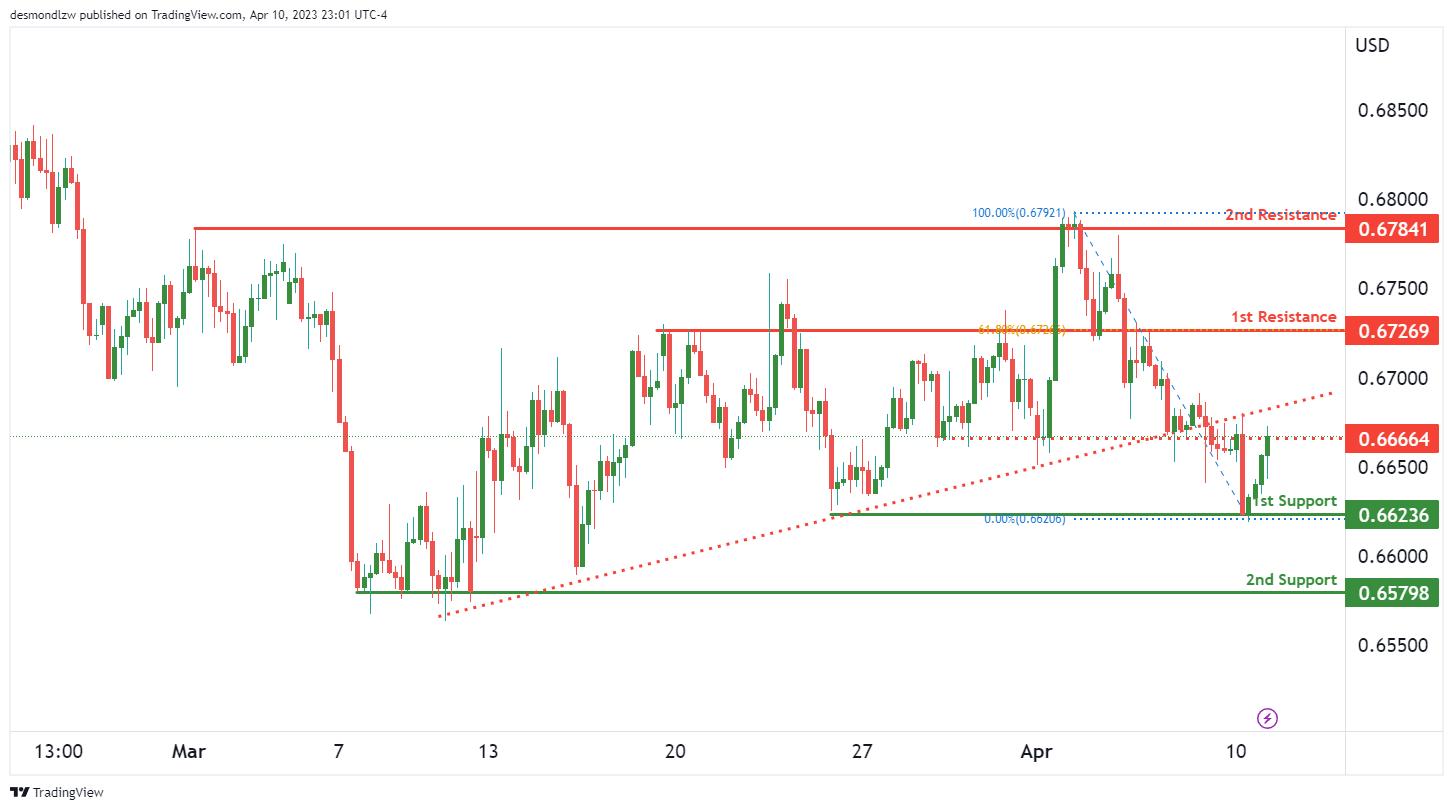
AUD/USD:
The overall momentum of the AUD/USD chart is currently bearish, with price breaking below an ascending support line and triggering a potential bearish move. This suggests that there may be further downside potential for the pair.
Looking at potential price movements, AUD/USD could potentially make a bearish reaction off the first resistance level and drop to the first support level. The first support is located at 0.6623 and is a swing low support. Should price break this level, the next support is at 0.6579, a multi-swing low support.
On the other hand, the first resistance level is at 0.6726, an overlap resistance level. If price were to bounce off this level, it could potentially drop to the first support at 0.6623. The second resistance level is at 0.6784, a multi-swing high resistance level.
There is also an intermediate resistance at 0.6666, an overlap resistance level, which is located between the current price and the first resistance level.
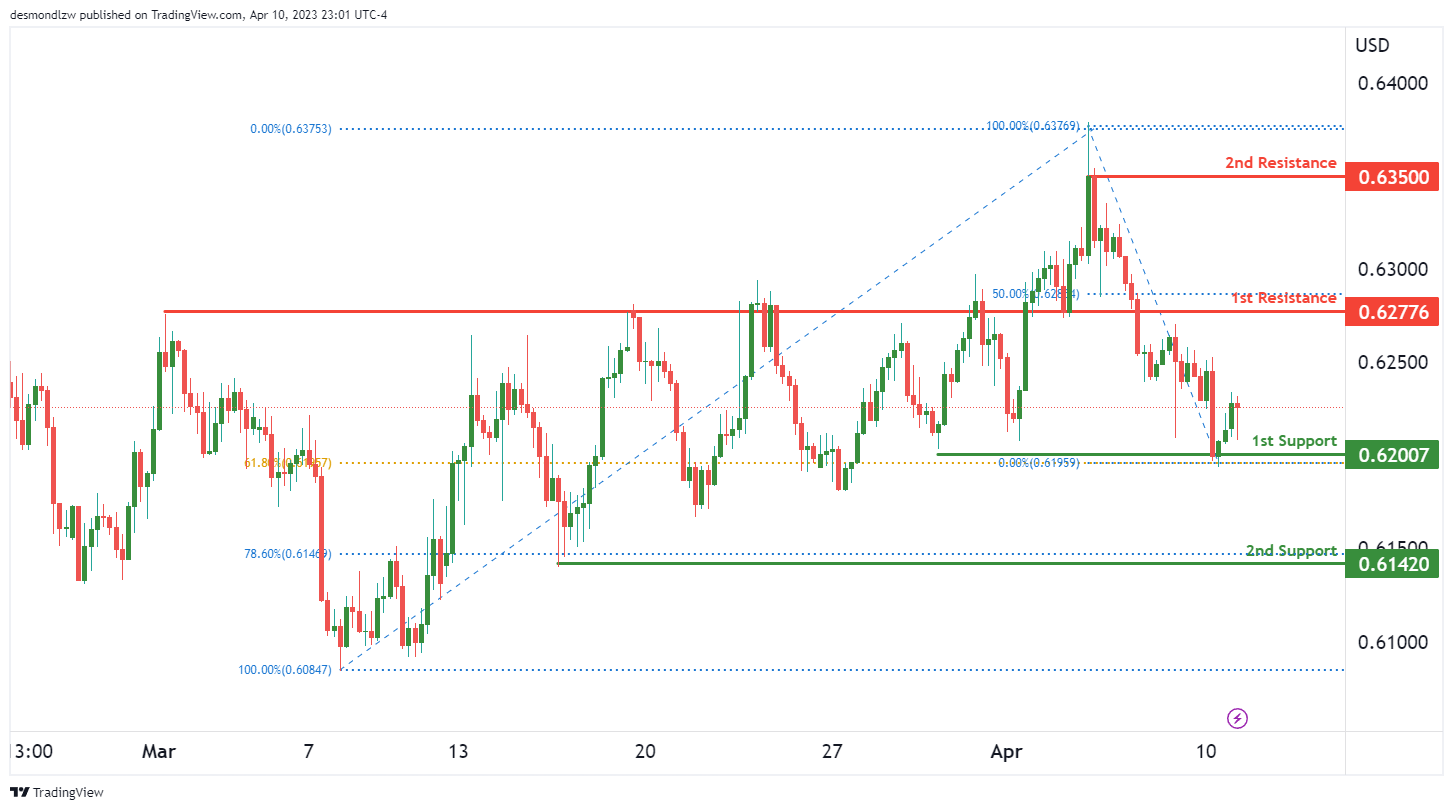
NZD/USD:
The NZD/USD chart is currently showing bullish momentum, with potential for a continuation towards the 1st resistance level. The 1st support level is at 0.6200, which is a pullback support and coincides with a 61.80% Fibonacci retracement. A bounce from this support level could lead to a rise towards the 1st resistance at 0.6277, which is a strong overlap resistance and has a 50% Fibonacci retracement lining up with it.
If the price manages to break through the 1st resistance level, it could potentially reach the 2nd resistance level at 0.6350, which is a swing high resistance. On the other hand, if the price were to fall below the 1st support level, the next support level to look out for is the 2nd support at 0.6142, which is a swing low support and coincides with a 78.60% Fibonacci retracement.
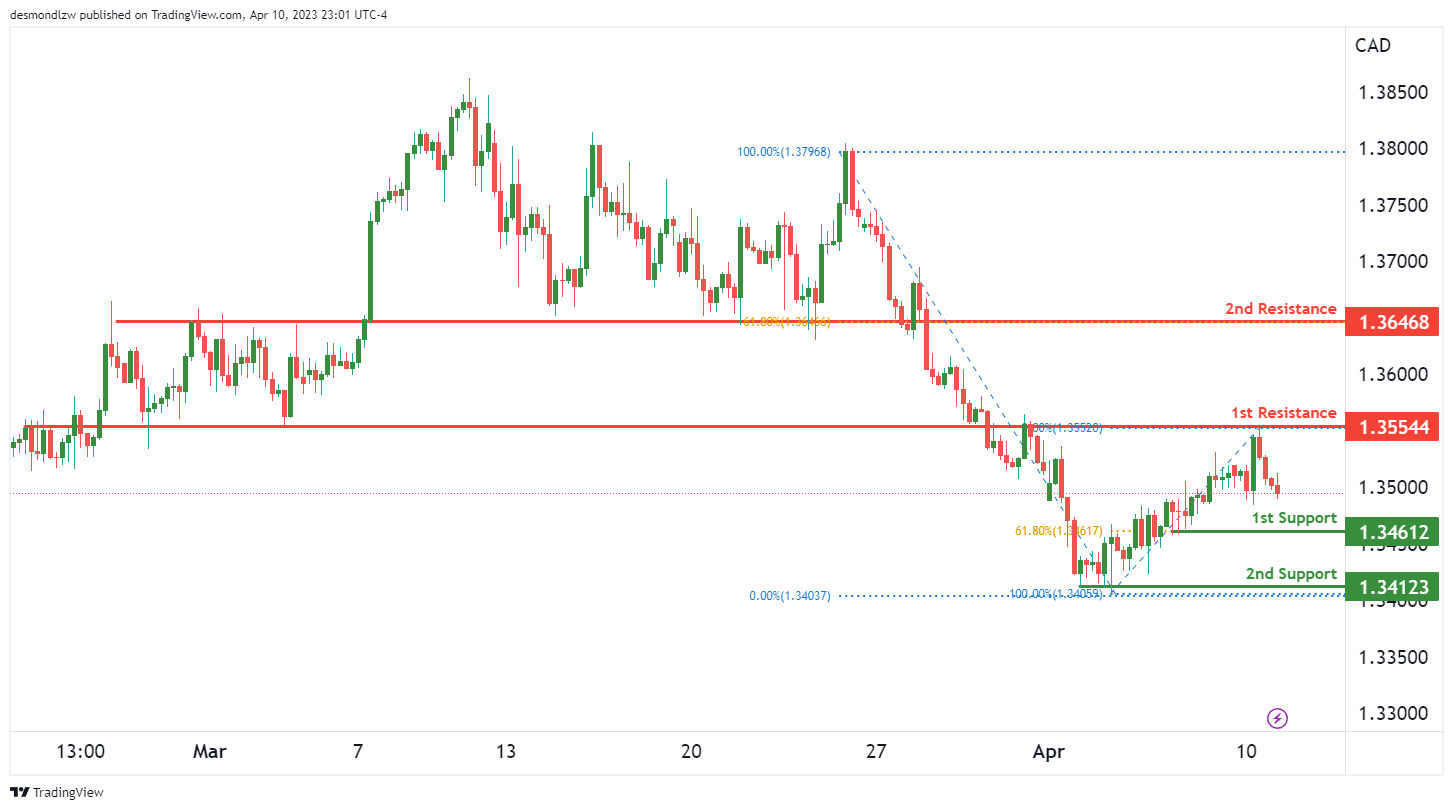
USD/CAD:
Overall, the USD/CAD chart appears to have a bearish momentum, with potential for a bearish continuation towards the 1st support at 1.3461. This support level is a swing low support and also lines up with a 61.80% Fibonacci retracement, making it a strong level of support. The 2nd support level at 1.3412 is a multi-swing low support, which adds to its significance as a potential area where price could bounce.
On the other hand, there is a 1st resistance level at 1.3554, which is an overlap resistance. If price were to break above this level, it could suggest a potential bullish reversal. However, the 2nd resistance level at 1.3646 is a pullback resistance that lines up with a 61.80% Fibonacci retracement, making it a strong level of resistance where price could potentially reverse.
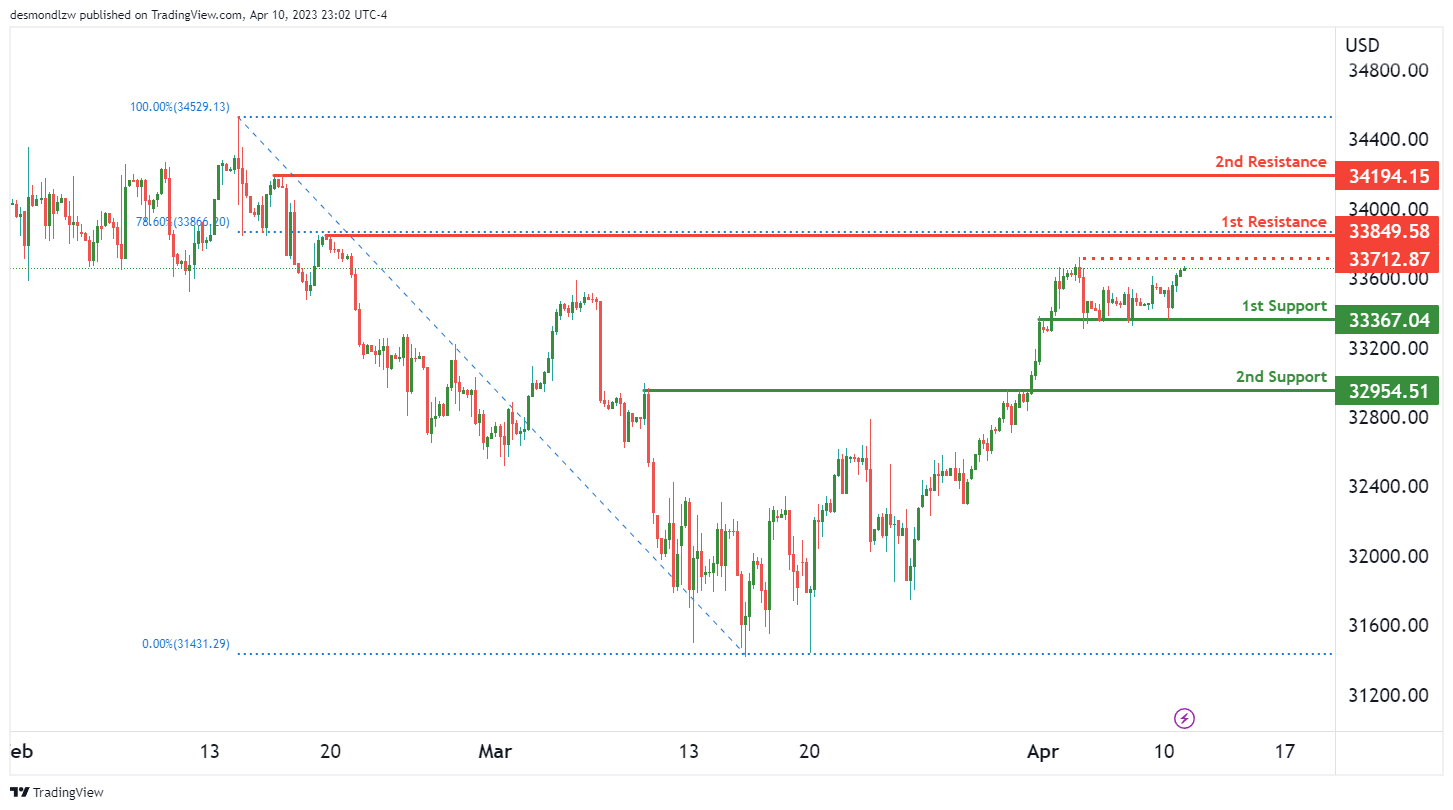
DJ30:
The overall momentum of the DJ30 chart is bullish, with potential for a continuation towards the 1st resistance level. This momentum is supported by the fact that price is above the Ichimoku cloud and has broken above an ascending trend line, both of which are bullish indicators.
The 1st support level is at 33,367.04, and it is a multi-swing low support level. This makes it a strong level of support. If price were to drop and bounce off this support, it could potentially rise towards the 1st resistance level.
The 2nd support level is at 32,954.51, and it is a pullback support level. This level has been tested multiple times in the past, making it a strong level of support. If price were to drop and bounce off this support, it could potentially rise towards the 1st resistance level.
The 1st resistance level is at 33,849.58, and it is a pullback resistance level. This level lines up with a 78.60% Fibonacci retracement, which makes it a strong level of resistance. If price were to break above this resistance level, it could potentially rise towards the 2nd resistance level.
The 2nd resistance level is at 34,194.15, and it is a swing high resistance level. This level has been tested multiple times in the past, making it a strong level of resistance. If price were to break above this resistance level, it could potentially continue to rise further.
There is also an intermediate resistance level at 33,712.87, which is a swing high resistance level. If price were to break above this level, it could trigger a stronger bullish acceleration towards the 1st resistance level.
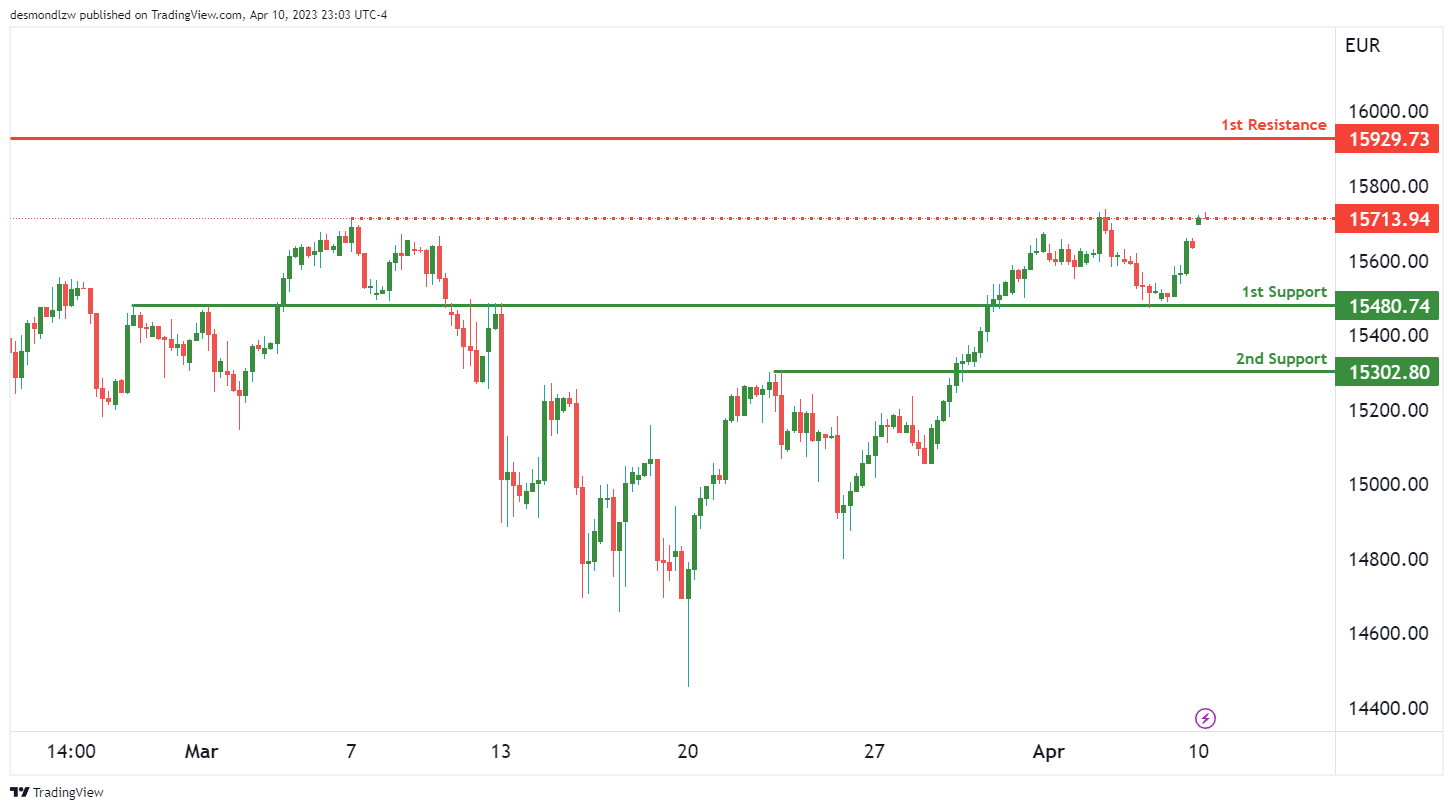
GER30:
The GER30 chart shows a bullish momentum, and there is a potential for a bullish continuation towards the first resistance level. The first support level is at 15480.74, which is an overlap support level. If the price bounces off this support level, it could potentially rise towards the first resistance level of 15929.73. The second support level is at 15302.80, which is a pullback support level.
However, it’s worth noting that there is an intermediate resistance level at 15713.94 between the current price and the first resistance level. If the price were to break through this intermediate resistance level, it could trigger a stronger bullish acceleration towards the first resistance level.
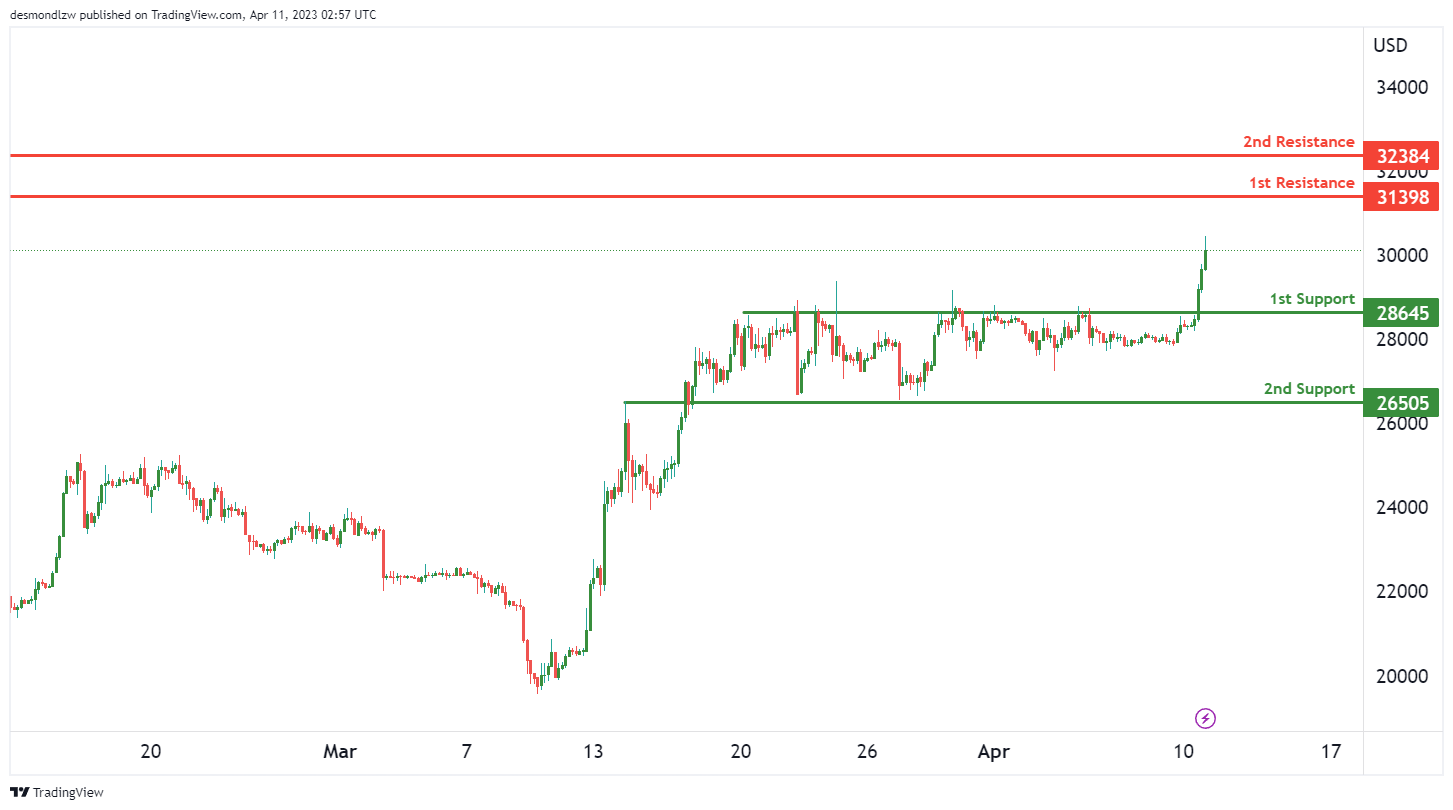
BTC/USD:
Bitcoin (BTC/USD) is currently displaying bullish momentum, with the potential for a continuation towards its first resistance level.
The first support level is at $28,645, which is a pullback support level. The second support level is at $26,505, which is an overlap support level.
On the other hand, the first resistance level is at $31,398, which is a swing high resistance level. If BTC/USD manages to break through this level, the second resistance level at $32,384 could potentially come into play.
It’s worth noting that BTC/USD has seen a strong bullish momentum in recent times, making the potential for a continuation towards the first resistance level higher. However, it’s important to keep an eye on the support levels as well, in case of a potential pullback.
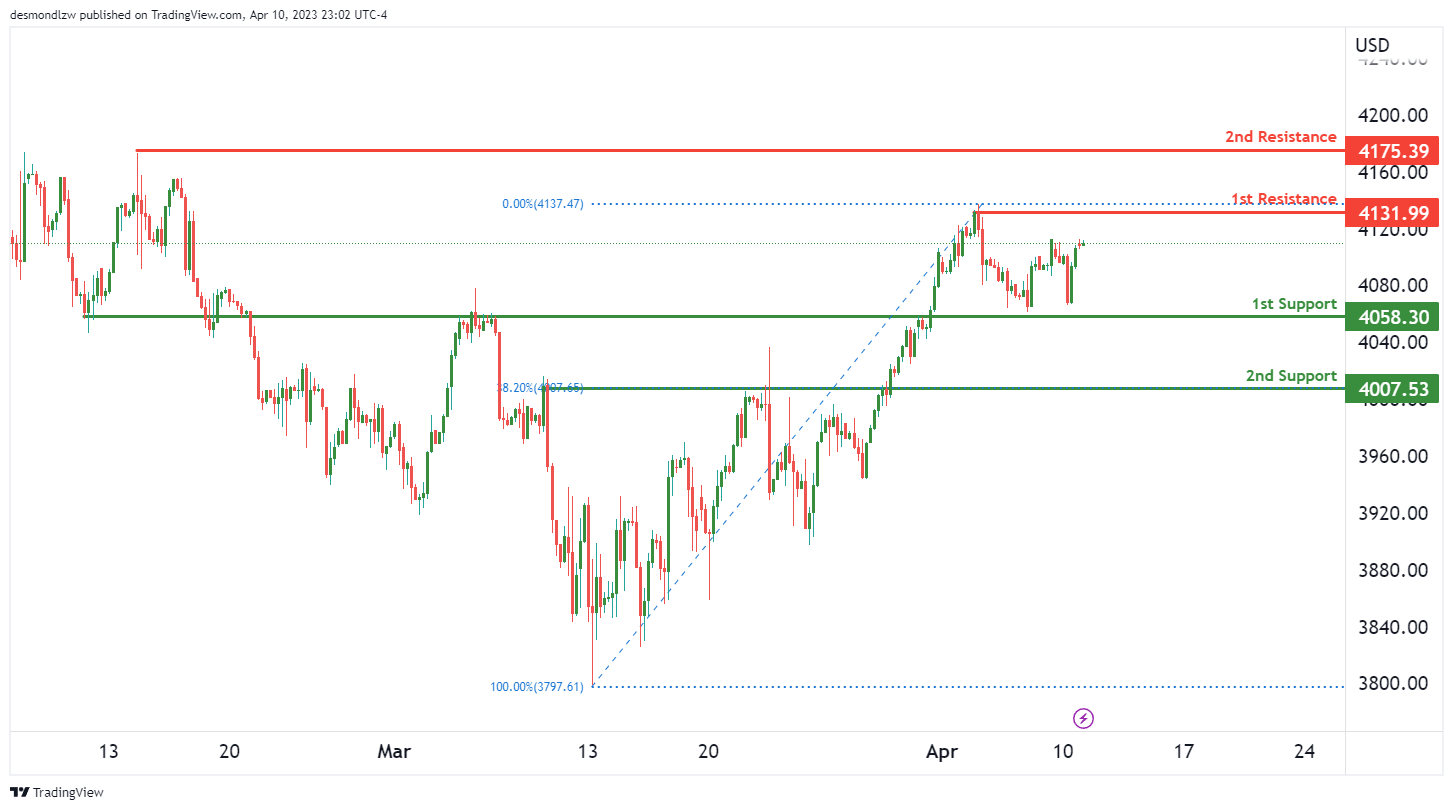
US500
The US500 chart is showing strong bullish momentum, with potential for a bullish continuation towards the 1st resistance level. This bullish sentiment is reflected in the ascending support line and Ichimoku cloud support. Although the chart does not present a clear trend direction, there are several factors that point towards a bullish scenario.
The 1st support level at 4058.30 is a good level to watch for a bounce back up. It is an overlap support, which means it has been tested several times in the past and has proven to be a strong support level. If price were to bounce from this level, it could rise to the 1st resistance at 4131.99. This resistance level is a swing high resistance, which indicates that it has been tested several times and has proven to be a strong level of resistance. Additionally, this resistance level lines up with a 38.2% Fibonacci retracement.
There is also an intermediate support at 4007.53 which is another good level to watch for a bounce. It is a pullback support, which means it lines up with a previous pullback level. If price were to break this intermediate support, it could drop down to the 2nd support at 3905.07. This level is an overlap support and has been tested several times in the past.
On the other hand, if price were to break the 1st resistance, it could potentially rise towards the 2nd resistance level at 4175.39. This is also a swing high resistance and lines up with a 50% Fibonacci projection, which suggests that it could be a significant level to watch for a breakout.
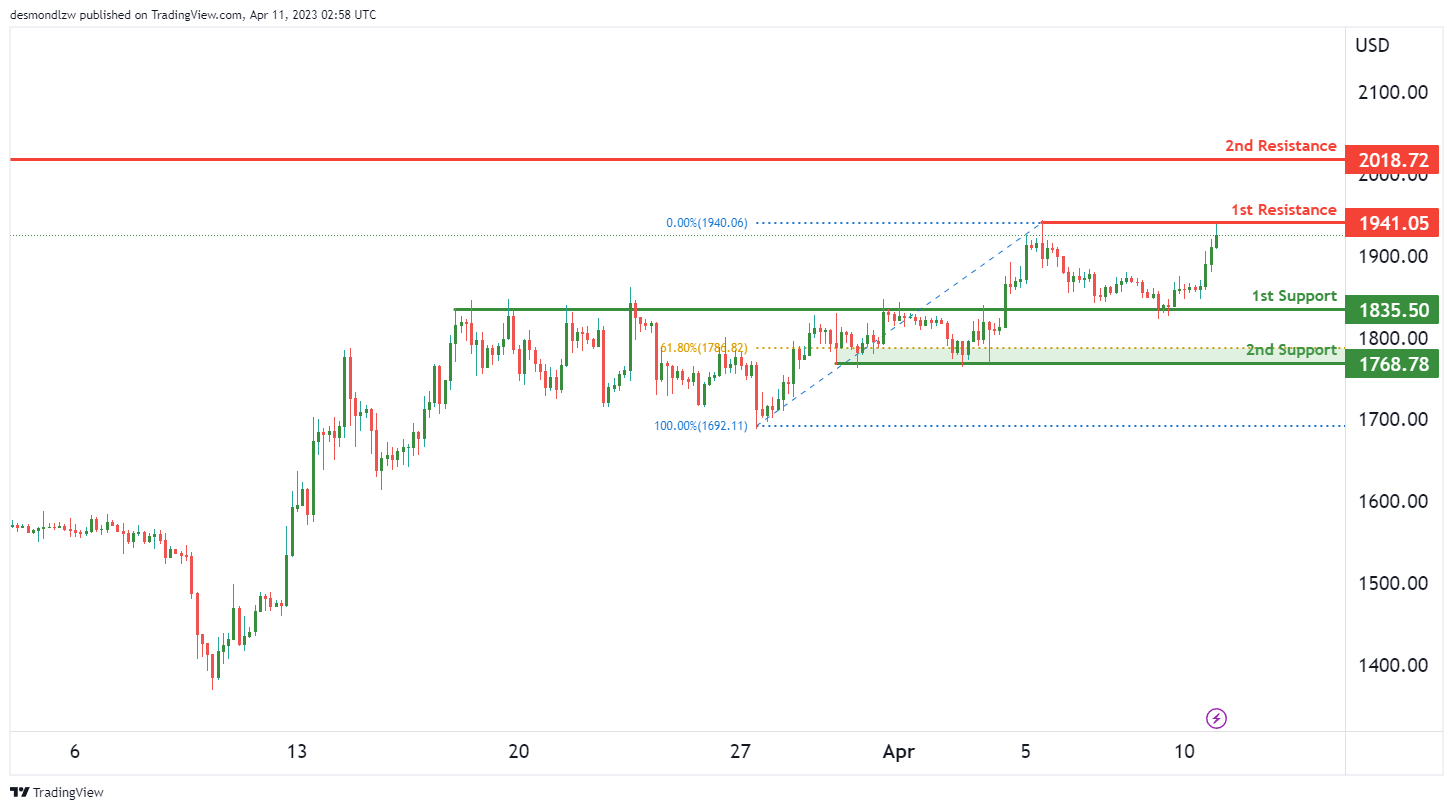
ETH/USD:
The Ethereum/USD chart is showing a bearish momentum overall. The price could potentially make a bearish reaction off 1st resistance and drop to the 1st support level. The 1st support is at 1835.50, which is an overlap support. The 2nd support at 1768.78 is also an overlap support and a 61.80% Fibonacci retracement level, which makes it a strong support level.
On the other hand, the 1st resistance is at 1941.05, which is a multi-swing high resistance level. If the price manages to break above this level, the 2nd resistance level at 2018.72, a swing high resistance level, could potentially be reached.
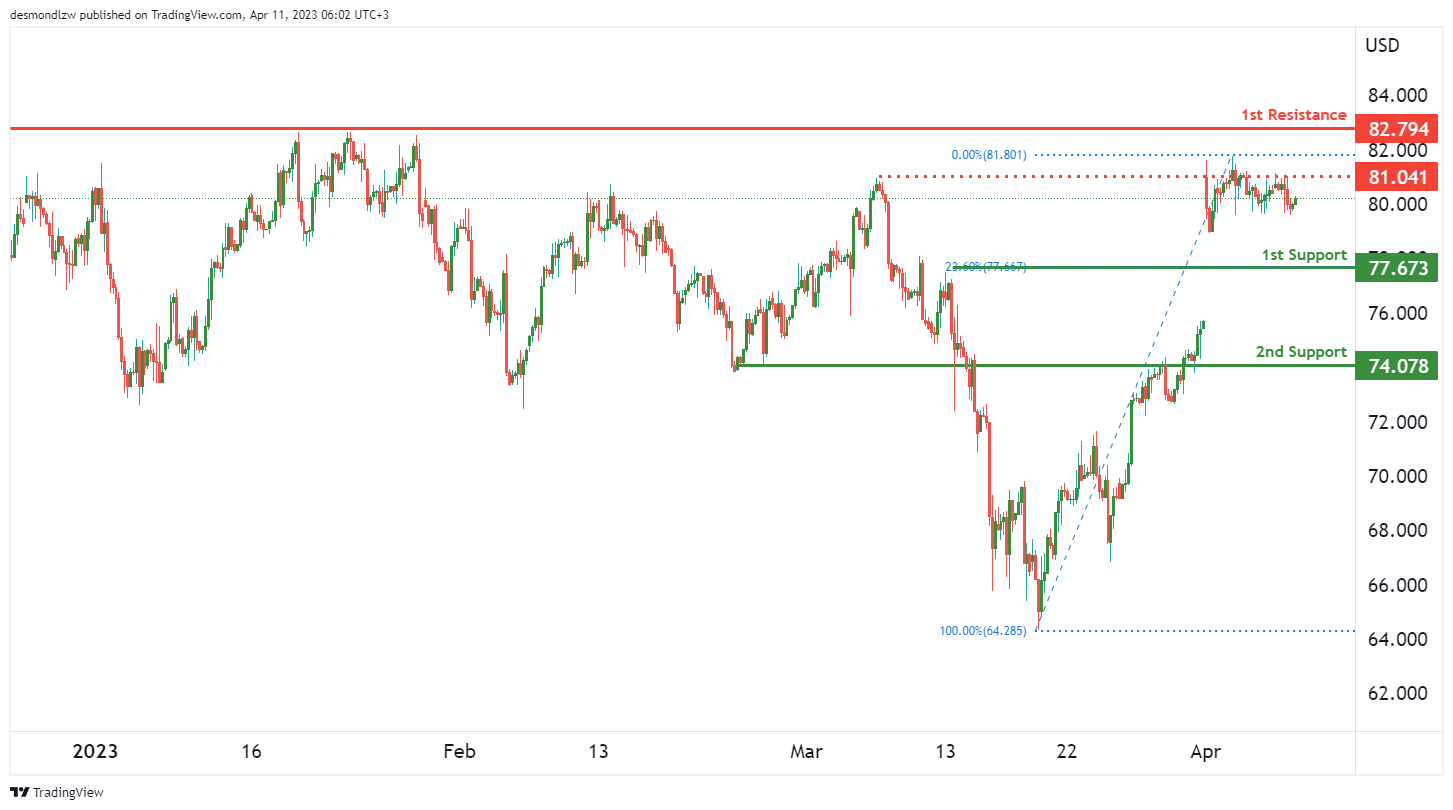
WTI/USD:
Crude oil prices have been in a bearish trend lately, and the momentum of the chart appears to be bearish. If the bearish move continues, we could potentially see the price of WTI crude oil drop towards the first support level at 77.67. This level is a pullback support and is also at the 23.60% Fibonacci retracement level, which adds to its significance as a support level.
If the price continues to drop, the next support level at 74.07 is also a good level to watch out for. This level is an overlap support, meaning it has held as a support level in the past, making it a good area for buyers to enter the market.
On the other hand, if the price of WTI crude oil starts to rise, it could potentially move towards the first resistance level at 82.79. This level is a multi-swing high resistance, which means it has acted as a barrier to further price increases on multiple occasions in the past.
If the bullish momentum continues, the intermediate resistance level at 81.04 is also a good level to watch out for, as it has held as a swing high resistance in the past.
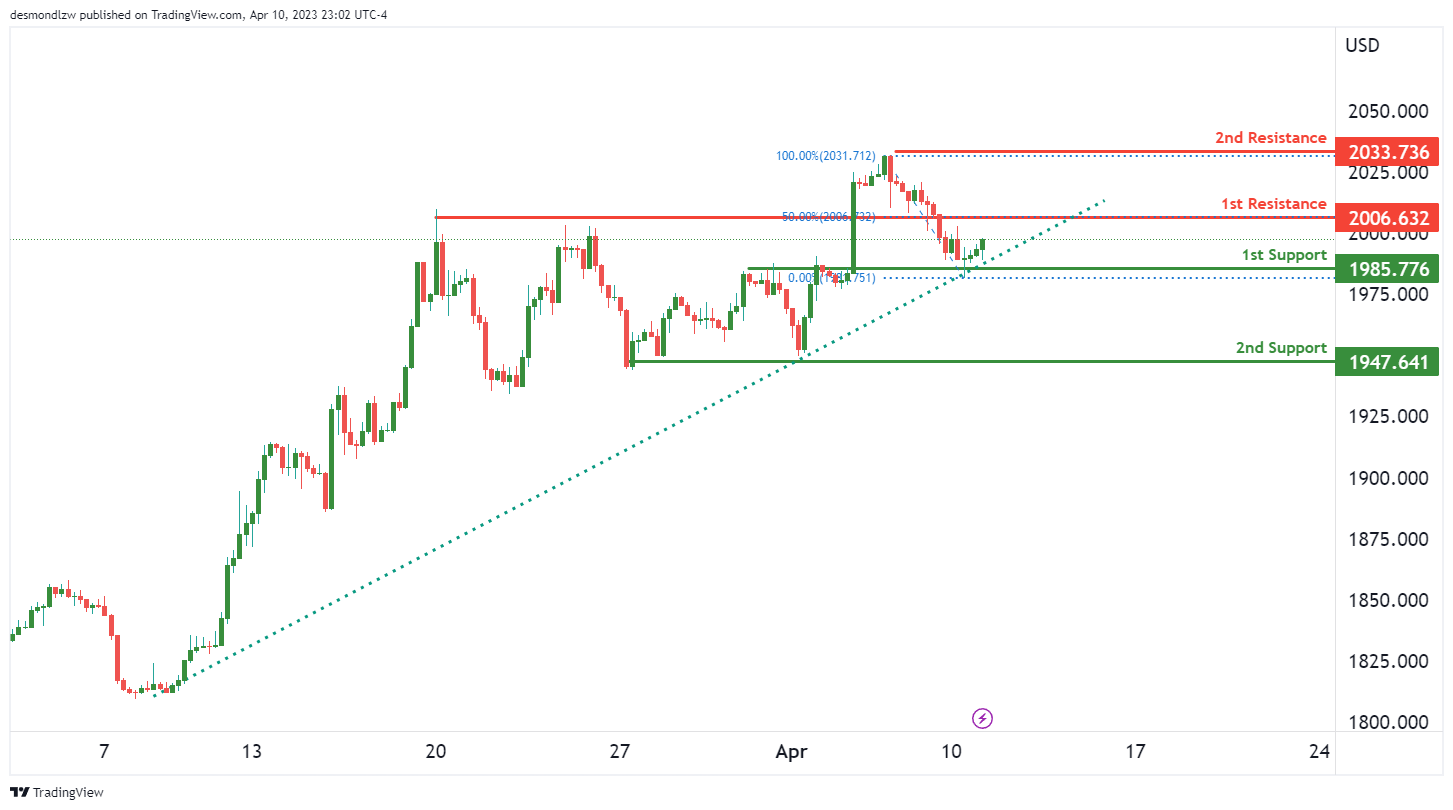
XAU/USD (GOLD):
Gold (XAU/USD) has been showing bullish momentum and has been in an uptrend for some time now. The overall momentum of the chart is bullish, with the price currently above a major ascending trend line. This suggests that further bullish momentum is on the cards.
In terms of potential price action, Gold could potentially make a bullish continuation towards the first resistance level at 2006.63. This is a good resistance level as it is an overlap resistance. If the price manages to break above this level, then the next resistance level to watch out for is at 2033.73, which is a swing high resistance.
On the downside, there are two good support levels to keep an eye on. The first support level is at 1985.77, which is an overlap support level and also coincides with the 50% Fibonacci retracement level. The second support level is at 1947.64, which is a multi-swing low support level.


