
Bears couldn’t pull the market further down last week, and after touching a low of $89.15 on 9 April, LTC started to correct upwards against the US Dollar, touching a high of $96.85 on 11 April.
There is a tweezer bottom pattern above the $89.15 handle on the H1 timeframe. It signifies the end of a bearish phase and the start of a bullish phase in the market.
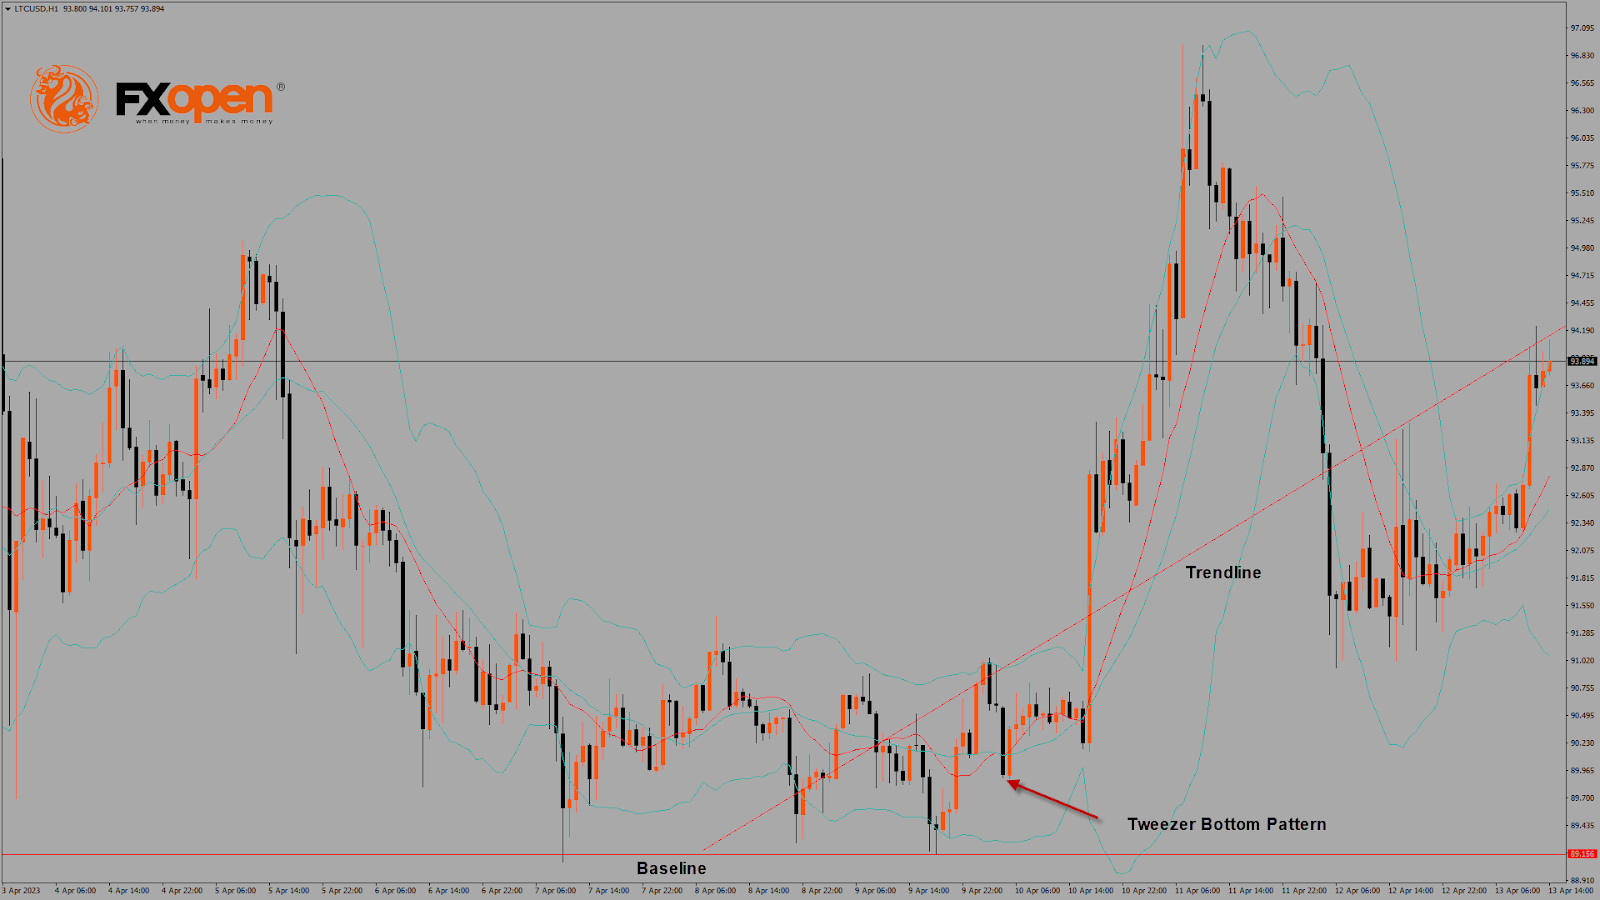
The price of Litecoin is near the channel’s support, indicating upcoming bullish movement. Also, Litecoin is trading above its 100-hour simple moving average and 200-hour exponential moving average, and it’s above the pivot level of $93.76.
The relative strength index is at 67.54, reflecting a very strong demand for Litecoin and the continuation of the buying pressure in the markets.
Litecoin remains above all moving averages, so the market is still bullish at the current market level of $94.23.
Both Williams’s percent range and STOCHRSI are signalling overbought market conditions, which means that the price is expected to decline in the short-term range.
The short-term outlook for Litecoin has turned as strongly bullish.
- Technical indicators are bullish.
- Litecoin bullish reversal is seen above the $89.15 level.
- The average true range indicates low market volatility.
Litecoin Bullish Reversal Seen Above $89.15
The price of Litecoin continues to move in a very strong uptrend, crossing the $95 handle, with further resistances at $98 and $100.
There is a bullish crossover of 50-day and 100-day moving averages in the 4-hour timeframe.
LTCUSD has crossed its classic resistance level of $93.93 and Fibonacci resistance level of $94.22, after which the path towards $100 will get cleared.
Litecoin faces resistance at $96.96, which is a 1-month high, and at $97.99, which is the third resistance level of the pivot point indicator.
The Week Ahead
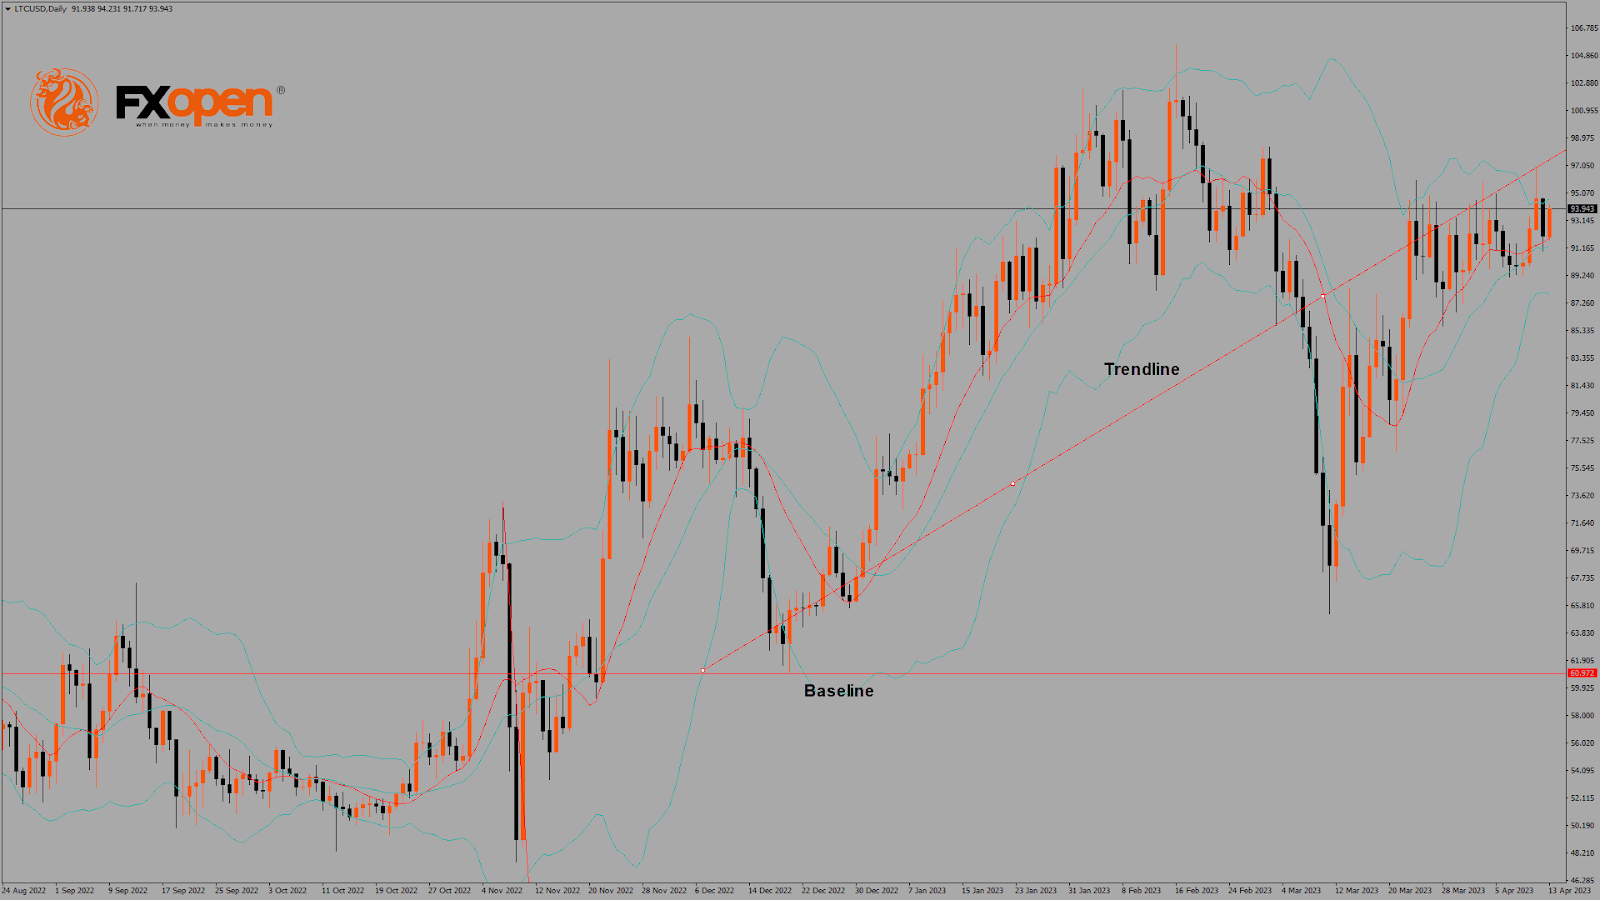
The price of Litecoin rebounded from the high of $96.85, and after the market consolidation, the bullish trend continued in the daily timeframe.
Most of the technical indicators are reflecting a bullish sentiment.
Litecoin may stay above the important support level of $92.12, at which price crosses the 9-day moving average, and at $90.38, which is the first support level of the pivot point indicator.
The short-term outlook for Litecoin has turned strongly bullish, the medium-term outlook is bullish, and the long-term outlook is neutral at present market conditions.
The weekly projection is $110, with a consolidation zone at $105.


