
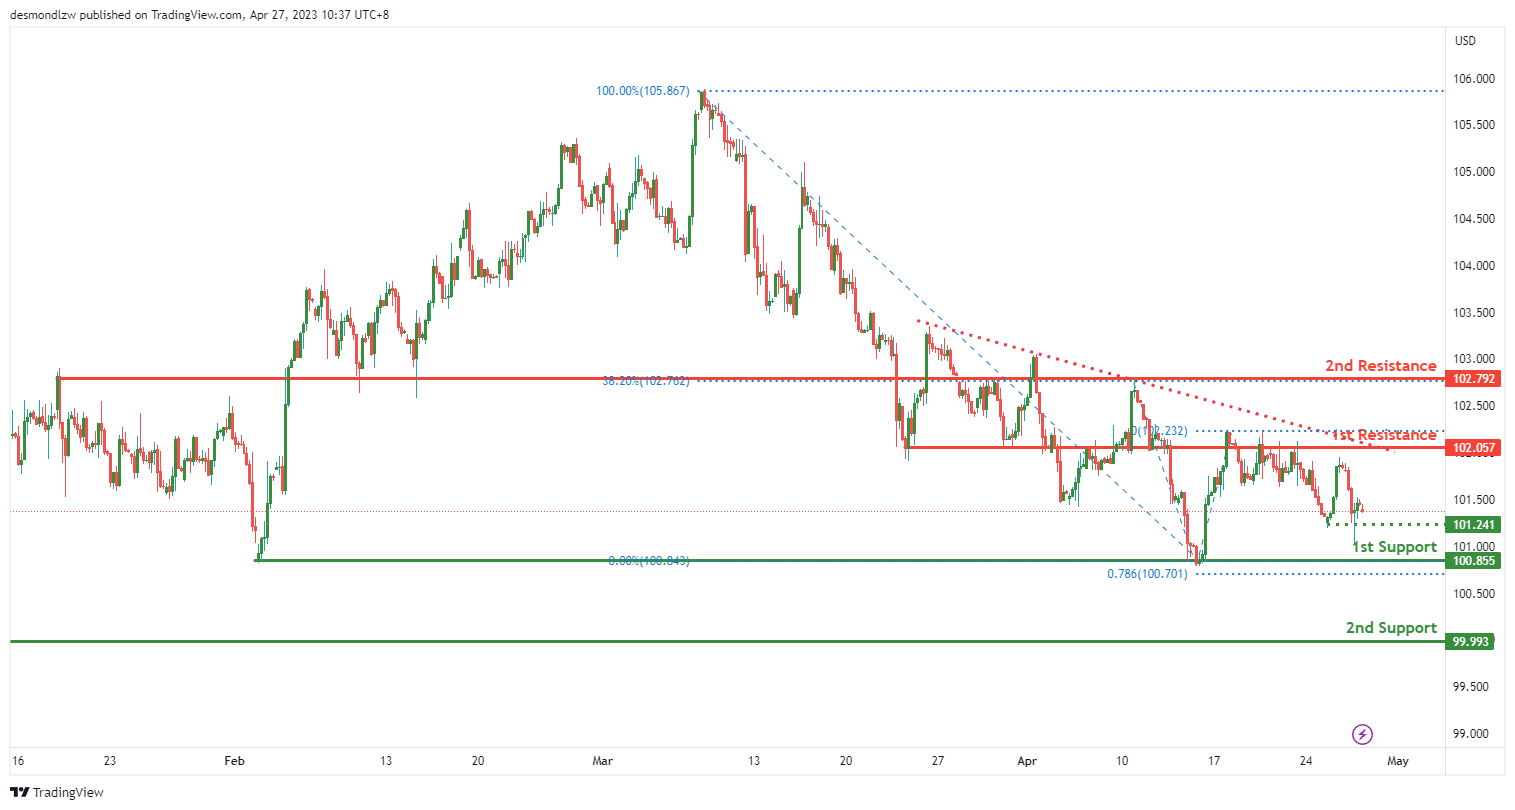
DXY:
The overall theme for DXY, as it is currently below a major descending trend line, signalling potential further drops in price. If the bearish trend continues, the first support level to watch out for is at 100.85, a multi-swing low support that has been previously tested. Below that, the second support level at 99.99 is also a swing low support that could provide additional support to price.
On the other hand, the first resistance level is at 102.05, an overlap resistance level that could potentially hinder the rise of prices. If price were to break through this level, the next resistance level to watch out for is at 102.79, another overlap resistance level, and coincides with the 38.20% Fibonacci retracement level.
There is also an intermediate support level at 101.24, which is a swing low support that could provide additional support in case the price falls further.
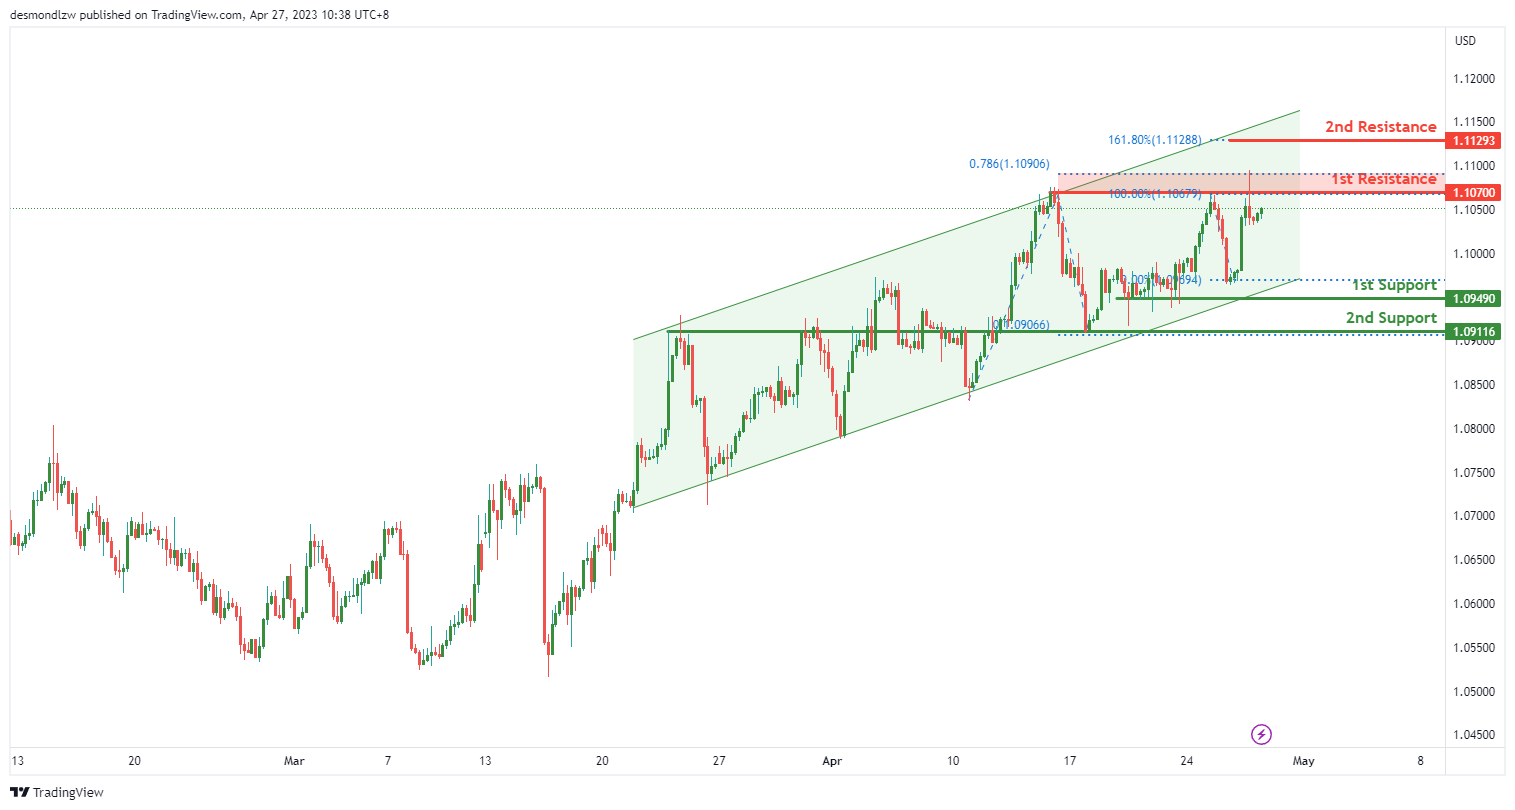
EUR/USD:
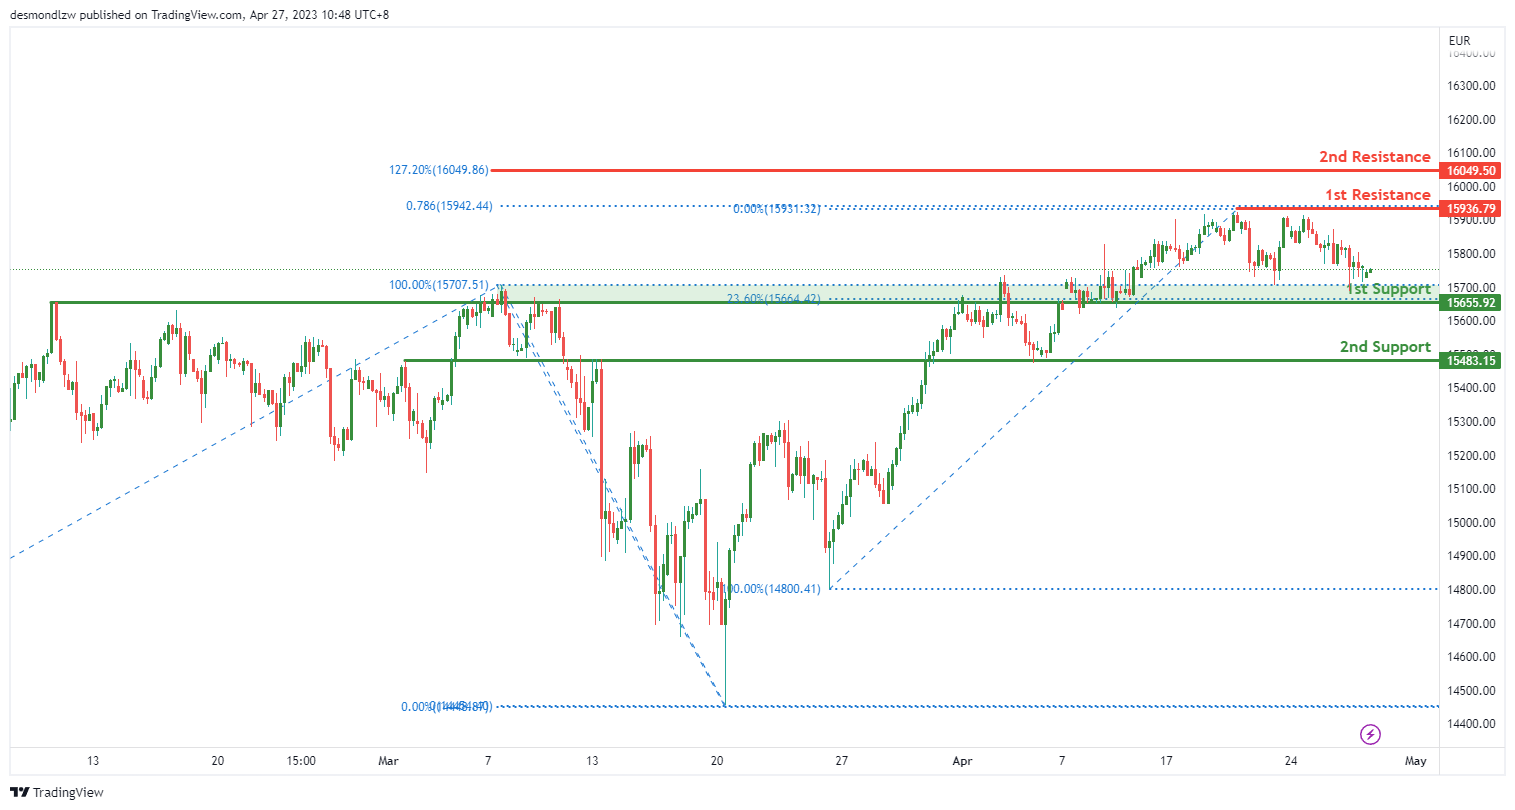
EUR/USD is showing bullish momentum as it is in a bullish ascending channel. This suggests that the price may continue to rise due to its bullish momentum. The current potential is a bullish break through of the 1st resistance and rise to the 2nd resistance.
The 1st support is at 1.0949, and it is a multi-swing low support. The 2nd support is at 1.0911, and it is an overlap support.
On the other hand, the 1st resistance is at 1.1070, and it is a swing high resistance with a 78.60% Fibonacci Projection. The 2nd resistance is at 1.1129, and it is at 161.80% Fibonacci Extension.
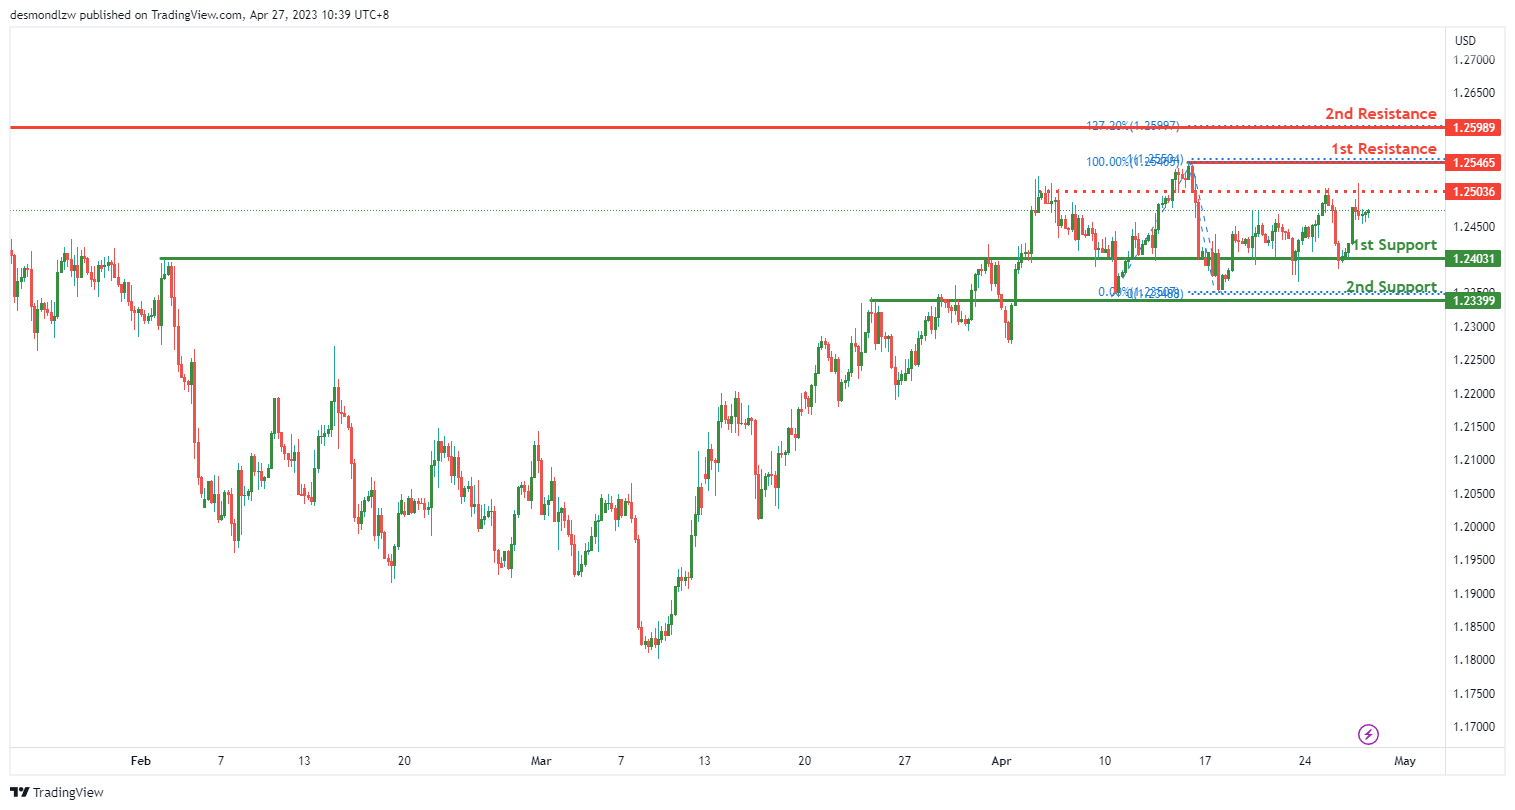
GBP/USD:
The GBP/USD chart currently exhibits a bullish momentum, with the price potentially continuing to rise towards the first resistance level. The first support level is at 1.2403 and it is an overlap support, meaning that it has been tested multiple times in the past and has held up well. The second support level at 1.2339 is also an overlap support, indicating a strong level of historical support.
The first resistance level is at 1.2546, which is a swing high resistance, and is also coinciding with a 100% Fibonacci projection. If the price manages to break through this resistance, it could rise towards the second resistance level at 1.2598. This level is also a swing high resistance and coincides with a 127.20% Fibonacci extension.
In between these two resistance levels, there is an intermediate resistance at 1.2503. This level has been tested multiple times in the past and has acted as a strong resistance level.
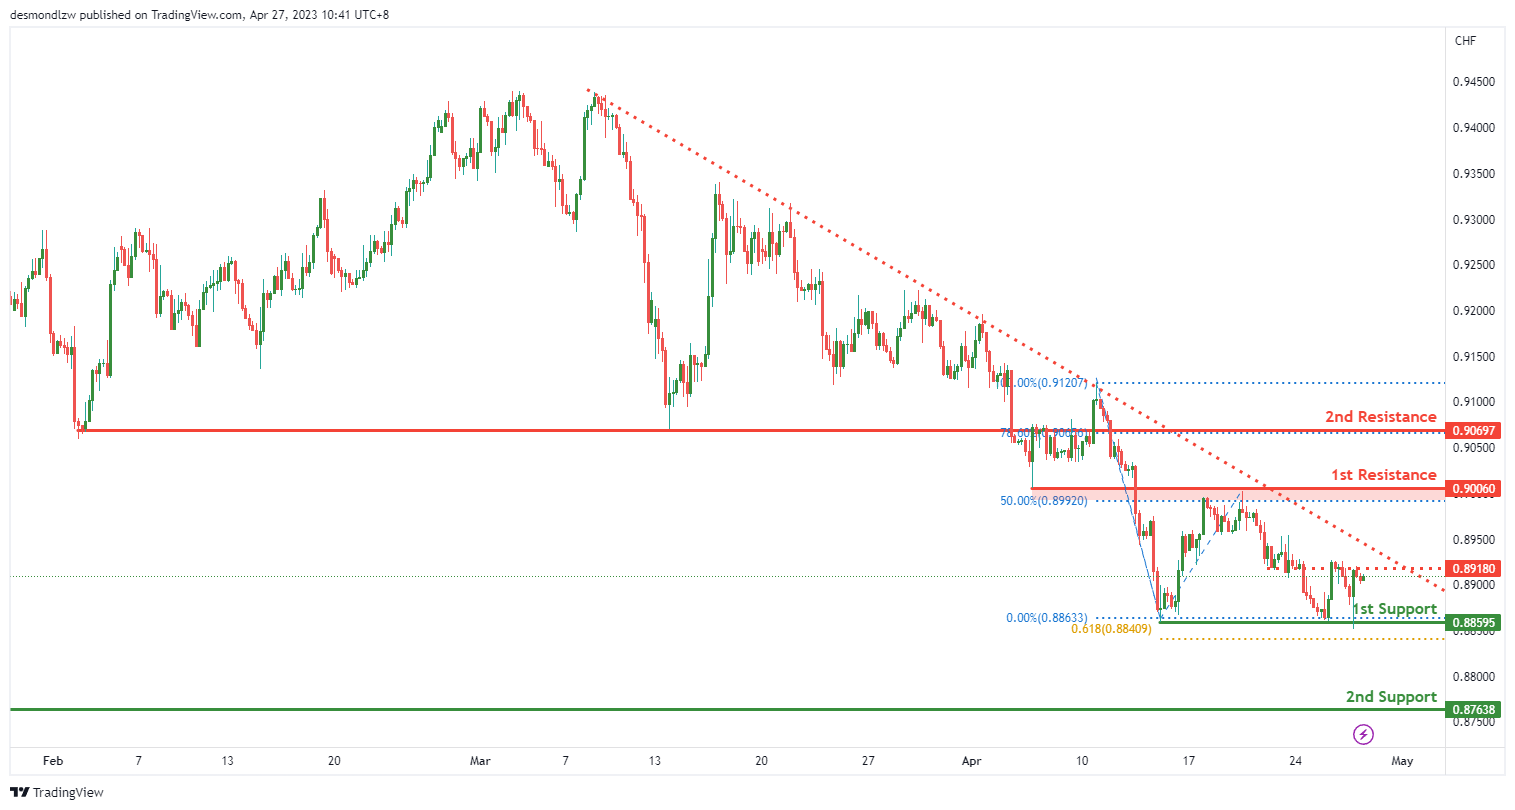
USD/CHF:
The USD/CHF chart is showing a bearish overall momentum, with price currently below a major descending trend line. This suggests that bearish momentum is on the cards, which suggests that price might continue to go lower due to its bearish momentum.
As for potential price action, there could be a bearish continuation towards the 1st support level at 0.8859. This level is a multi-swing low support and coincides with a 61.80% Fibonacci projection, making it a strong support level. If price breaks below this level, it could potentially drop to the 2nd support at 0.8763, which is a swing low support.
On the resistance side, there is a 1st resistance at 0.9006, which is an overlap resistance level that coincides with a 50% Fibonacci retracement. Additionally, there is a 2nd resistance at 0.9069, which is a pullback resistance level that coincides with a 78.60% Fibonacci retracement. Between the current price and the 1st resistance, there is an intermediate resistance at 0.8918, which is also an overlap resistance.
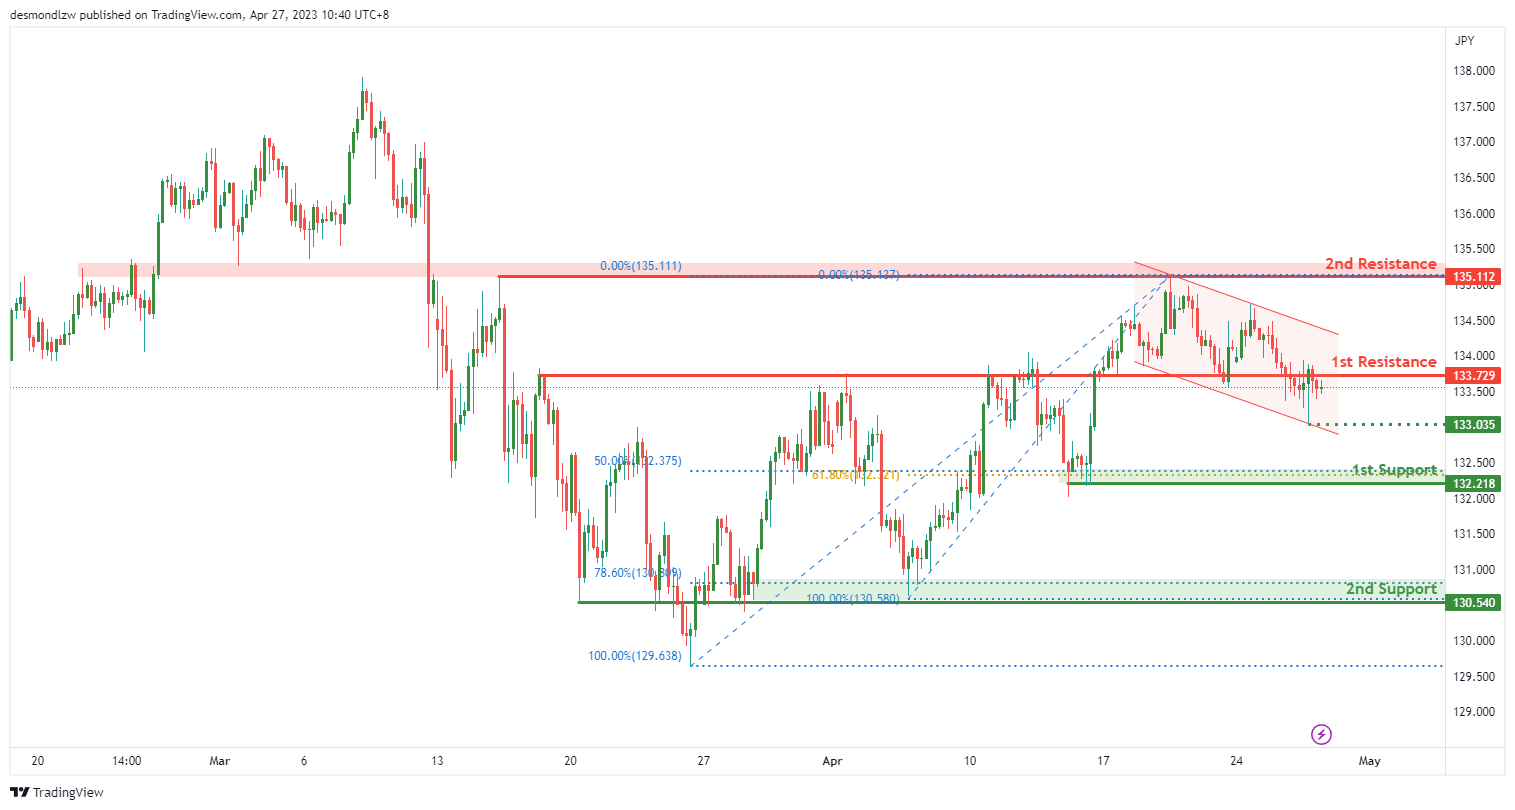
USD/JPY:
The USD/JPY pair is currently seeing a bearish momentum as it remains within a descending channel, suggesting that price might continue to go lower due to its bearish momentum. Additionally, price is below a major descending trend line, further indicating bearish momentum.
There is a potential for a bearish continuation towards the 1st support at 132.2100, which is a multi-swing low support and coincides with a 61.80% Fibonacci retracement. If price breaks below this level, it could potentially drop to the 2nd support at 130.5400, which is an overlap support and coincides with a 78.60% Fibonacci retracement.
On the other hand, the 1st resistance is at 133.7200, which is an overlap resistance. If price manages to break above this level, it could potentially rise to the 2nd resistance at 135.1100, which is a multi-swing high resistance.
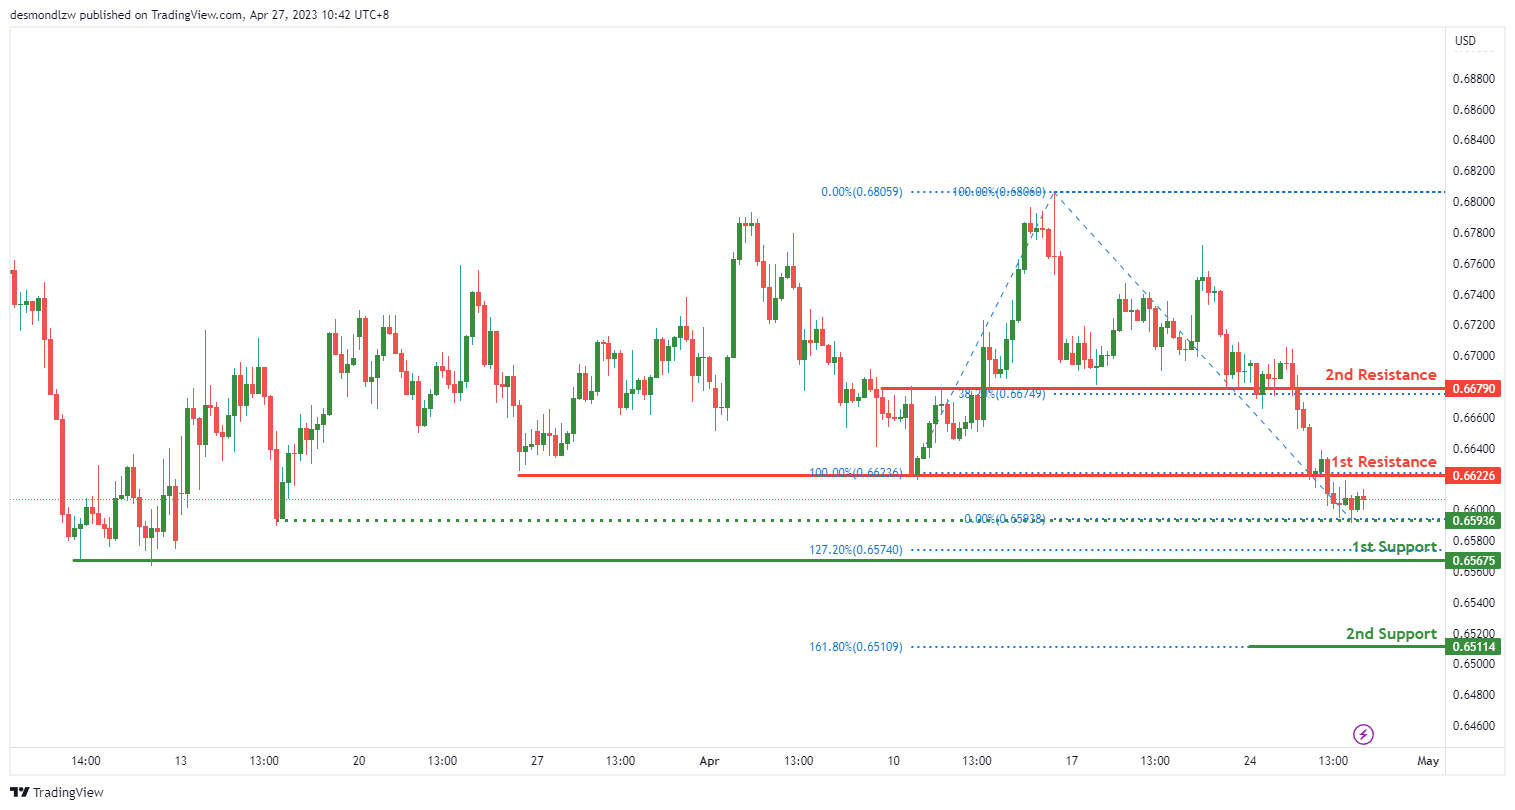
AUD/USD:
The overall momentum of the AUD/USD chart is bearish, with price potentially continuing its descent towards the 1st support level. The pair is currently facing a multi-swing low support at 0.6567, which is also supported by the 127.20% Fibonacci Extension, making it a strong level of support.
If the 1st support level is breached, the pair could drop to the 2nd support level at 0.6511, which is reinforced by the 161.80% Fibonacci Extension, adding further strength to this level of support.
On the other hand, if the pair manages to climb upwards, it could encounter its first resistance level at 0.6622, which is an overlap resistance. A break above this level could potentially lead to a pullback towards the 2nd resistance level at 0.6679, which is further reinforced by the 38.20% Fibonacci Retracement.
In the meantime, the intermediate support level of 0.6593, which is a multi-swing low support, may offer some temporary respite for the pair.
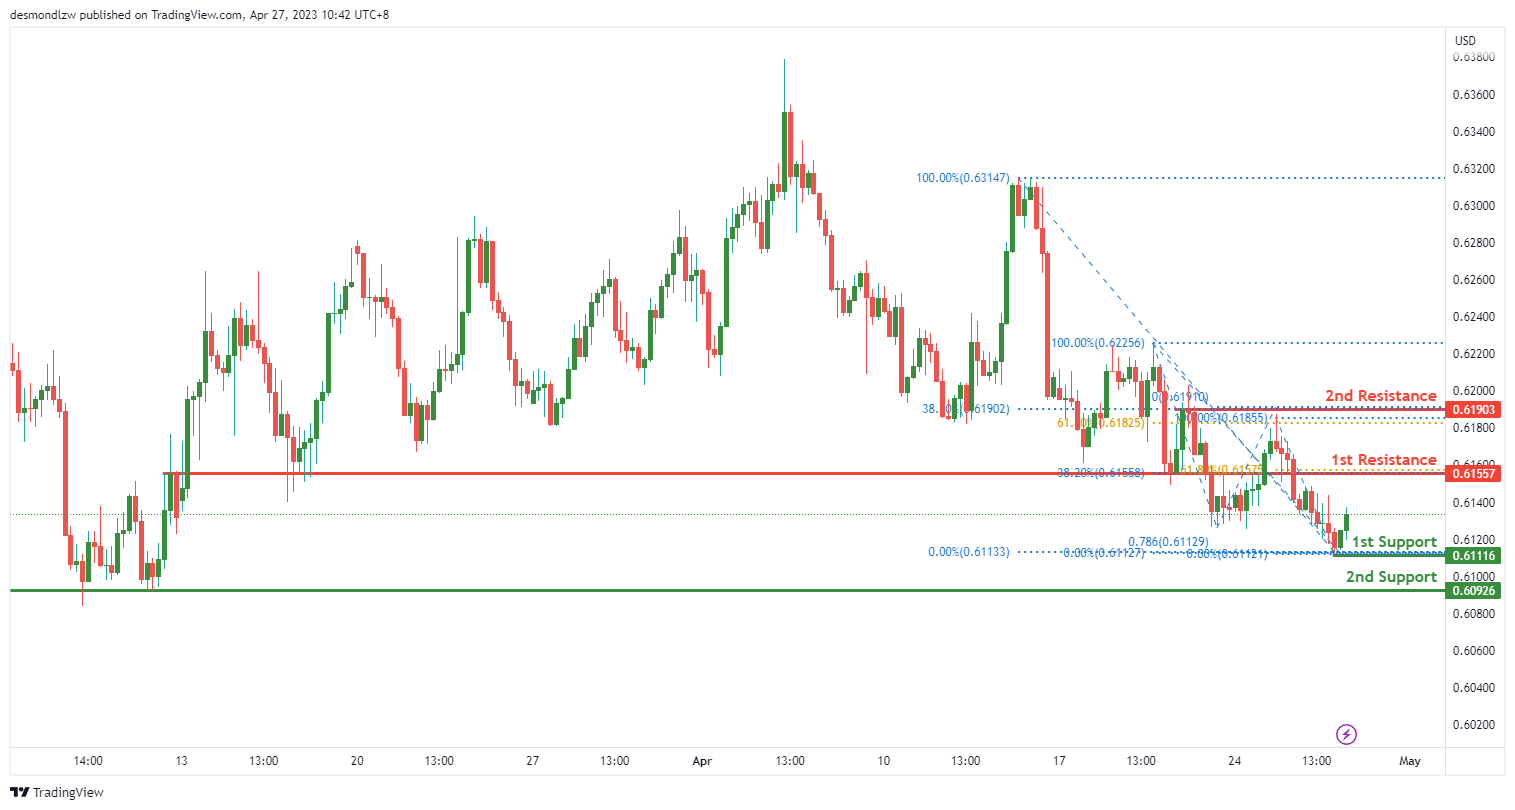
NZD/USD:
The overall momentum of the NZD/USD chart is currently bullish, with price potentially making a bullish continuation towards the first resistance level. The bullish momentum is indicated by price holding above a swing low support and with an overall trend that suggests further upward movement.
In terms of specific support and resistance levels, the first support level is at 0.6111, which is a swing low support and also coincides with the 78.60% Fibonacci projection. The second support level is at 0.6092, which is a multi-swing low support.
On the other hand, the first resistance level is at 0.6155, which is an overlap resistance and also lines up with the 38.20% Fibonacci retracement. The second resistance level is at 0.6190, which is a multi-swing high resistance and coincides with the 61.80% Fibonacci retracement.
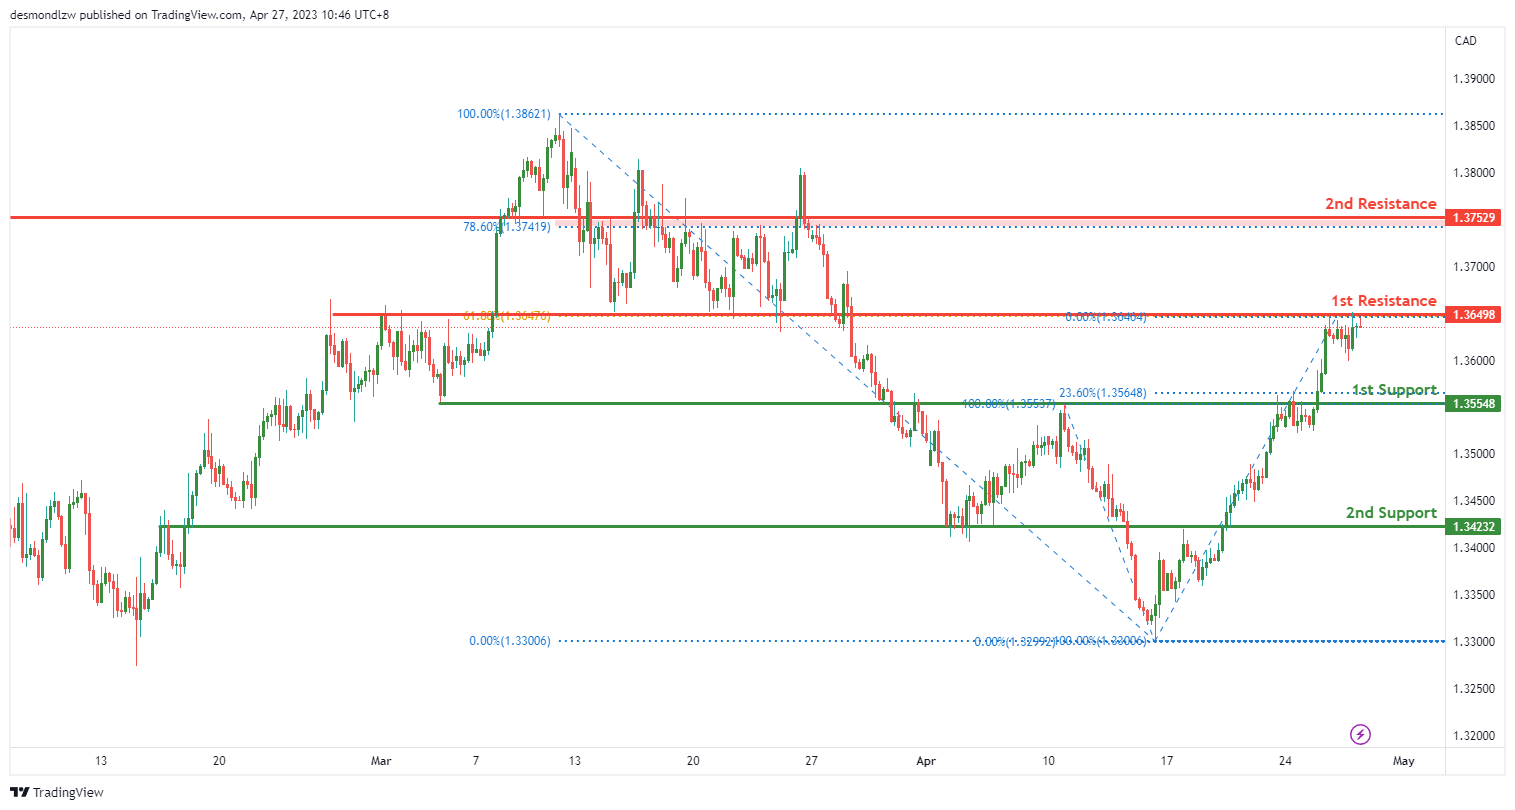
USD/CAD:
The USD/CAD chart currently shows bearish momentum, with price below a major descending trend line. Additionally, the chart is within a bearish channel, which suggests that price may continue to go lower due to its bearish momentum.
Price could potentially make a bearish reaction off the first resistance at 1.3649 and drop to the first support at 1.3554. This support level is a pullback support and is at a 23.60% Fibonacci retracement. If price were to break this level, the next support is at 1.3423, which is also a pullback support.
On the other hand, if price were to break the first resistance, it could rise towards the second resistance at 1.3752. This level is a pullback resistance and coincides with a 78.60% Fibonacci retracement.
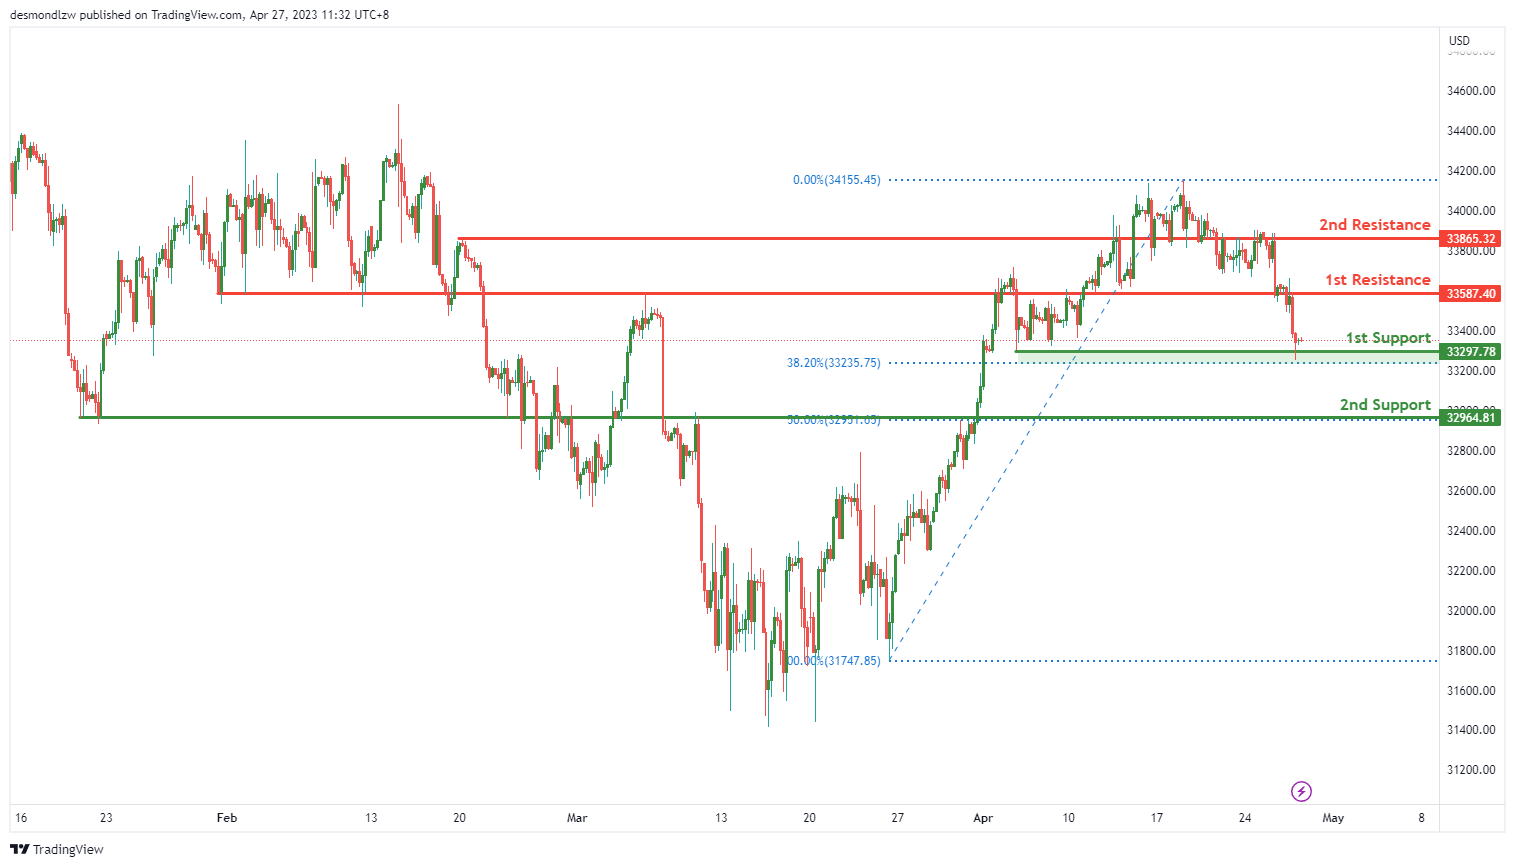
DJ30:
The Dow Jones Industrial Average (DJ30) has been showing bearish momentum with price potentially making a bearish break off the first support towards the second support. The overall momentum of the chart is bearish with the price being below a major descending trend line, indicating that bearish momentum is on the cards.
The first support for DJ30 is at 33297.78, which is a multi-swing low support level and also coincides with the 38.20% Fibonacci retracement level. This level has held as support in the past, making it a good level to watch for potential buying opportunities. If the price breaks below this support level, it could drop towards the second support at 32964.81, which is a pullback support level and also coincides with the 50% Fibonacci retracement level.
On the resistance side, the first resistance level is at 33587.40, which is an overlap resistance level. This level could potentially act as a barrier to the price moving higher. If the price manages to break above this level, it could rise towards the second resistance level at 33865.32, which is also an overlap resistance level.
GER30:
The GER30 chart is currently showing bullish momentum, with potential for a bounce off the first support towards the first resistance level. The overall momentum of the chart is bullish, which indicates that the price may continue to rise due to its bullish momentum.
The first support level is at 15655.92, which is an overlap support and is supported by the 23.60% Fibonacci retracement. This is a strong level of support that may provide a bounce for the price to move towards the first resistance level.
The second support level is at 15483.15, which is another overlap support level. If the price fails to hold above the first support level, this level could be the next target for bears.
The first resistance level is at 15936.79, which is a swing high resistance level. A breakout above this level could trigger a further rise towards the second resistance level.
The second resistance level is at 16049.50, which is supported by the 127.20% Fibonacci extension. This level may provide strong resistance to the price, but a break above it could signal further bullish momentum.
BTC/USD:
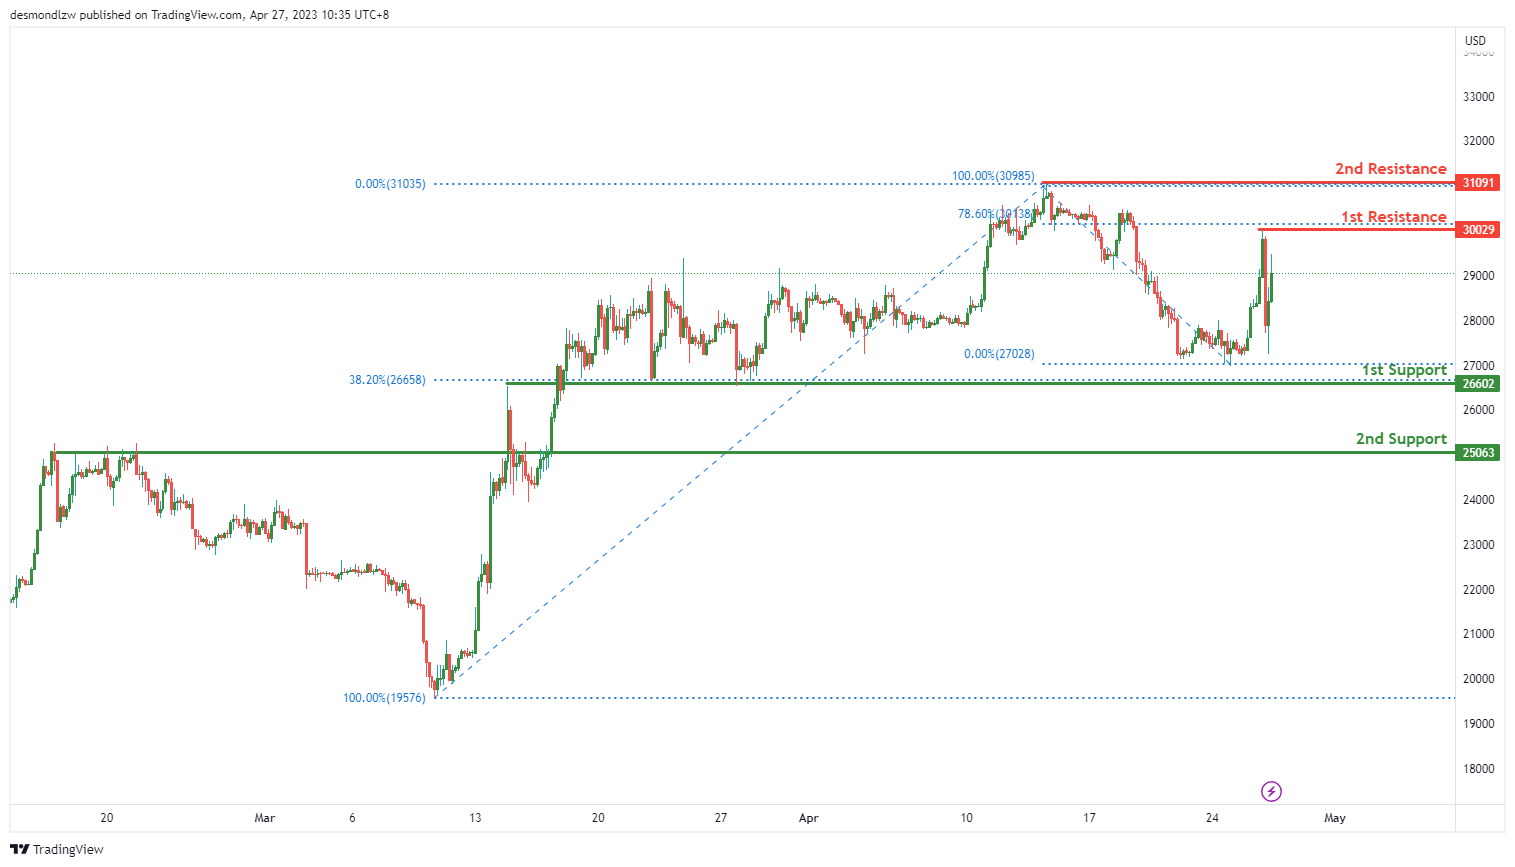
Bitcoin (BTC/USD) has been trading with a neutral bias recently, showing no clear direction on the chart. The price action of the world’s largest cryptocurrency by market capitalization has been oscillating between two key levels. On the one hand, the 1st support level is set at 26,602, which is a significant overlap support that the price has bounced off in the past. On the other hand, the 1st resistance level is placed at 30,029, which is a key swing high resistance and is also located at the 78.60% Fibonacci retracement level.
If the price of BTC/USD manages to break through the 1st resistance level, it could signal a potential bullish momentum and an increase in buying pressure. The next significant resistance level that traders might watch for is at 31,091, which is a key swing high resistance that has been in place for several weeks.
However, if the price of BTC/USD drops below the 1st support level, it could suggest a potential bearish trend and an increase in selling pressure. In this case, the next significant support level that traders may look at is 25,063, which is a pullback support level that has been tested several times in the past.
US500
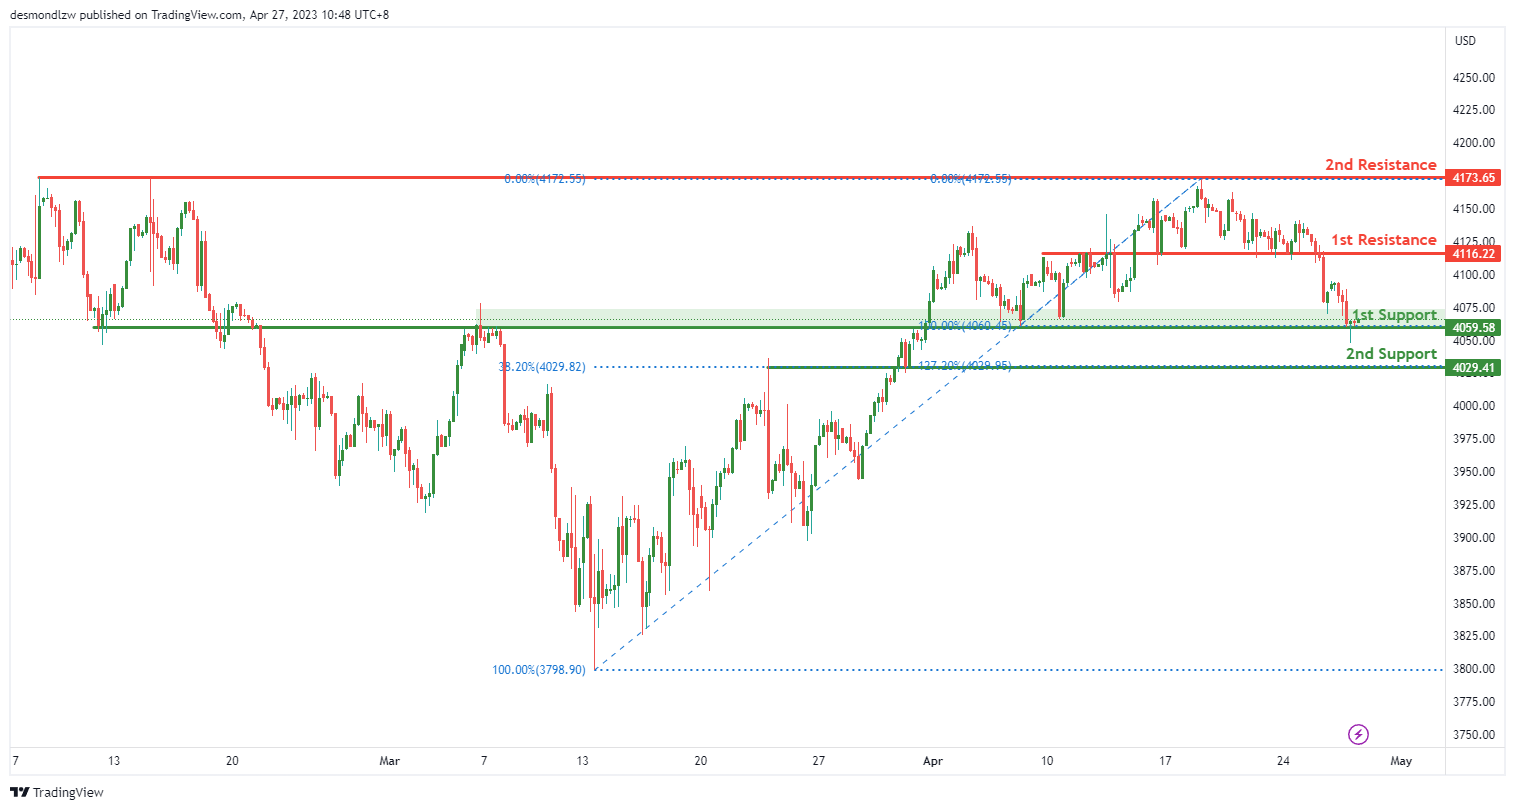
The US500 chart suggests a bullish bias with an overall bullish momentum. Price may potentially bounce off the 1st support at 4059.58, which is an overlap support level. If price rises from this level, it could head towards the 1st resistance at 4116.22, which is a pullback resistance level. A break above this level could push the price towards the 2nd resistance at 4173.65, which is a multi-swing high resistance level.
In case of a downward move, the 2nd support level at 4029.41 could provide pullback support as it lines up with the 38.20% Fibonacci retracement. The 1st support level at 4059.58 is also a potential level of support as it is an overlap support level. A break below this level could cause the price to drop towards the 2nd support level.
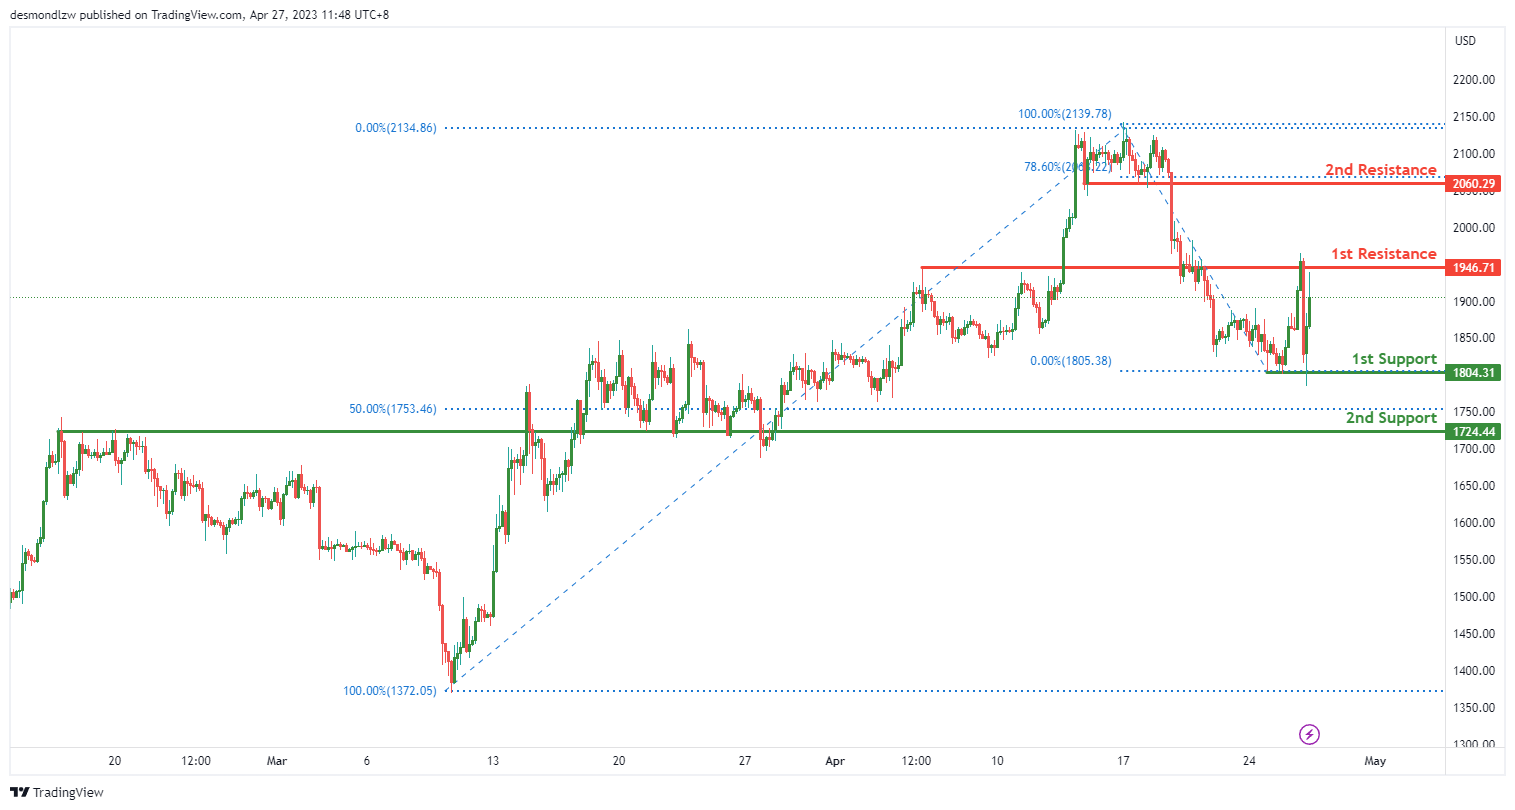
ETH/USD:
The overall momentum of the ETH/USD chart is currently neutral, suggesting that there is no clear trend direction. As a result, price could potentially fluctuate between key support and resistance levels in the short term.
The first support level is at 1804.31, which is a multi-swing low support. This level could provide some buying interest and push prices higher. If the first support level fails to hold, the next support level is at 1724.44, which is an overlap support and coincides with the 50% Fibonacci retracement level. This level has proven to be a strong support in the past and could attract buyers if price drops towards it.
On the other hand, the first resistance level is at 1946.71, which is an overlap resistance. If price manages to break above this level, it could potentially trigger a bullish move towards the second resistance level at 2060.29. This level is a pullback resistance and coincides with the 78.60% Fibonacci retracement level.
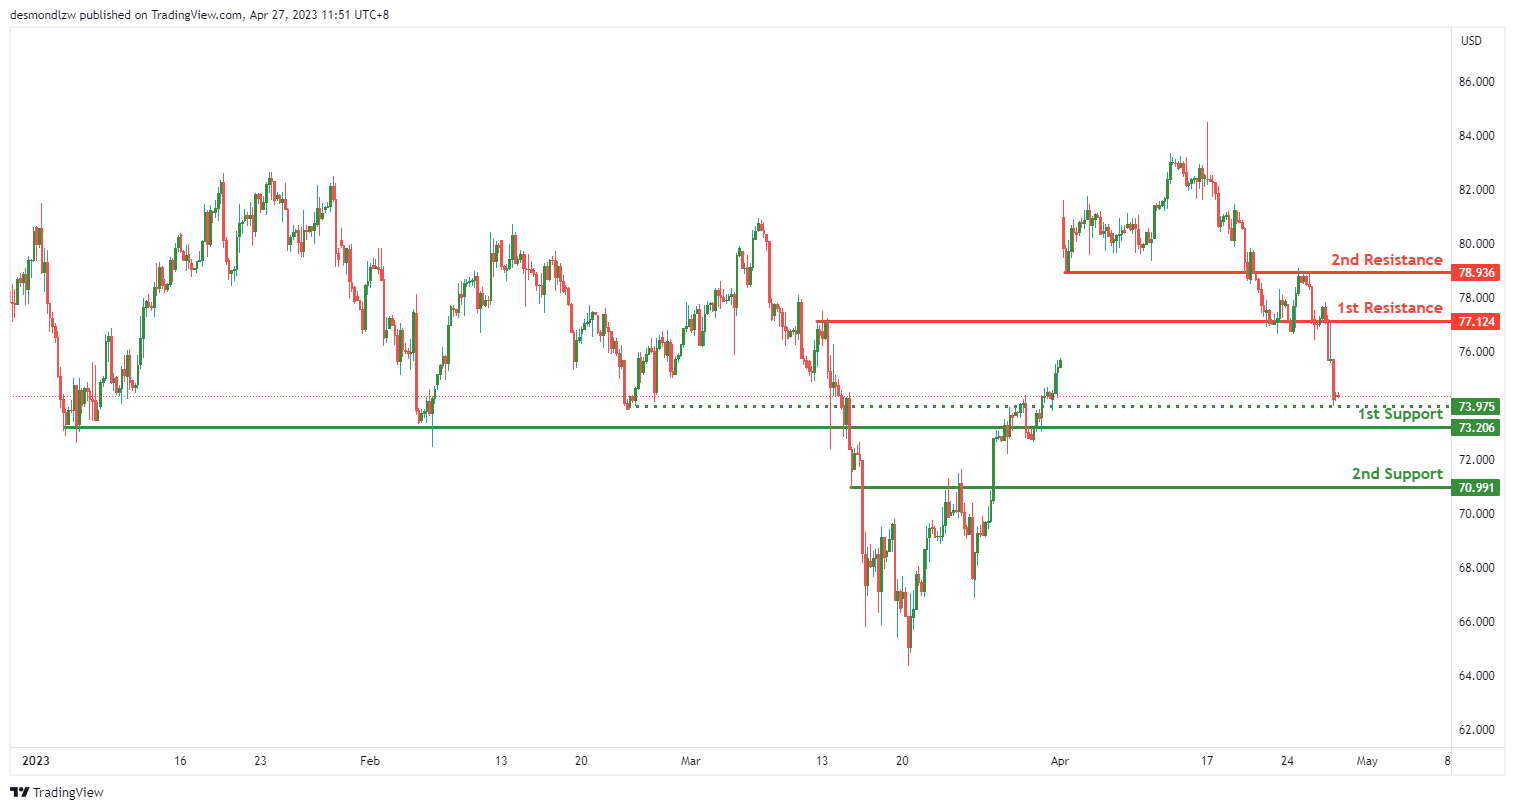
WTI/USD:
The WTI price is currently bearish, and it could potentially continue to drop towards the 1st support level.
The 1st support level is at 73.20, and it is a strong overlap support level. If the price breaks through this support level, the next support level is at 70.99, which is a pullback support level.
On the other hand, the 1st resistance level is at 77.12, and it is a strong overlap resistance level. If the price were to rise, it could face a resistance at 78.93, which is another overlap resistance level.
There is an intermediate support level at 73.97, which is a pullback support level. If the price were to break this intermediate support, it could potentially drop towards the 2nd support level at 70.99.
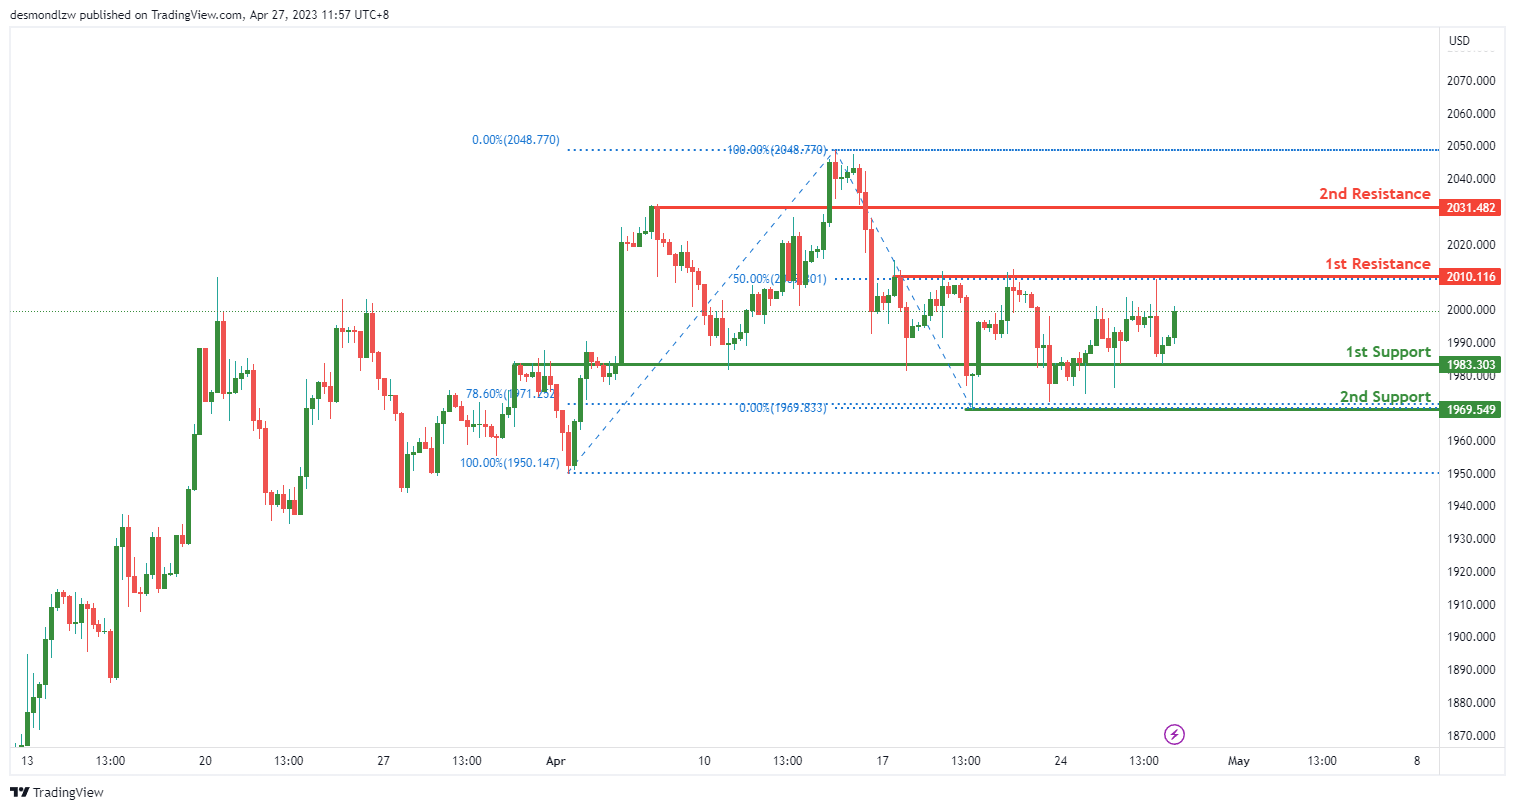
XAU/USD (GOLD):
XAU/USD has been showing strong bullish momentum on the chart, suggesting that prices might continue to rise further. At present, the overall momentum of the chart is bullish. Price is currently fluctuating between the 1st support level at 1983.30 and the 1st resistance level at 2010.11. However, price could potentially make a bullish continuation towards the 1st resistance level.
The 1st support level at 1983.30 is a strong overlap support, indicating that this level has previously acted as both support and resistance. The 2nd support level at 1969.54 is a swing low support, and it has a 78.60% Fibonacci retracement lining up with it. This level is also a good pullback support.
The 1st resistance level at 2010.11 is a swing high resistance, which means it has acted as a resistance level in the past. The 2nd resistance level at 2031.48 is a pullback resistance, suggesting that it might potentially act as a resistance level as well.


