
DXY:
The DXY chart is currently showing strong bullish momentum overall, with the potential for a bullish breakthrough of the 1st resistance level and a rise towards the 2nd resistance level.
The 1st support level is at 101.24, which is a multi-swing low support level. This level has been tested multiple times in the past and has held up as a strong support level for the DXY chart.
If the price were to break below the 1st support level, it could potentially drop to the 2nd support level at 100.84. This level is also a multi-swing low support level and coincides with a 78.60% Fibonacci projection, making it a strong support level for the DXY chart.
On the other hand, the 1st resistance level is at 102.21, which is a multi-swing high resistance level. This level has also been tested multiple times in the past and has held up as a strong resistance level for the DXY chart.
If the price were to break above the 1st resistance level, it could potentially rise towards the 2nd resistance level at 102.79. This level is an overlap resistance level and coincides with a 38.20% Fibonacci retracement, making it a strong resistance level for the DXY chart.
It’s worth noting that the DXY chart is currently showing strong bullish momentum overall, with the potential for a bullish breakthrough of the 1st resistance level. Additionally, the price is currently above the Ichimoku cloud, which suggests bullish momentum.
However, it’s also worth noting that the price is below a descending trend line, which suggests possible bearish momentum. As such, it’s important to keep an eye on the chart and monitor any potential breakouts or trend changes.

EUR/USD:
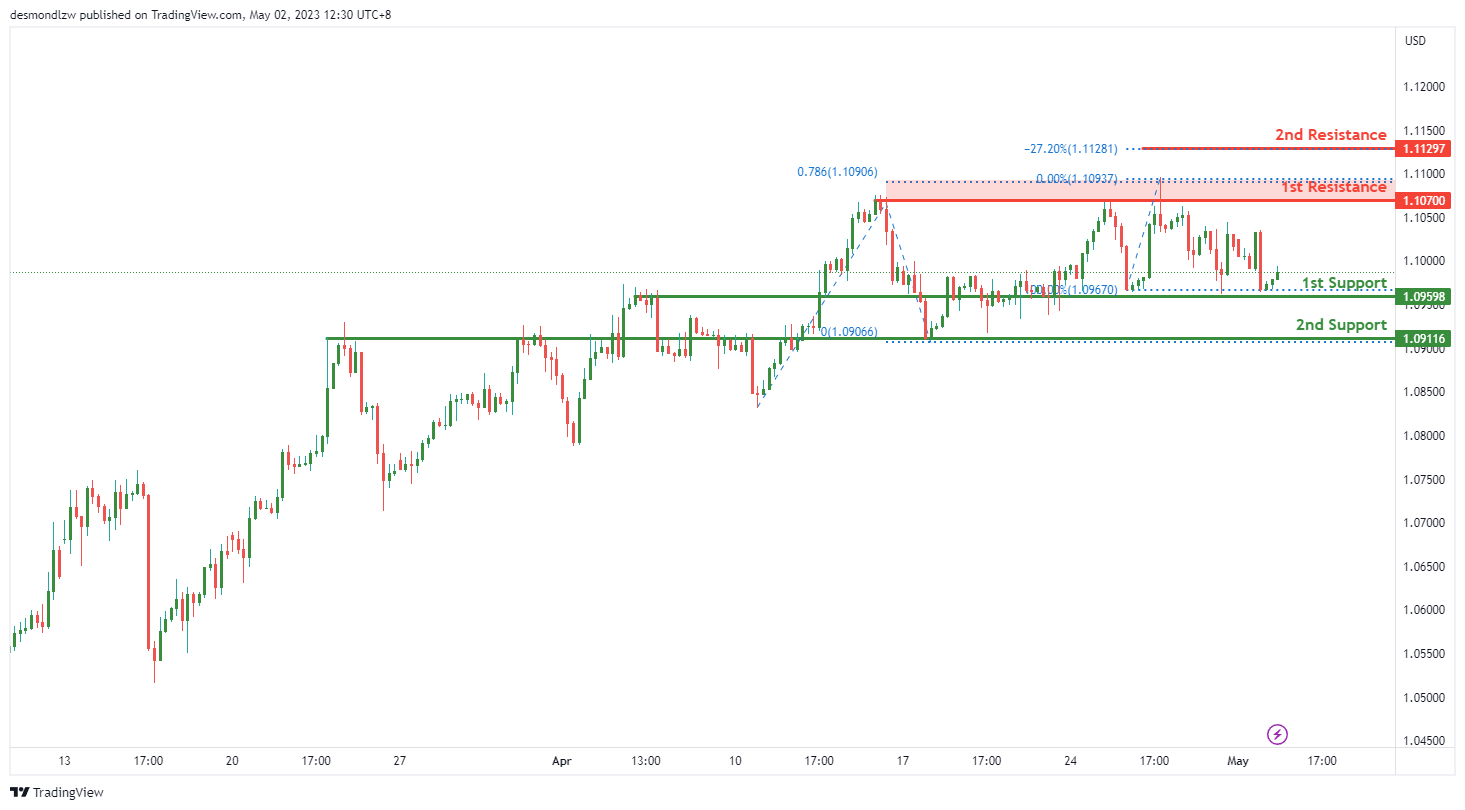
The EUR/USD chart is currently showing strong bullish momentum overall, with the potential for a bullish continuation towards the 1st resistance level.
The 1st support level is at 1.0959, which is an overlap support level. This level has been tested multiple times in the past and has held up as a strong support level for the EUR/USD chart.
If the price were to break below the 1st support level, it could potentially drop to the 2nd support level at 1.0911. This level is also an overlap support level and coincides with a previous swing low, making it a strong support level for the EUR/USD chart.
On the other hand, the 1st resistance level is at 1.1070, which is a multi-swing high resistance level. This level has been tested multiple times in the past and has held up as a strong resistance level for the EUR/USD chart. Additionally, this level coincides with a 78.60% Fibonacci projection, making it an even stronger resistance level.
If the price were to break above the 1st resistance level, it could potentially rise towards the 2nd resistance level at 1.1129. This level is a swing high resistance level and coincides with a -27% Fibonacci expansion, making it a strong resistance level for the EUR/USD chart.
GBP/USD:
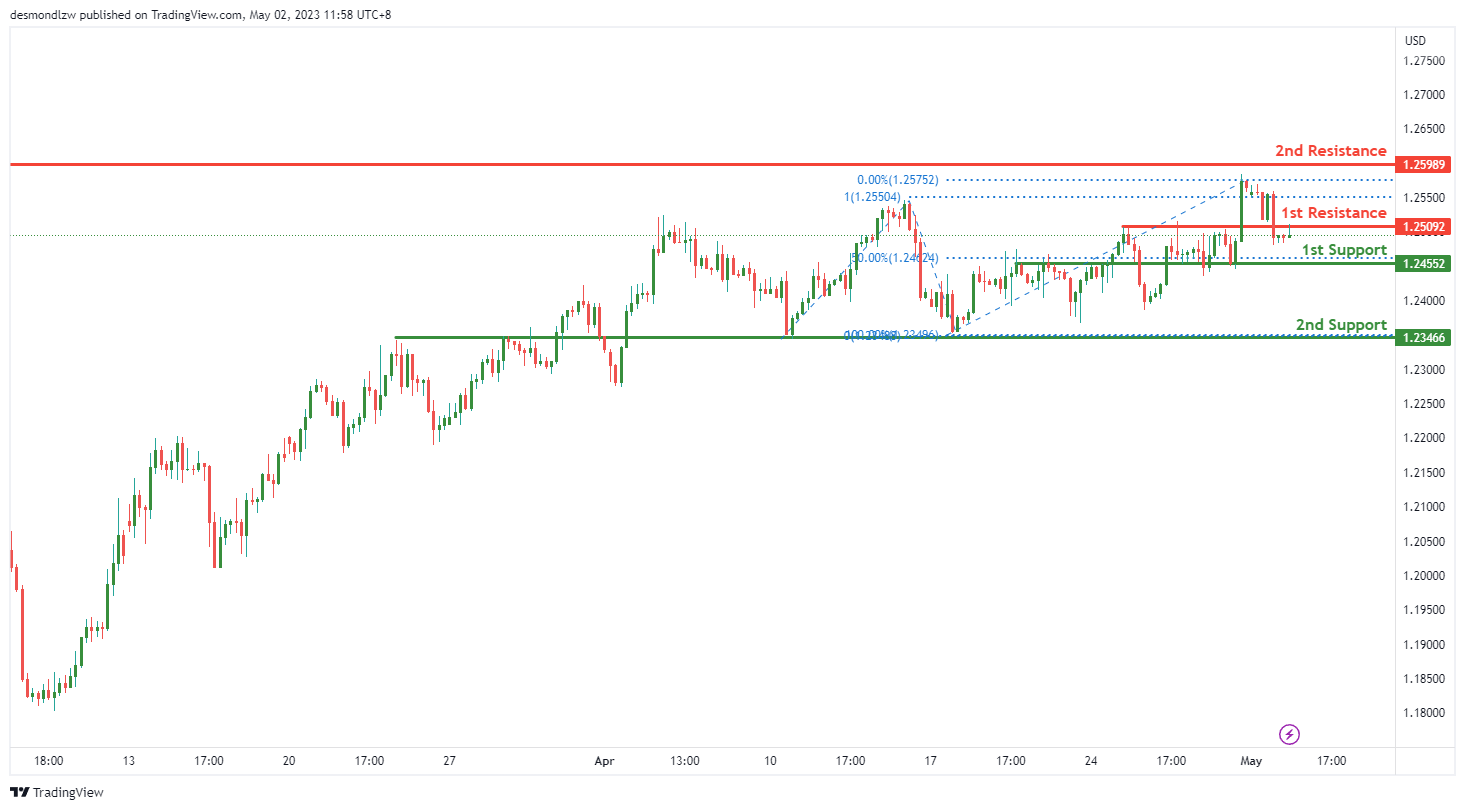
The GBP/USD chart is currently showing strong bullish momentum overall, with the potential for a bullish breakout towards the 2nd resistance level.
The 1st support level is at 1.2455, which is an overlap support level and coincides with a 50% Fibonacci retracement. This level has been tested multiple times in the past and has held up as a strong support level for the GBP/USD chart.
If the price were to break below the 1st support level, it could potentially drop to the 2nd support level at 1.2346. This level is also an overlap support level and has held up as a strong support level in the past.
On the other hand, the 1st resistance level is at 1.2509, which is a pullback resistance level. This level has been tested multiple times in the past and has held up as a strong resistance level for the GBP/USD chart.
If the price were to break above the 1st resistance level, it could potentially rise towards the 2nd resistance level at 1.2598. This level is a swing high resistance level and has held up as a strong resistance level in the past.
USD/CHF:
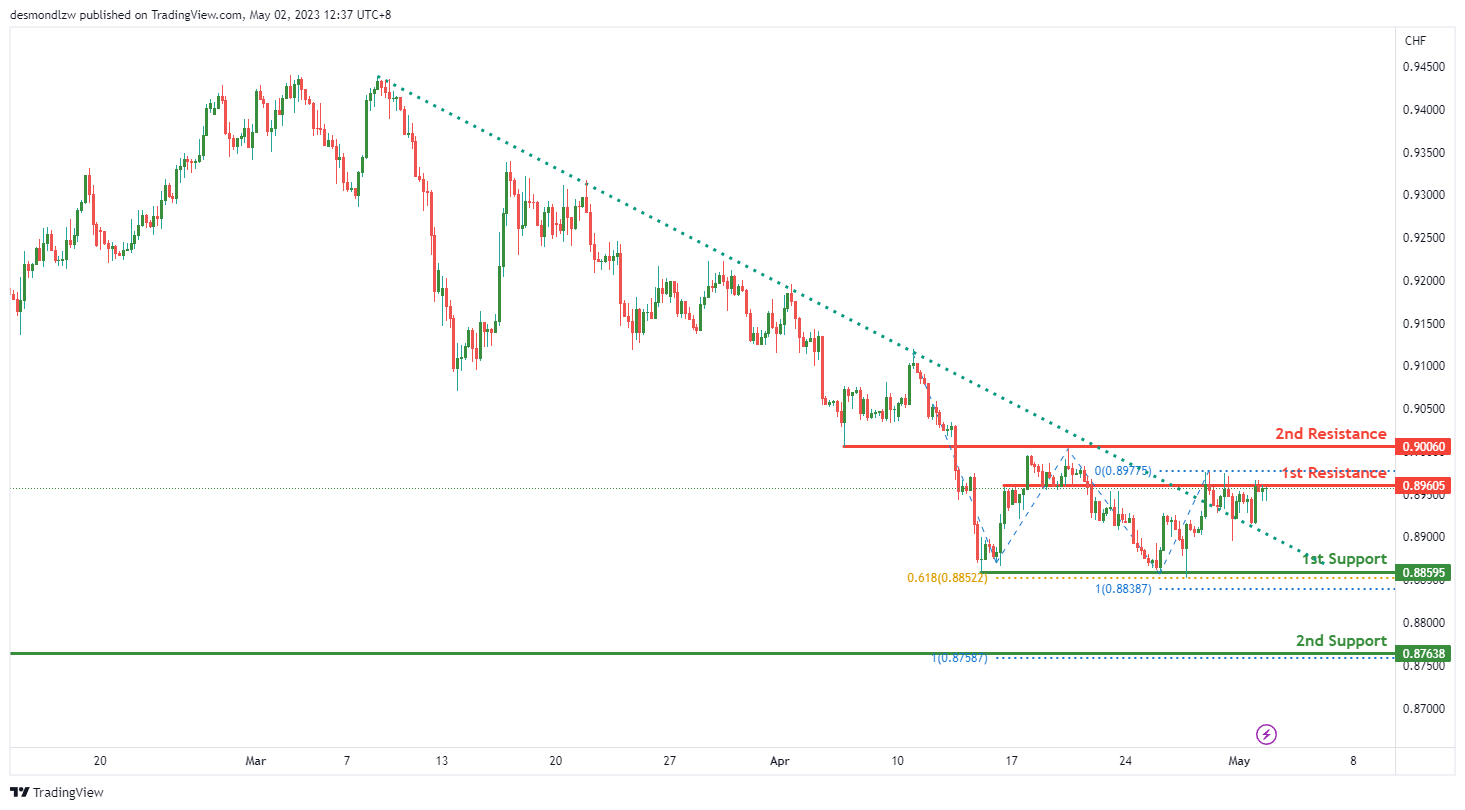
The USD/CHF chart is currently showing strong bullish momentum overall, with several factors contributing to this bullish momentum. Firstly, the price has crossed above the Ichimoku cloud, which is a bullish signal. Additionally, the price broke above a descending resistance line, triggering a potential bullish move.
The 1st support level is at 0.8859, which is a multi-swing low support level and coincides with a 61.80% Fibonacci projection. This level has been tested multiple times in the past and has held up as a strong support level for the USD/CHF chart.
If the price were to break below the 1st support level, it could potentially drop to the 2nd support level at 0.8763. This level is also a swing low support level and has held up as a strong support level in the past.
On the other hand, the 1st resistance level is at 0.8960, which is an overlap resistance level. This level has been tested multiple times in the past and has held up as a strong resistance level for the USD/CHF chart.
If the price were to break above the 1st resistance level, it could potentially rise towards the 2nd resistance level at 0.9006. This level is also an overlap resistance level and has held up as a strong resistance level in the past.
It’s worth noting that the USD/CHF chart is currently showing strong bullish momentum overall, with the potential for a breakout towards the 2nd resistance level.
USD/JPY:
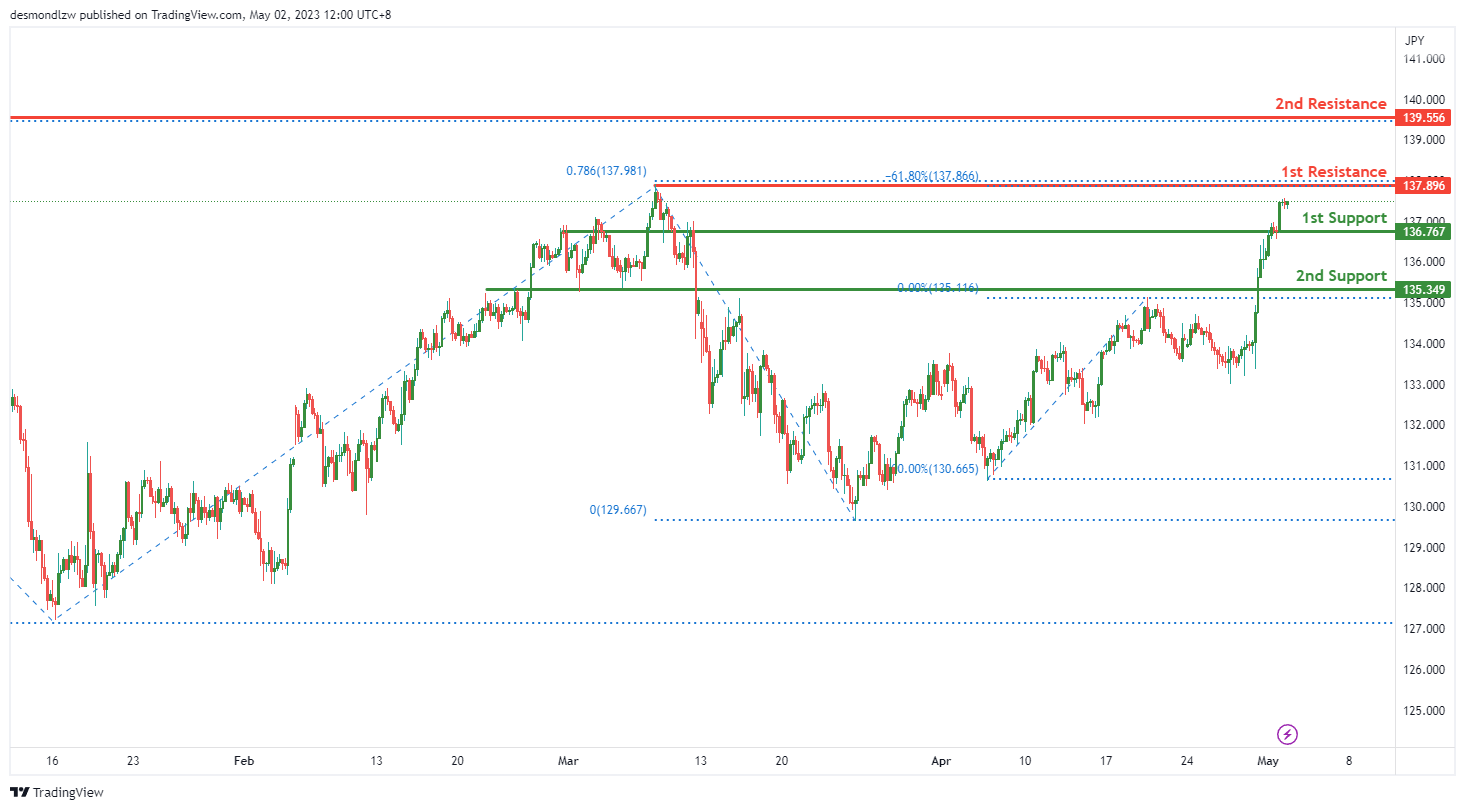
The USD/JPY chart is currently showing bearish momentum overall, with several factors contributing to this bearish momentum. The price could potentially make a bearish reaction off the 1st resistance level and drop to the 1st support level.
The 1st support level is at 136.76, which is a pullback support level. This level has been tested multiple times in the past and has held up as a strong support level for the USD/JPY chart.
If the price were to break below the 1st support level, it could potentially drop to the 2nd support level at 135.34. This level is also a pullback support level and has held up as a strong support level in the past.
On the other hand, the 1st resistance level is at 137.89, which is a swing high resistance level and coincides with a 78.60% Fibonacci projection. This level has been tested multiple times in the past and has held up as a strong resistance level for the USD/JPY chart.
If the price were to break above the 1st resistance level, it could potentially rise towards the 2nd resistance level at 139.55. This level is also a swing high resistance level and has held up as a strong resistance level in the past.
It’s worth noting that the USD/JPY chart is currently showing bearish momentum overall, with the potential for a bearish reaction off the 1st resistance level and a drop to the 1st
AUD/USD:
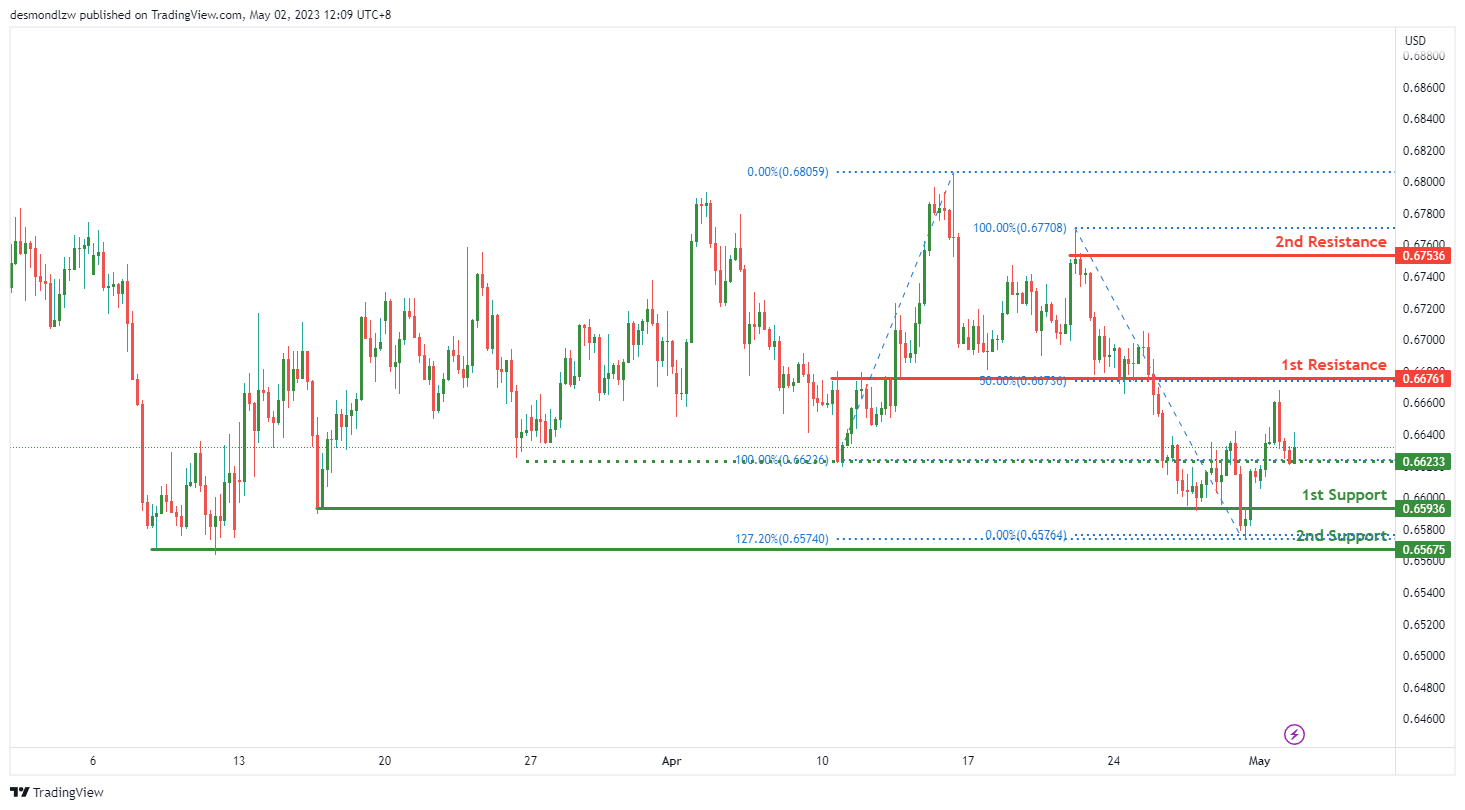
The AUD/USD chart is currently showing bullish momentum overall, with several factors contributing to this bullish momentum. The price could potentially continue its bullish trend towards the 1st resistance level.
The 1st support level is at 0.6593, which is a pullback support level. This level has held up as a strong support level in the past and could potentially provide a support level for the price as it continues its bullish trend.
If the price were to break below the 1st support level, it could potentially drop to the 2nd support level at 0.6567. This level is a multi-swing low support level and coincides with a 127.20% Fibonacci extension.
On the other hand, the 1st resistance level is at 0.6676, which is a pullback resistance level and coincides with a 50% Fibonacci retracement. This level has been tested multiple times in the past and has held up as a strong resistance level for the AUD/USD chart.
If the price were to break above the 1st resistance level, it could potentially rise towards the 2nd resistance level at 0.6753. This level is a swing high resistance level and has held up as a strong resistance level in the past.
It’s worth noting that there is an intermediate support level at 0.6623 between the current price and the 1st support level. If the price were to break below this intermediate support level, it could trigger a bearish acceleration towards the 1st support level.
NZD/USD:
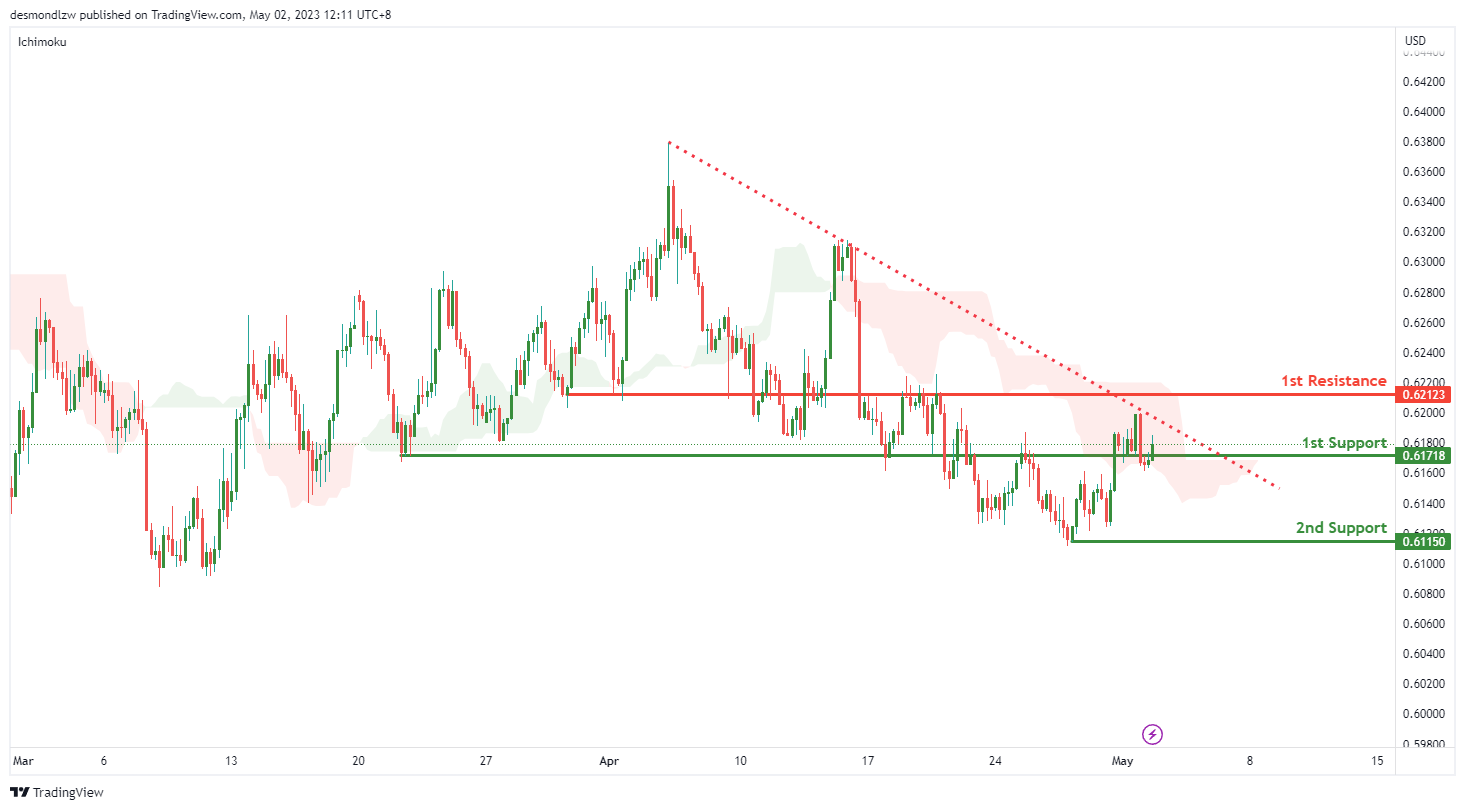
The NZD/USD chart is currently showing bearish momentum overall, with several factors contributing to this bearish momentum. The price could potentially make a bearish reaction off the 1st resistance level and drop to the 1st support level.
The 1st support level is at 0.6171, which is an overlap support level. This level has held up as a strong support level in the past and could potentially provide a support level for the price as it continues its bearish trend.
If the price were to break below the 1st support level, it could potentially drop to the 2nd support level at 0.6115. This level is a swing low support level and has held up as a strong support level in the past.
On the other hand, the 1st resistance level is at 0.6212, which is a pullback resistance level. This level has been tested multiple times in the past and has held up as a strong resistance level for the NZD/USD chart.
If the price were to break above the 1st resistance level, it could potentially rise towards higher resistance levels. However, given the current bearish momentum of the chart, it is more likely that the price will make a bearish reaction off the 1st resistance level and drop towards the 1st support level.
It’s worth noting that the NZD/USD chart is currently within the bearish Ichimoku cloud and below a major descending trend line. These factors contribute to the overall bearish momentum of the chart.
USD/CAD:
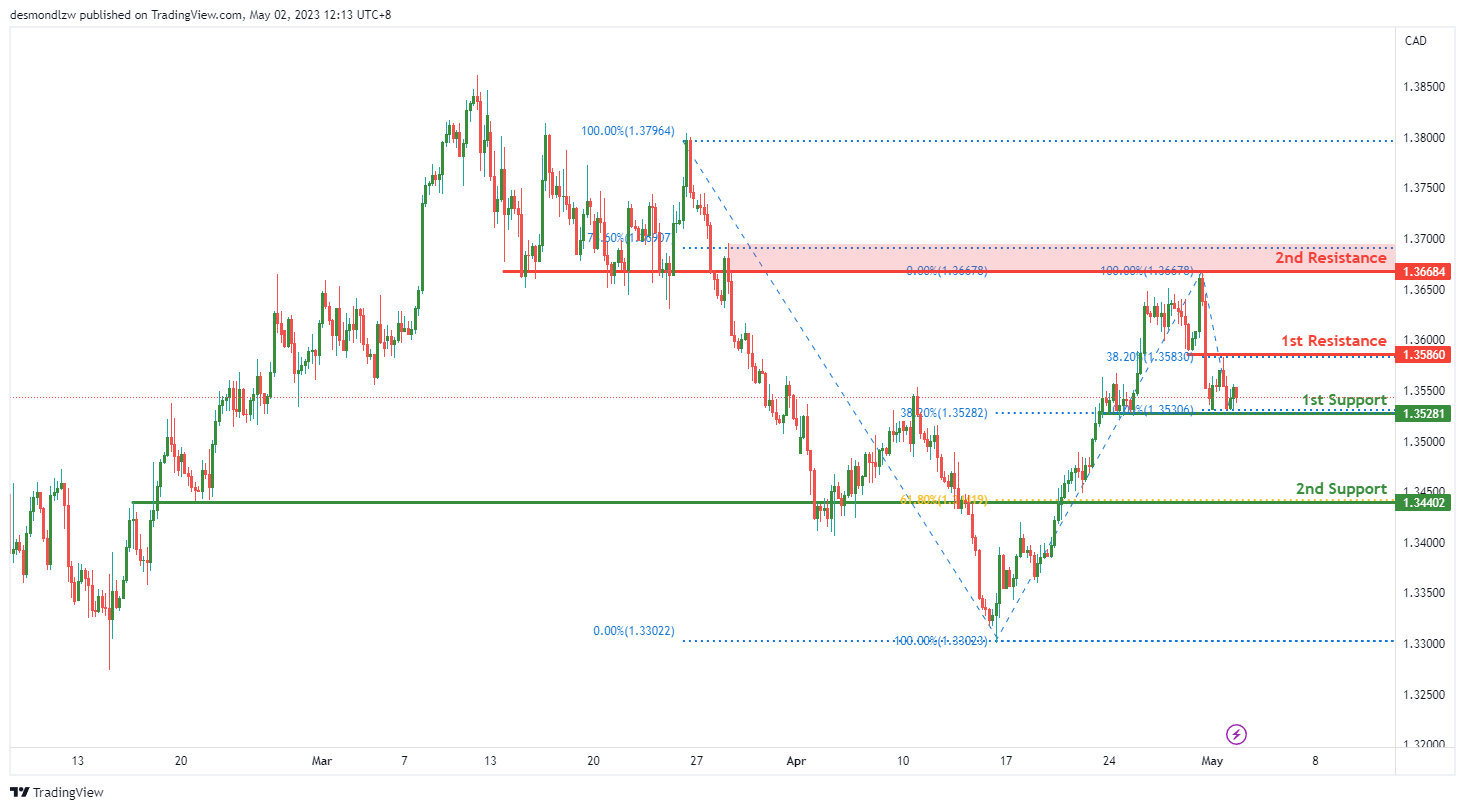
USD/CAD’s overall momentum is bullish as it shows potential for a bullish bounce off the 1st support and head towards the 1st resistance. The multi-swing low support at 1.3528, which also coincides with the 38.20% Fibonacci retracement level, is a good level to watch for a potential bullish bounce. The pullback support at 1.3440, which lines up with the 61.80% Fibonacci retracement level, could also provide a good level for buyers to step in if the price drops further.
On the upside, the 1st resistance at 1.3586, which coincides with the 38.20% Fibonacci retracement level, is a key level to watch for a potential bullish continuation towards the 2nd resistance at 1.3668. This overlap resistance level also lines up with the 78.60% Fibonacci retracement level.
DJ30:
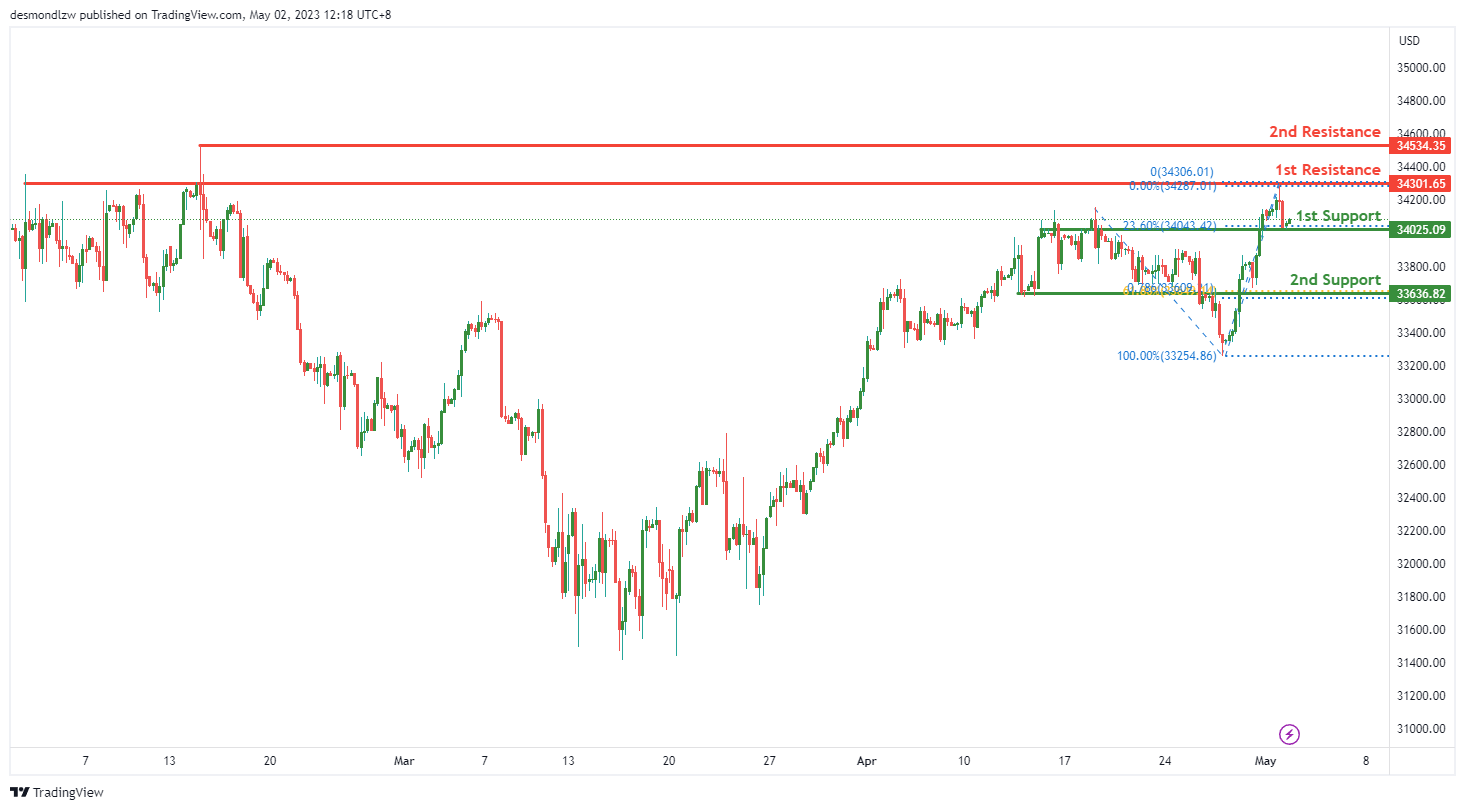
The DJ30 chart is showing strong bullish momentum, with prices bouncing off a key support level at 34025.09, suggesting that the index could potentially head towards the first resistance level at 34301.65. The momentum of the chart is bullish, which supports this view.
If the index were to break through the 1st resistance, it could potentially rise towards the 2nd resistance at 34534.35, which is a swing high resistance level. However, if the index fails to break through the 1st resistance, it could potentially bounce off this level and head back towards the 1st support at 34025.09.
The 1st support is a strong overlap support level with a 23.60% Fibonacci retracement lining up with it. Meanwhile, the 2nd support is also a good support level with a 61.80% Fibonacci retracement lining up with it. If prices were to break through the 1st support, they could potentially drop to the 2nd support.
GER30:
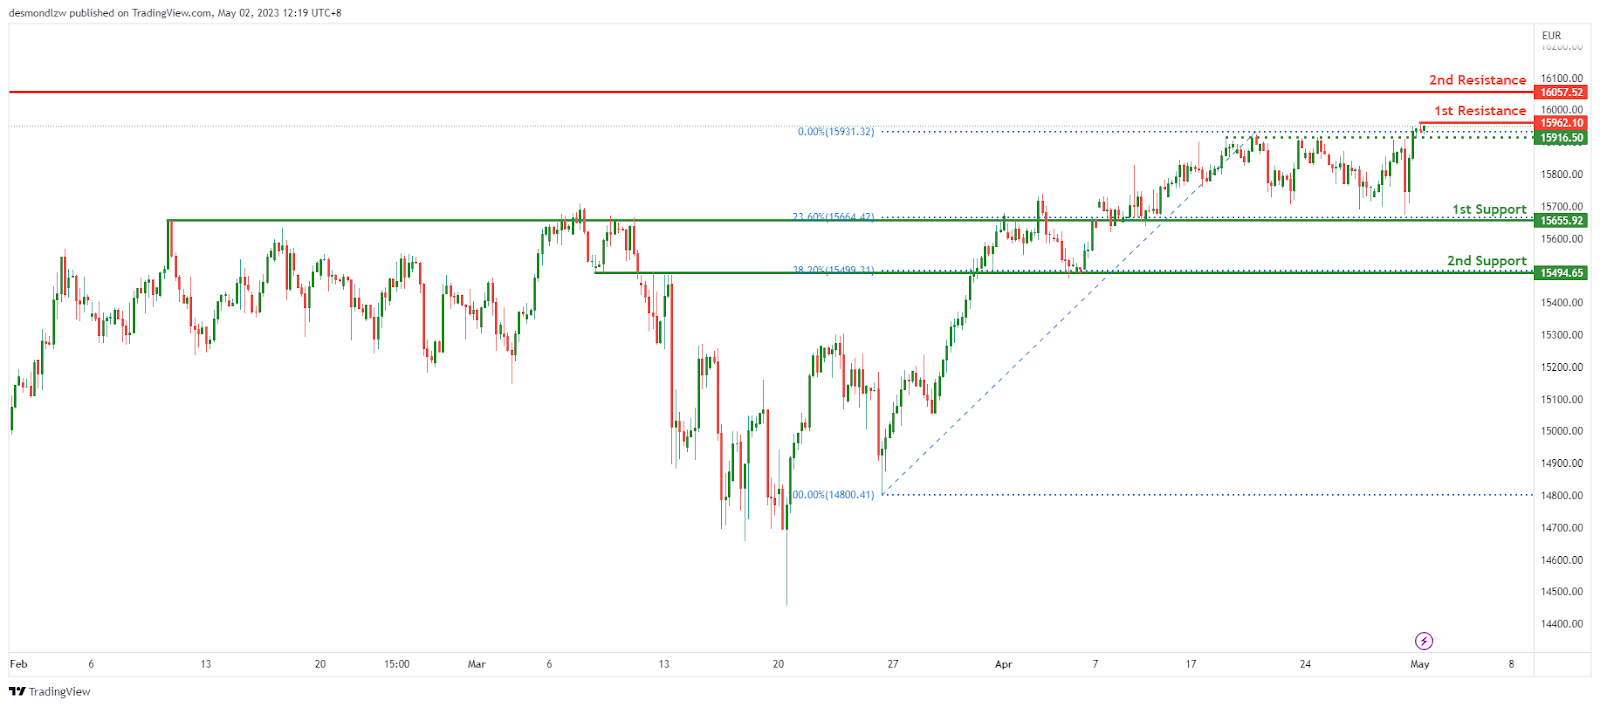
The German stock market, represented by the GER30 instrument, has been showing bullish momentum. The price is expected to potentially make a bullish break through of the first resistance and rise to the second resistance level.
The first support level is at 15655.92, and it is an overlap support level that has been established in the past. Additionally, it is at the 23.60% Fibonacci retracement level, which makes it an important level to watch. The second support level is at 15494.65, and it is also an overlap support level. This level is at the 38.20% Fibonacci retracement level, which provides further support to this level.
The first resistance level is at 15962.10, and it is a swing high resistance level. This level has been tested in the past and is expected to be a significant resistance level. The second resistance level is at 16057.52, and it is also a swing high resistance level. This level is expected to be even stronger than the first resistance level.
In addition to these support and resistance levels, there is an intermediate support level at 15916.50, which is a pullback support level. This level is expected to provide additional support in case the price retraces from the first resistance level.
BTC/USD:
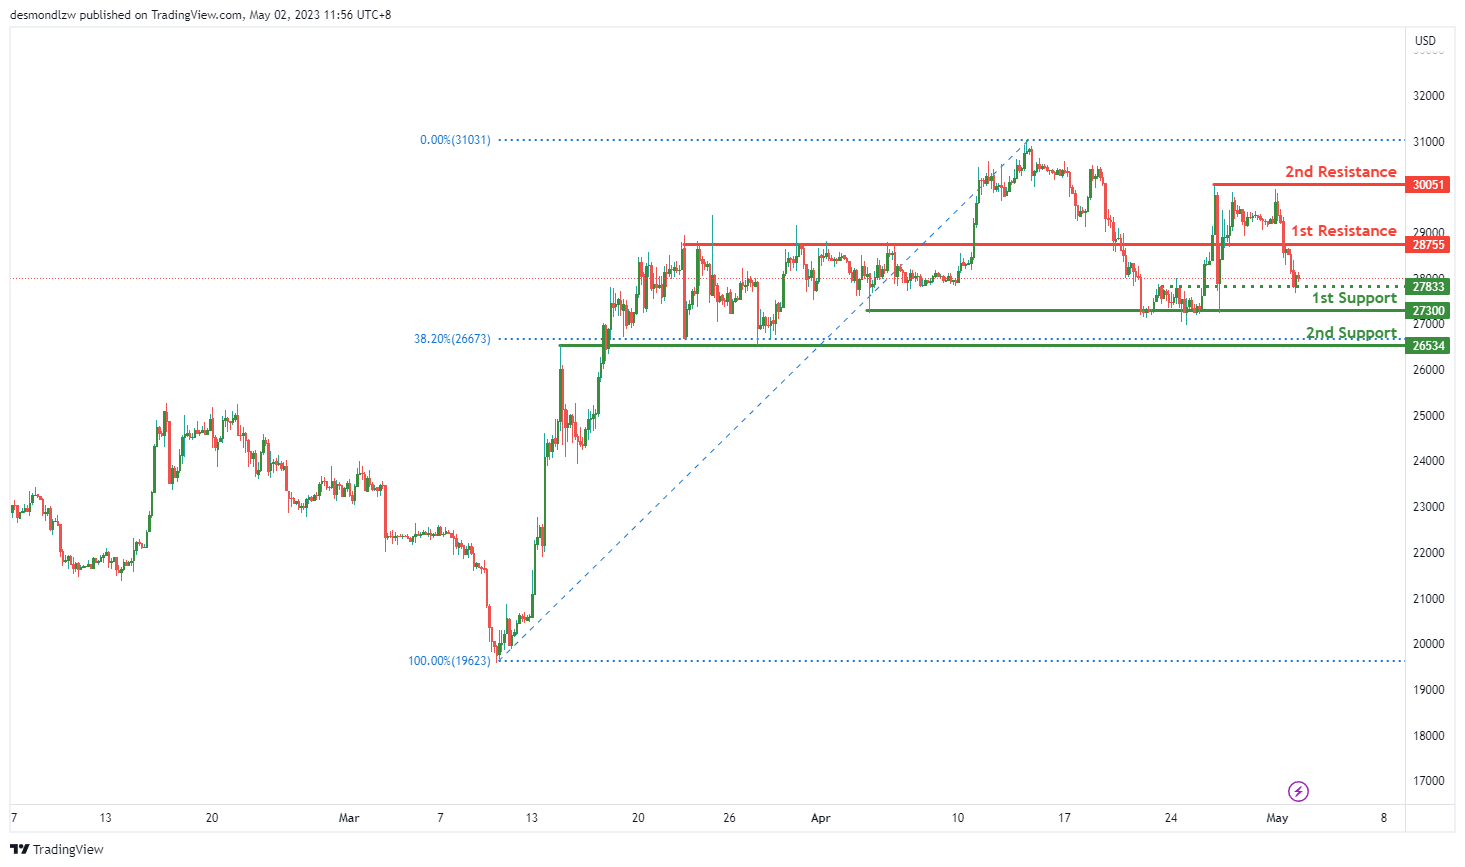
The cryptocurrency market has been experiencing some bearish momentum lately, and the BTC/USD pair is no exception. The overall momentum of the chart for BTC/USD is currently bearish, with potential for a bearish continuation towards the 1st support level.
The 1st support level for BTC/USD is at 27300, and it is a multi-swing low support level. This support level has held several times in the past, making it a strong area of support.
The 2nd support level for BTC/USD is at 26534, and it is an overlap support level. This level also coincides with the 38.20% Fibonacci retracement level, making it a key area of support to watch.
On the resistance side, the 1st resistance level is at 28755, and it is an overlap resistance level. If BTC/USD manages to break through this level, it could potentially rise towards the 2nd resistance level.
The 2nd resistance level for BTC/USD is at 30051, and it is a multi-swing high resistance level. This level has acted as a strong area of resistance in the past and could potentially do so again.
In between the 1st support and 1st resistance levels, there is an intermediate support level at 27833, which is also an overlap support level. If the price manages to break below the 1st support level, this intermediate support level could potentially act as a temporary area of support.
US500
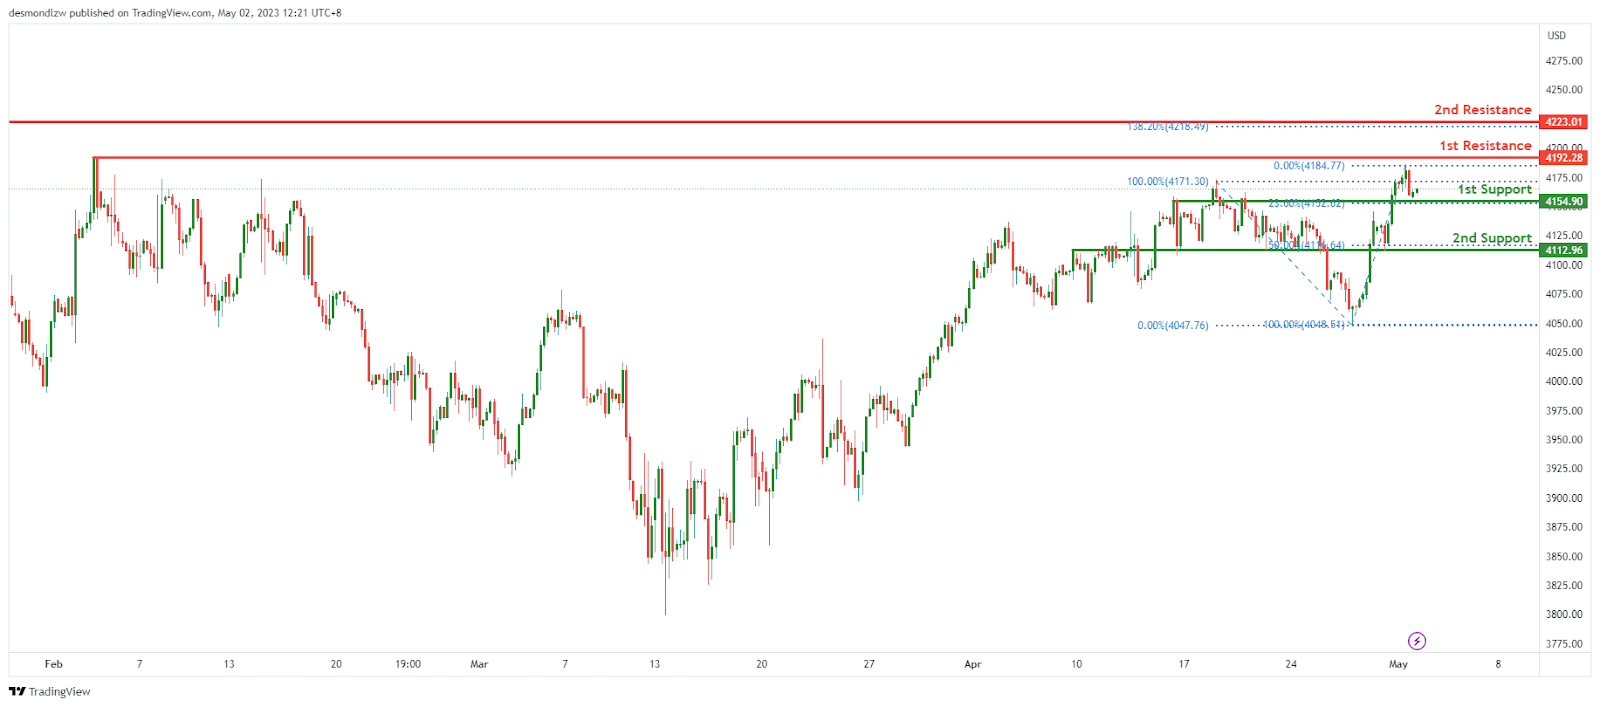
The US500 has been showing a strong bullish momentum, as the overall bias on the chart indicates. The price could potentially continue to rise towards the first resistance level, as it has already broken through previous levels of resistance.
Currently, the price is at the 1st support level of 4145.90, which is an overlap support and also marks the 23.60% Fibonacci retracement level. This support level suggests that buyers may enter the market, leading to a potential bounce in price. If the price bounces off this level, it could rise towards the first resistance at 4192.28, which is a swing high resistance level.
If the price breaks through the first resistance level, it could continue to rise towards the second resistance level of 4223.01. This resistance level also marks the 138.20% Fibonacci extension level, which further reinforces the potential for the price to rise towards this level.
On the downside, the 2nd support level at 4112.96 is another key support level to watch, as it is an overlap support and also marks the 50% Fibonacci retracement level. A break below this level could indicate a bearish reversal and potential further downside towards the 1st support level of 4145.90.
ETH/USD:
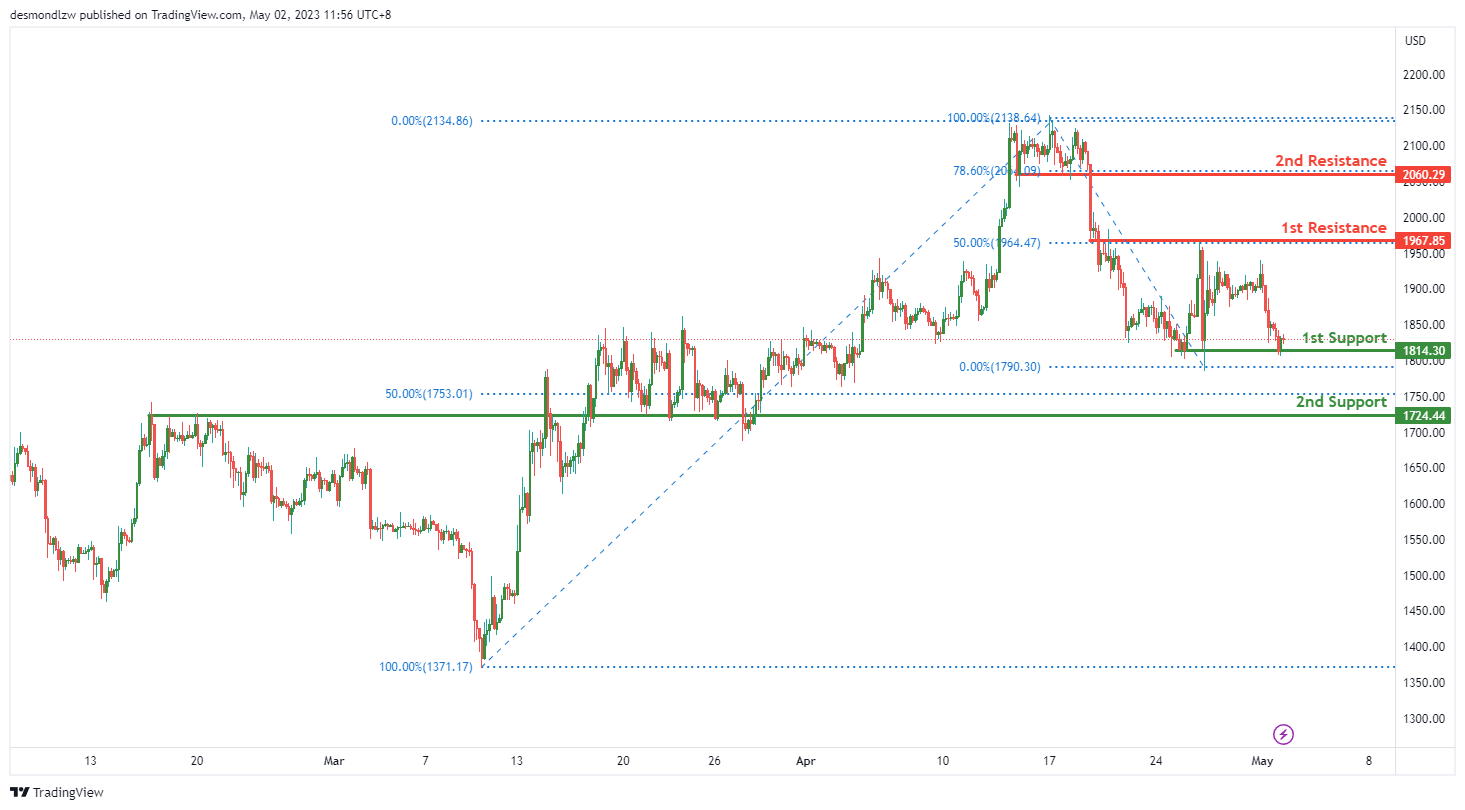
The overall momentum of ETH/USD appears to be bearish. The price is currently hovering below key resistance levels, suggesting that there may be further downside potential.
In the short term, price could potentially make a bearish break off the first support level at 1814.30 and drop towards the second support level at 1724.44. The first support level is a multi-swing low support level, which indicates that it has been tested multiple times in the past and could provide a strong level of support. The second support level is an overlap support level and coincides with the 50% Fibonacci retracement level, which adds further confluence to this level as a potential support zone.
On the upside, the first resistance level at 1967.85 is an overlap resistance level and also coincides with the 50% Fibonacci retracement level. The second resistance level at 2060.29 is a pullback resistance level and coincides with the 78.6% Fibonacci retracement level. A break above these resistance levels could potentially signal a reversal of the current bearish trend.
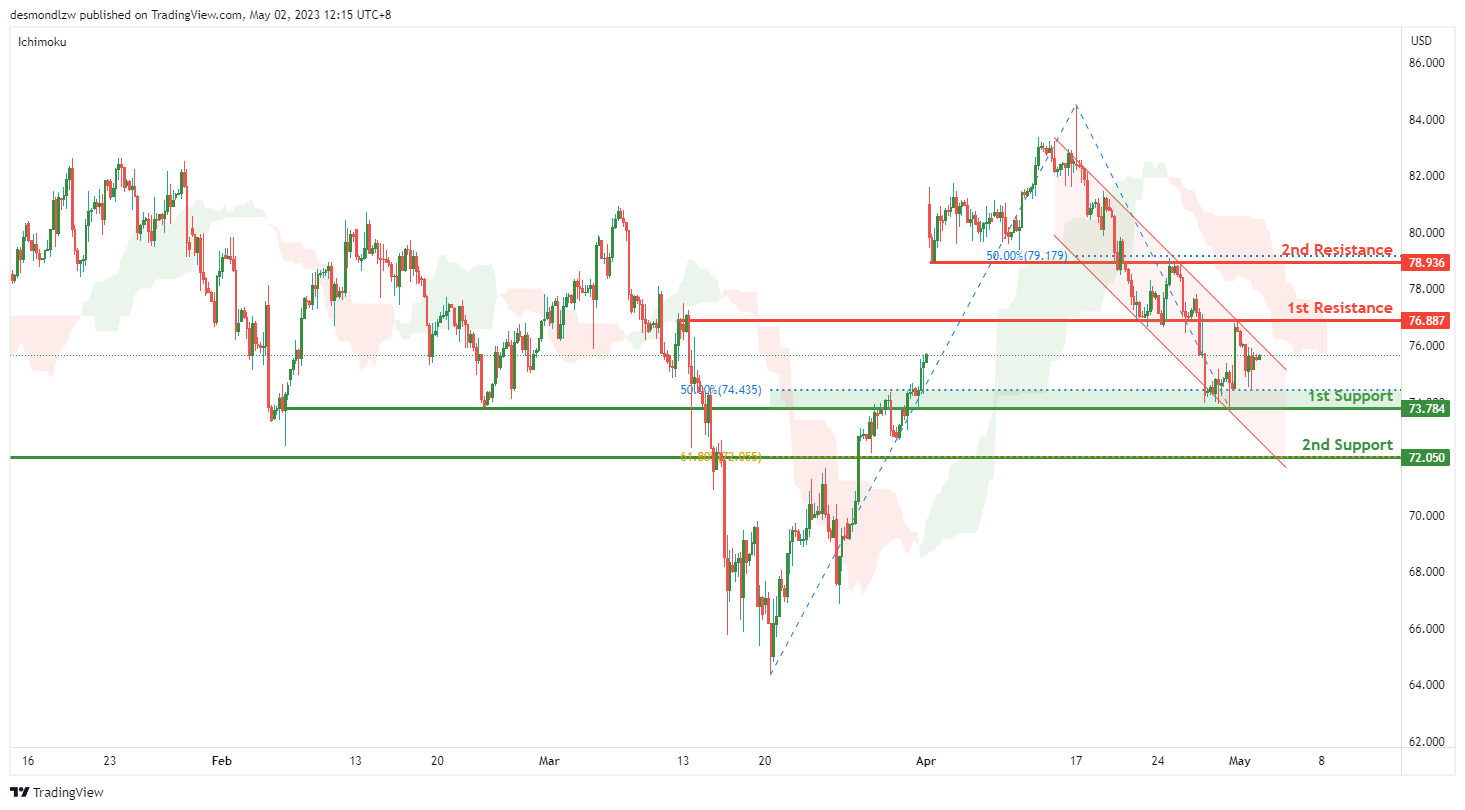
WTI/USD:
In terms of the WTI chart, the overall momentum is currently bearish. This is mainly due to the fact that the price is below the bearish Ichimoku cloud and it is also in a bearish descending channel.
Looking at potential price movements, we could potentially see a continuation of the bearish trend towards the first support level at 73.78. This level is an overlap support and lines up with a 50% Fibonacci retracement which makes it a strong level of support. If the price bounces off this level, it could potentially rise towards the first resistance level at 76.88 which is also an overlap resistance.
However, if the price were to break the 1st support level, the next level it could drop to is the 2nd support level at 72.05. This level is a swing low support and lines up with a 61.80% Fibonacci retracement, making it another strong level of support.
On the other hand, if the price were to break above the 1st resistance level, it could potentially rise towards the 2nd resistance level at 78.93. This level is an overlap resistance and lines up with a 50% Fibonacci retracement, making it another strong level of resistance.
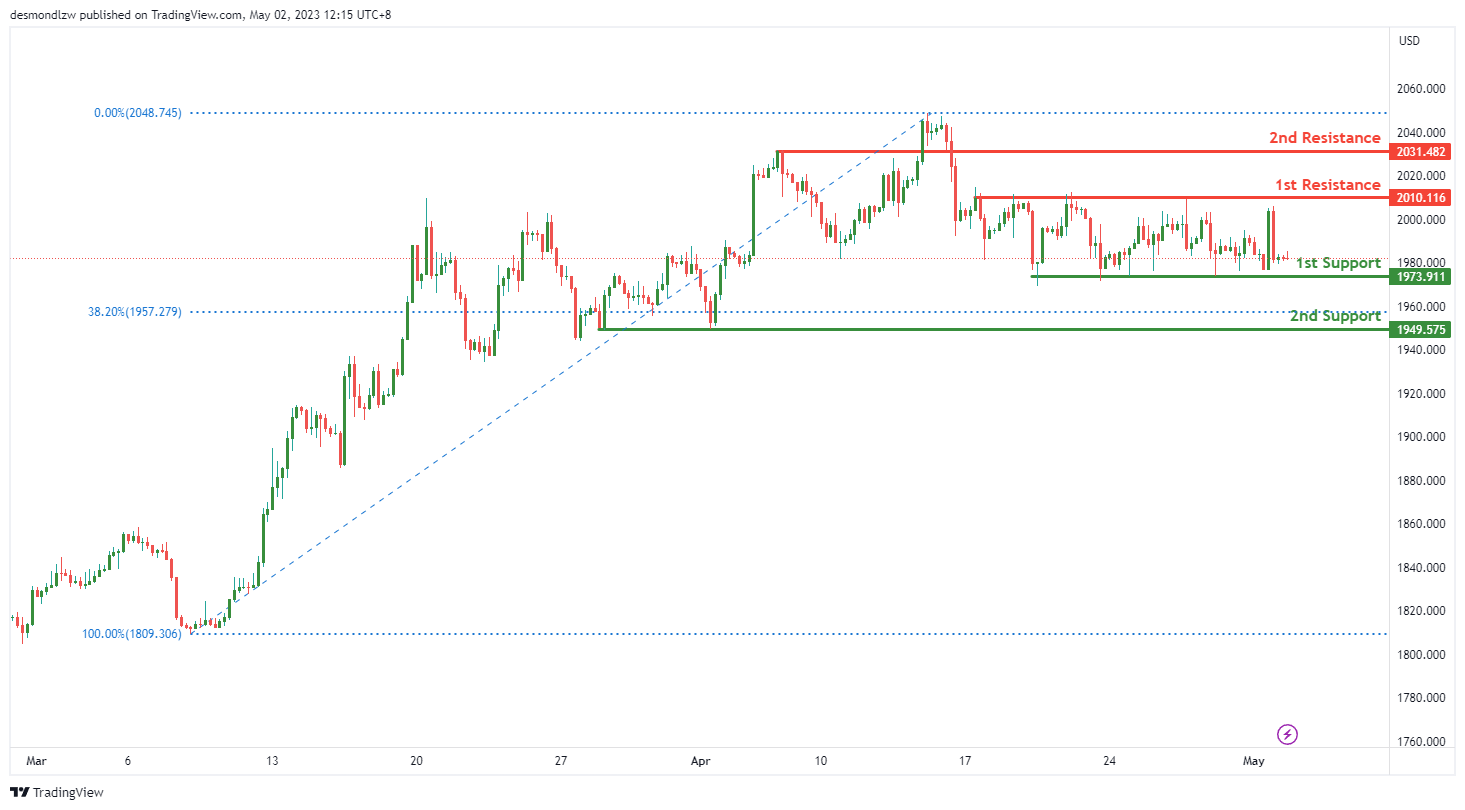
XAU/USD (GOLD):
The current momentum of XAU/USD is neutral, meaning that there is no clear trend direction. The price is expected to fluctuate between the 1st resistance and 1st support levels in the short term.
The 1st support level is located at 1973.91, which is a multi-swing low support level. This level has held as support in the past, making it a significant level to watch. In addition, it coincides with a 23.6% Fibonacci retracement, adding further confluence to the support level.
If the price were to break below this support level, the next support level to watch would be the 2nd support at 1949.57. This level is also a multi-swing low support level and coincides with a 38.2% Fibonacci retracement, making it a strong level of support.
On the resistance side, the 1st resistance level is at 2010.11. This level is a swing high resistance, and if the price were to break above it, it could potentially trigger a bullish acceleration towards the 2nd resistance level at 2031.48. This level is a pullback resistance, meaning that it is an area where sellers may enter the market, making it an important level to


