
DXY:
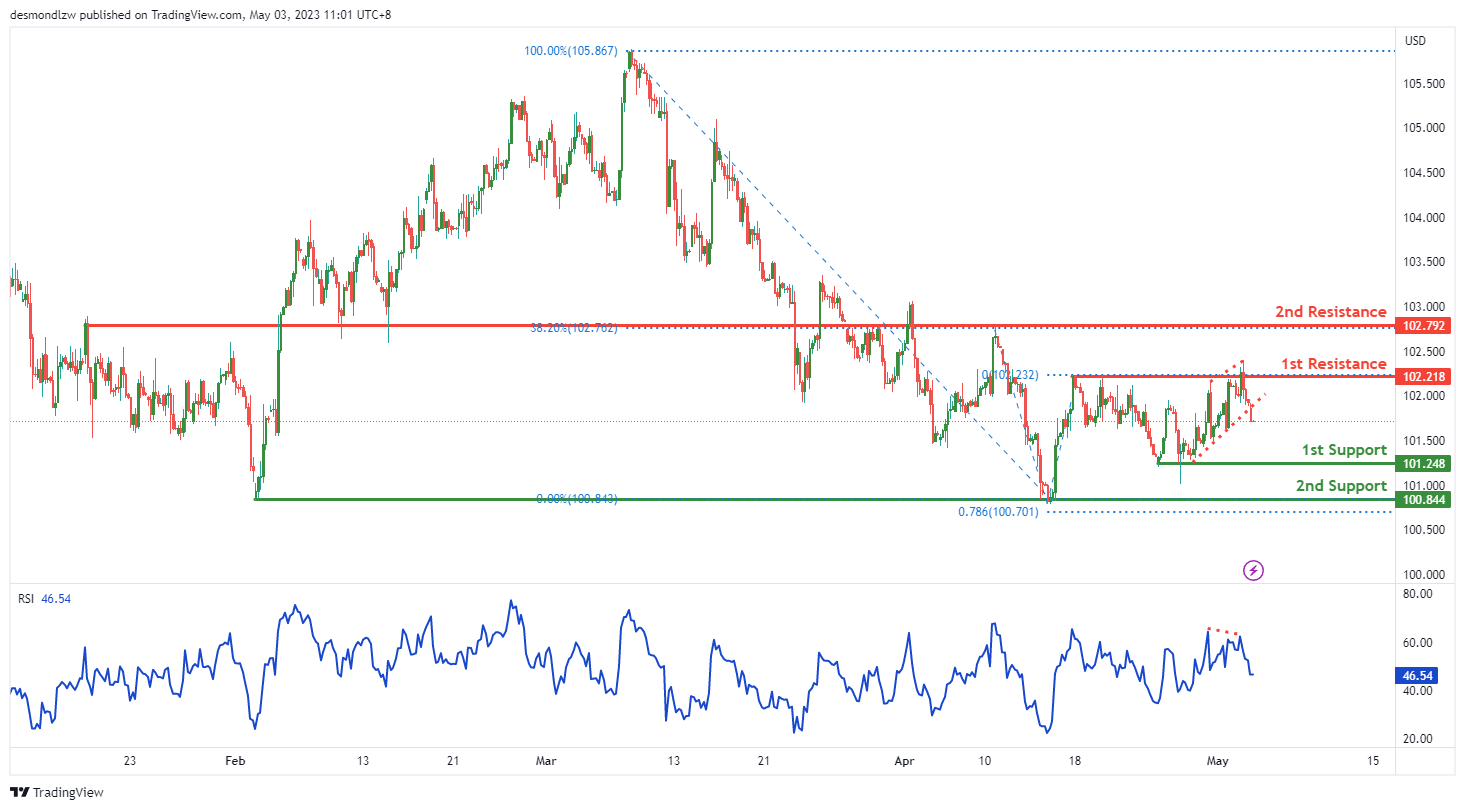
The DXY chart is currently showing strong bearish momentum with high confidence, triggered by a break below an ascending support line. The price is expected to potentially continue its bearish trend towards the 1st support level at 101.24, which is a multi-swing low support level.
If the price were to break below the 1st support level, the next support level to watch would be the 2nd support at 100.84. This level is also a multi-swing low support level and coincides with a 78.60% Fibonacci projection, making it a strong level of support.
On the resistance side, the 1st resistance level is at 102.21. This level is a swing high resistance, and if the price were to break above it, it could potentially lead to a bullish reversal towards the 2nd resistance level at 102.79, which is an overlap resistance level.
Additionally, the RSI is displaying bearish divergence versus price, indicating that a rapid decline in price is likely.
EUR/USD:
The EUR/USD chart currently has a bearish momentum with the potential for a bearish reaction off the 1st resistance level and a subsequent drop to the 1st support level. The 1st support level is located at 1.0946, which is a multi-swing low support level and has held up as a strong support level in the past. Additionally, the 2nd support level is located at 1.0911, which is an overlap support level and adds further confluence to the support zone.
On the resistance side, the 1st resistance level is at 1.1037, which is an overlap resistance level and coincides with a 61.80% Fibonacci retracement. This level has also been tested multiple times in the past and has held up as a strong resistance level for the EUR/USD chart. If the price were to break above this resistance level, it could potentially rise towards the 2nd resistance level at 1.1098. This level is a swing high resistance level and has also held up as a strong resistance level in the past.
It’s worth noting that the overall momentum of the chart is currently bearish, indicating a potential for further price drops. Furthermore, if the price were to break below the 1st support level, it could potentially drop to the 2nd support level at 1.0911. Conversely, if the price were to break above the 1st resistance level, it could potentially trigger a bullish acceleration towards the 2nd resistance level at 1.1098.

GBP/USD:
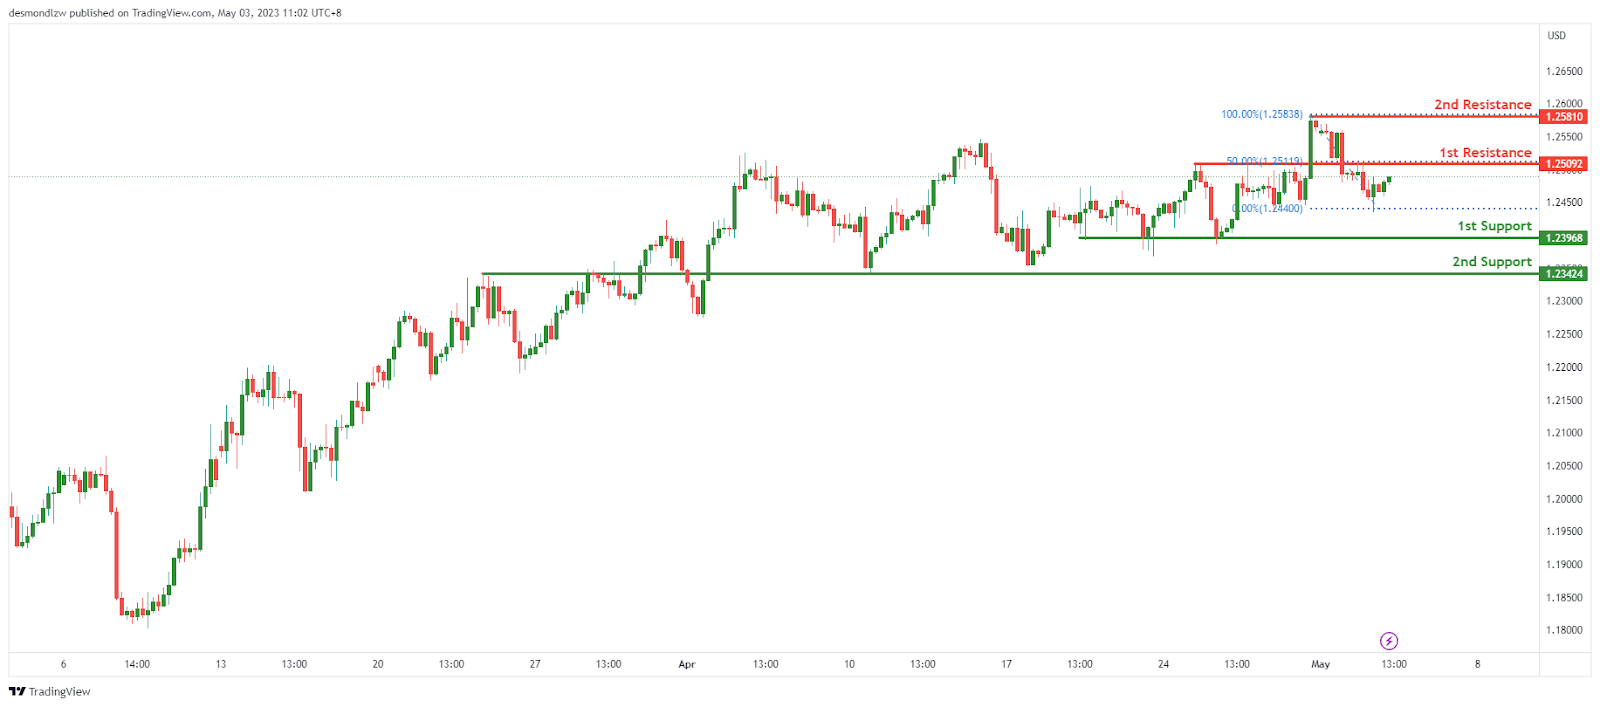
The GBP/USD chart shows a bearish overall momentum, with the potential for a bearish reaction off the 1st resistance level and a drop towards the 1st support level.
The 1st support level is at 1.2396, which is a multi-swing low support level. This level has held as support in the past, making it a significant level to watch.
If the price were to break below the 1st support level, the next support level to watch would be the 2nd support level at 1.2342. This level is also an overlap support level, adding further confluence to its significance.
On the resistance side, the 1st resistance level is at 1.2509. This level is an overlap resistance level and coincides with a 50% Fibonacci retracement, making it a strong level of resistance to watch.
If the price were to break above the 1st resistance level, it could potentially rise towards the 2nd resistance level at 1.2581. This level is a swing high resistance level and has held up as a strong resistance level in the past.
It is important to note that the overall momentum of the GBP/USD chart is bearish, which suggests that the potential for a bearish reaction off the 1st resistance level and a drop towards the 1st support level is more likely.
USD/CHF:
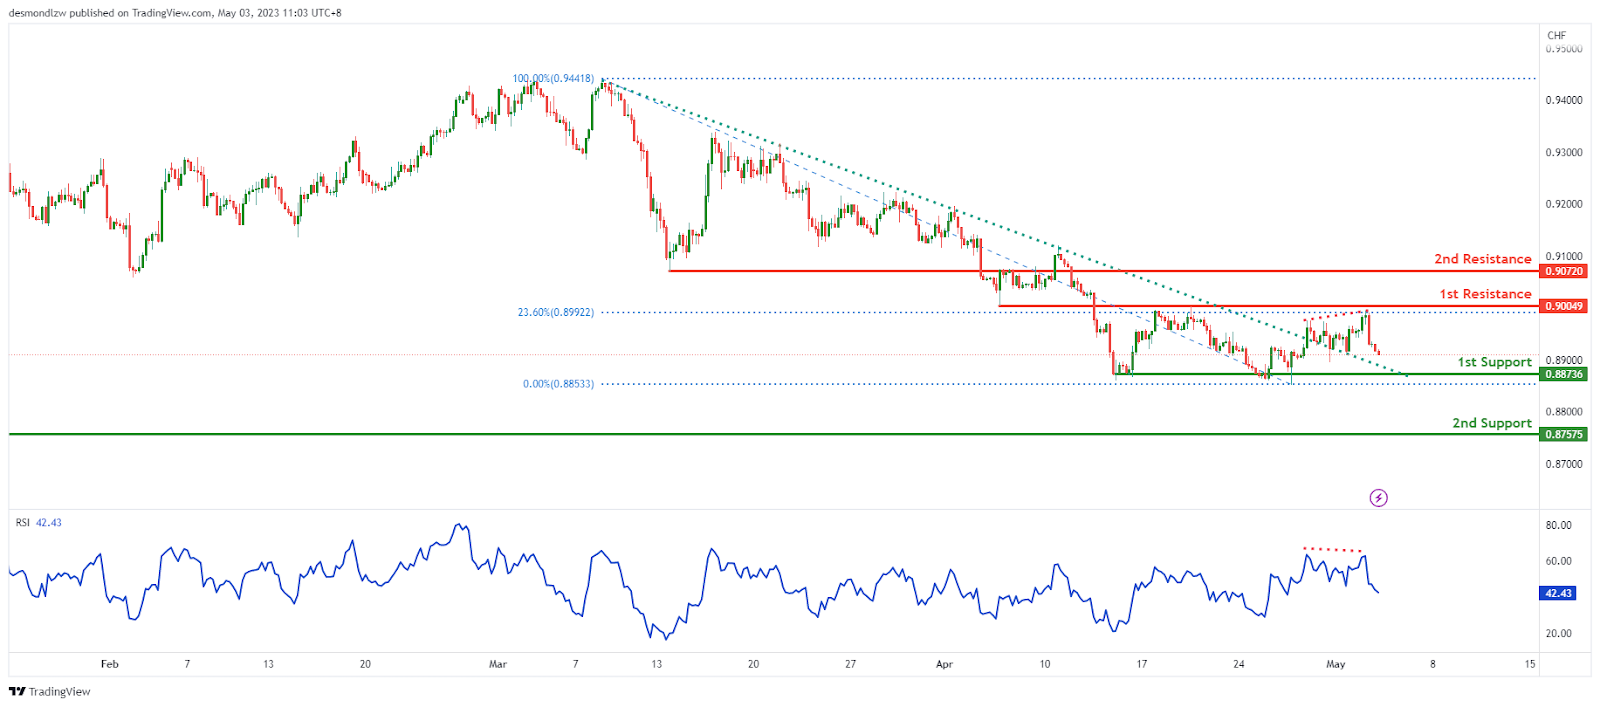
The USD/CHF chart currently displays a strong bearish momentum overall, with the potential for a continuation towards the 1st support. The 1st support level is at 0.8936, a multi-swing low support level that has held as support in the past. If the price were to break below this level, it could potentially drop to the 2nd support level at 0.8757, a swing low support level that is a significant level to watch.
On the resistance side, the 1st resistance level is at 0.9004, an overlap resistance level that coincides with a 23.60% Fibonacci retracement. If the price were to break above this level, it could potentially rise towards the 2nd resistance level at 0.9072, which is a pullback resistance level and an important level to watch.
Additionally, RSI is displaying bearish divergence versus price, suggesting that there could potentially be a rapid decline in price.
USD/JPY:
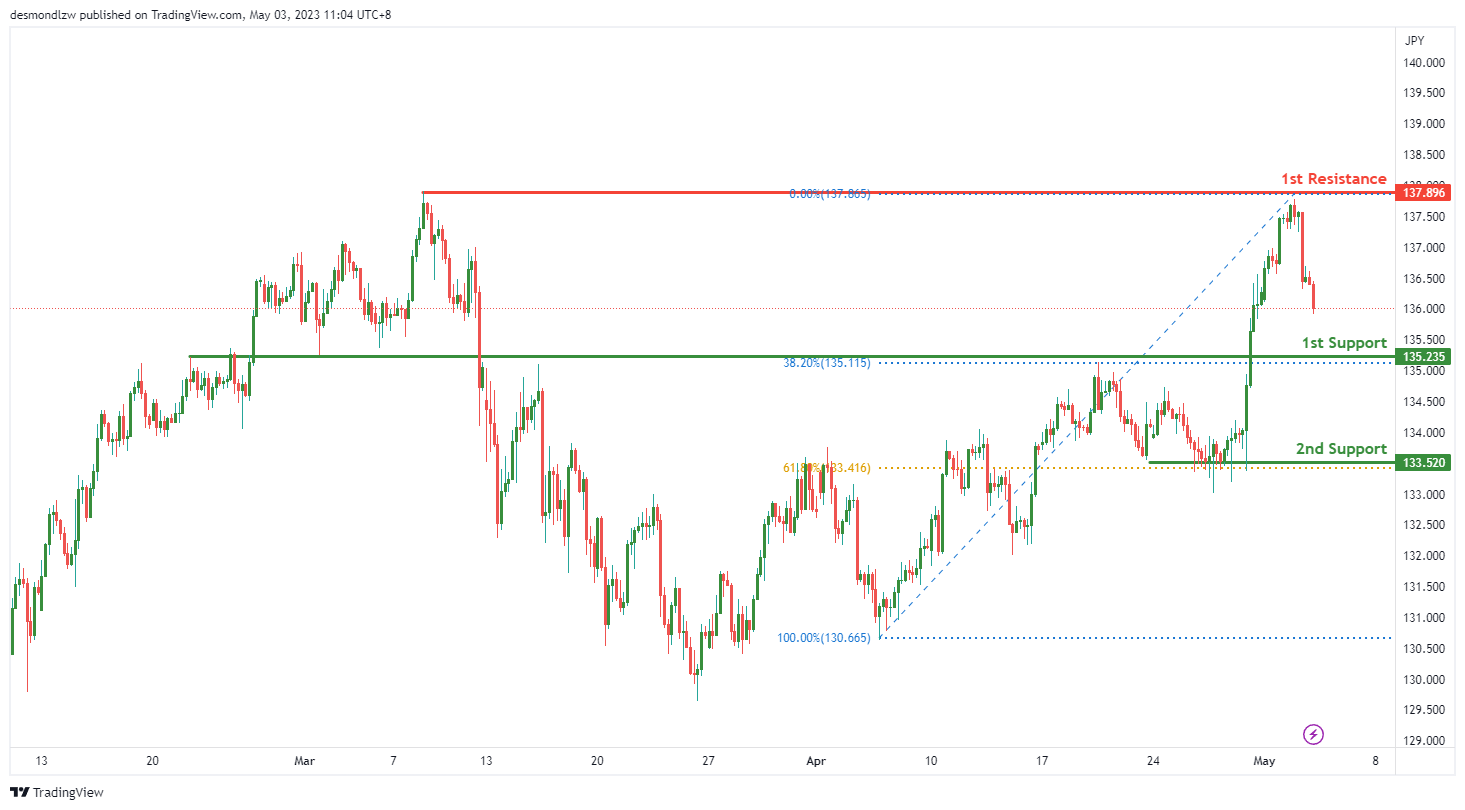
The USD/JPY chart is currently showing bearish momentum overall. There is a potential for a bearish continuation towards the 1st support level for the USD/JPY pair. The 1st support level is at 135.23 and is a pullback support level, with a 38.20% Fibonacci retracement lining up with it.
If the price were to break below this support level, it could potentially drop to the 2nd support level at 133.52. This level is a multi-swing low support level and coincides with a 61.80% Fibonacci retracement, making it a strong level of support.
On the resistance side, the 1st resistance level is at 137.89, which is a multi-swing high resistance level. It has held up as a strong resistance level for the USD/JPY chart.
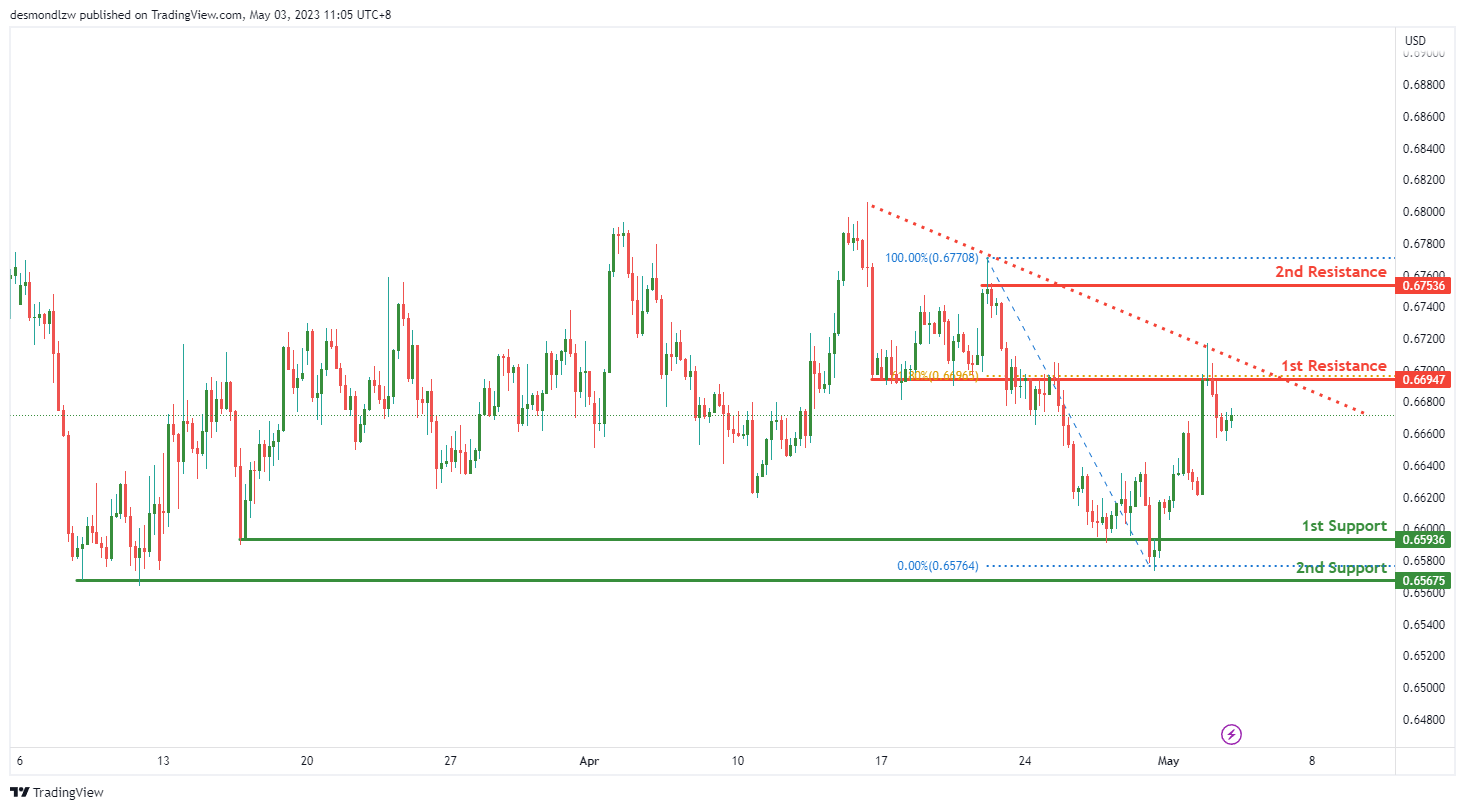
AUD/USD:
The AUD/USD chart currently shows a strong bearish momentum, as the price is below a major descending trend line, indicating that further downside movement may be expected. There is a potential for a bearish continuation towards the first support level at 0.6593, which is a pullback support level that coincides with a 61.80% Fibonacci retracement, making it a significant level to watch. If the price were to break below this level, the next support to watch would be the second support at 0.6567, which is also a multi-swing low support level.
On the resistance side, the first resistance level is at 0.6694, which is an overlap resistance level. If the price were to break above this level, it could potentially move towards the second resistance level at 0.6753, which is a swing high resistance level.
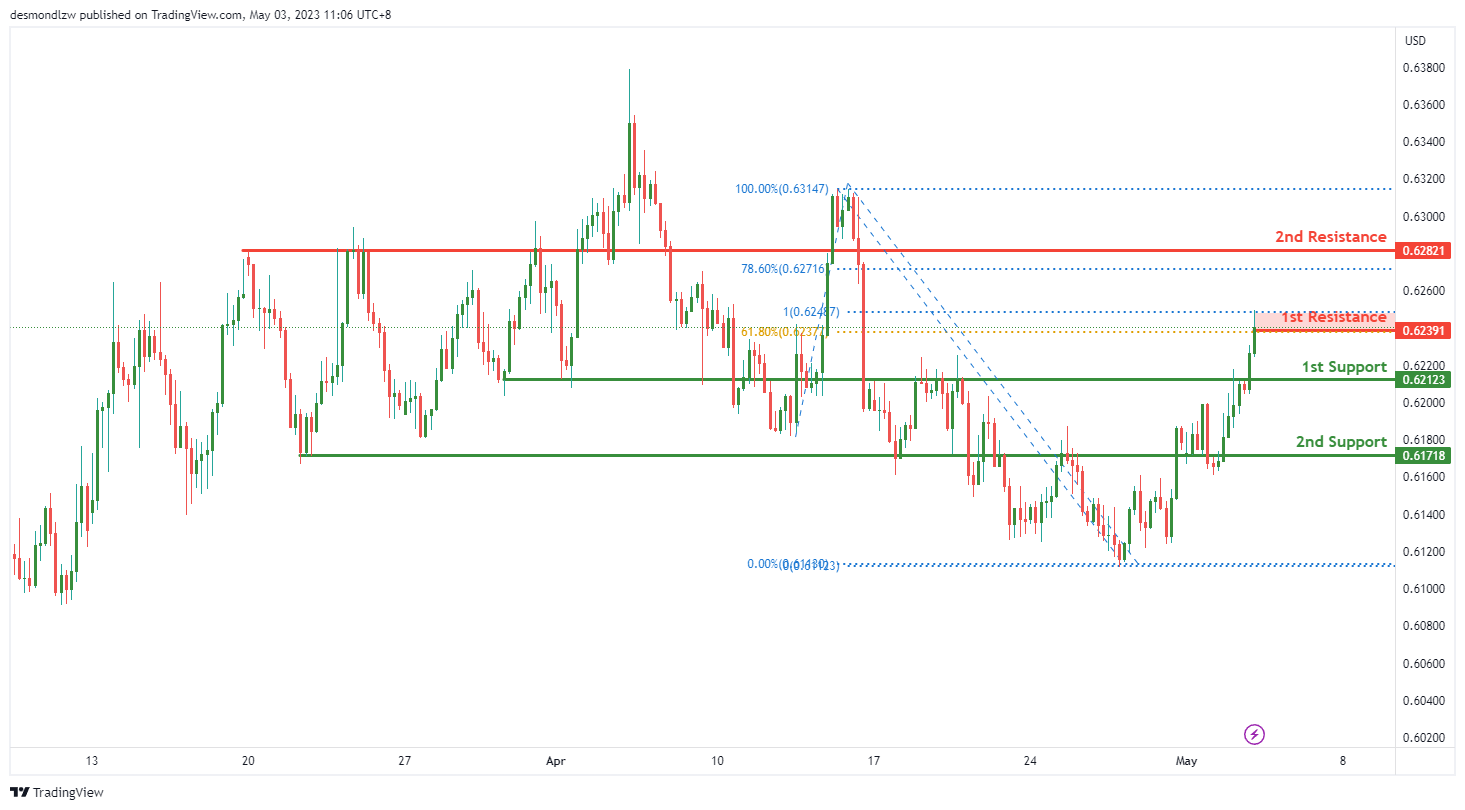
NZD/USD:
The NZD/USD chart shows strong bearish momentum and is currently testing a key resistance level at 0.6239 that lines up with the Fibonacci confluence of 61.8% Fibonacci retracement and 100% Fibonacci projection. If the price reacts bearishly off this level, it could potentially drop towards the 1st support at 0.6212, which is a pullback support level. If the price breaks through the 1st support level, it may continue its bearish movement towards the 2nd support level at 0.6171, which is also a pullback support level.
On the other hand, if the price manages to break through the 1st resistance level at 0.6239, it may continue its bullish movement towards the 2nd resistance level at 0.6282, which is a pullback resistance level and coincides with the 78.60% Fibonacci retracement. However, given the overall bearish momentum of the chart, this scenario seems less likely.
In summary, the NZD/USD chart is displaying bearish momentum, and there is potential for a bearish reaction off the 1st resistance level at 0.6239, with the 1st support level at 0.6212 being the potential target. The 2nd support level at 0.6171 could also act as a support level if the price breaks through the 1st support level. On the upside, the 1st and 2nd resistance levels at 0.6239 and 0.6282, respectively, may act as resistance levels if the price manages to break through the 1st resistance level.
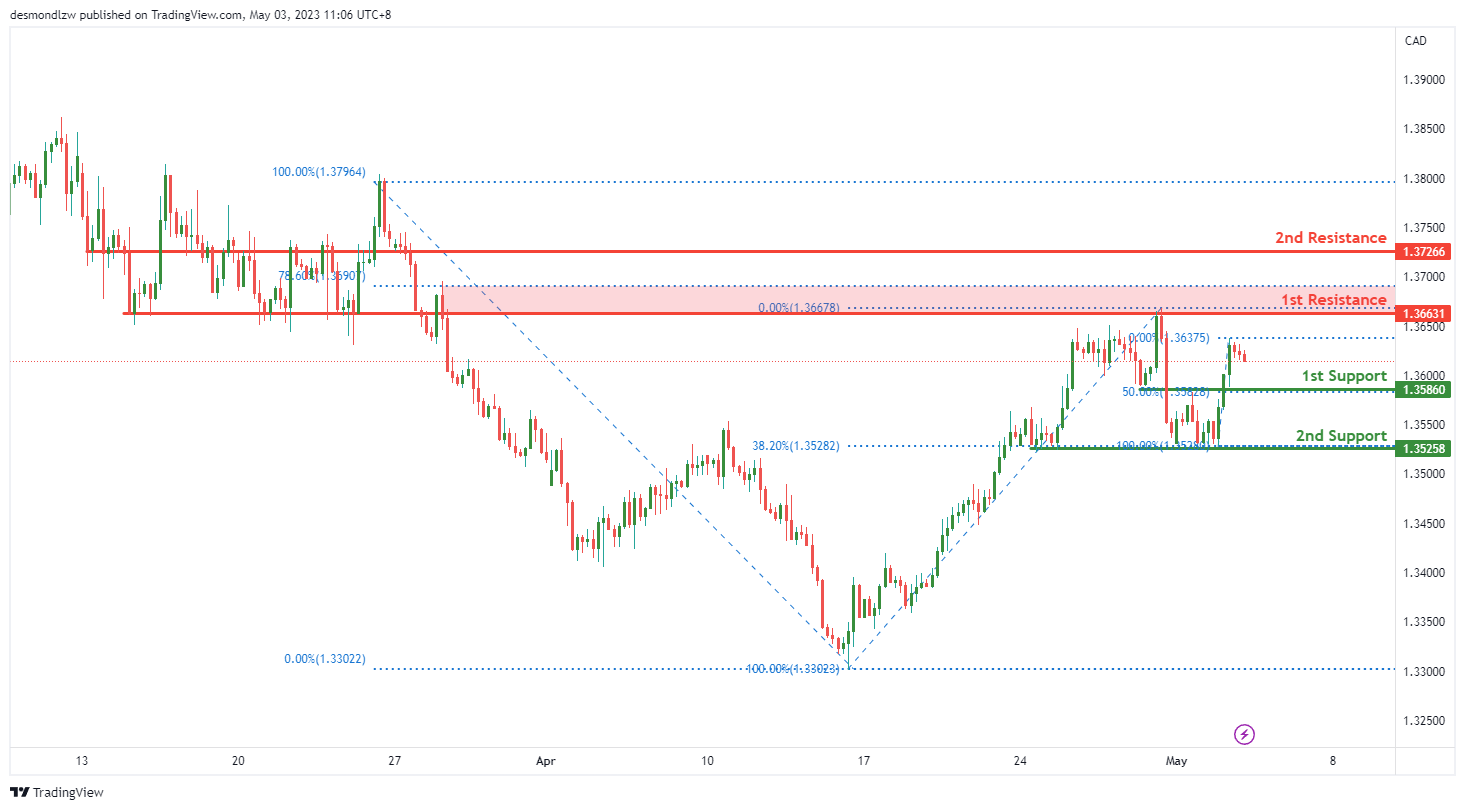
USD/CAD:
The USD/CAD chart, the overall momentum is currently bullish. Price may potentially make a bullish bounce off the first support level at 1.3586, which is an overlap support level and coincides with the 50% Fibonacci retracement. The second support level at 1.3525 is also a good support level as it is a multi-swing low support level and lines up with the 38.20% Fibonacci retracement.
On the other hand, the first resistance level at 1.3663 is a good level to watch as it is an overlap resistance level and coincides with the 78.60% Fibonacci retracement. If price manages to break through this level, it could potentially head towards the second resistance level at 1.3726, which is a pullback resistance level.
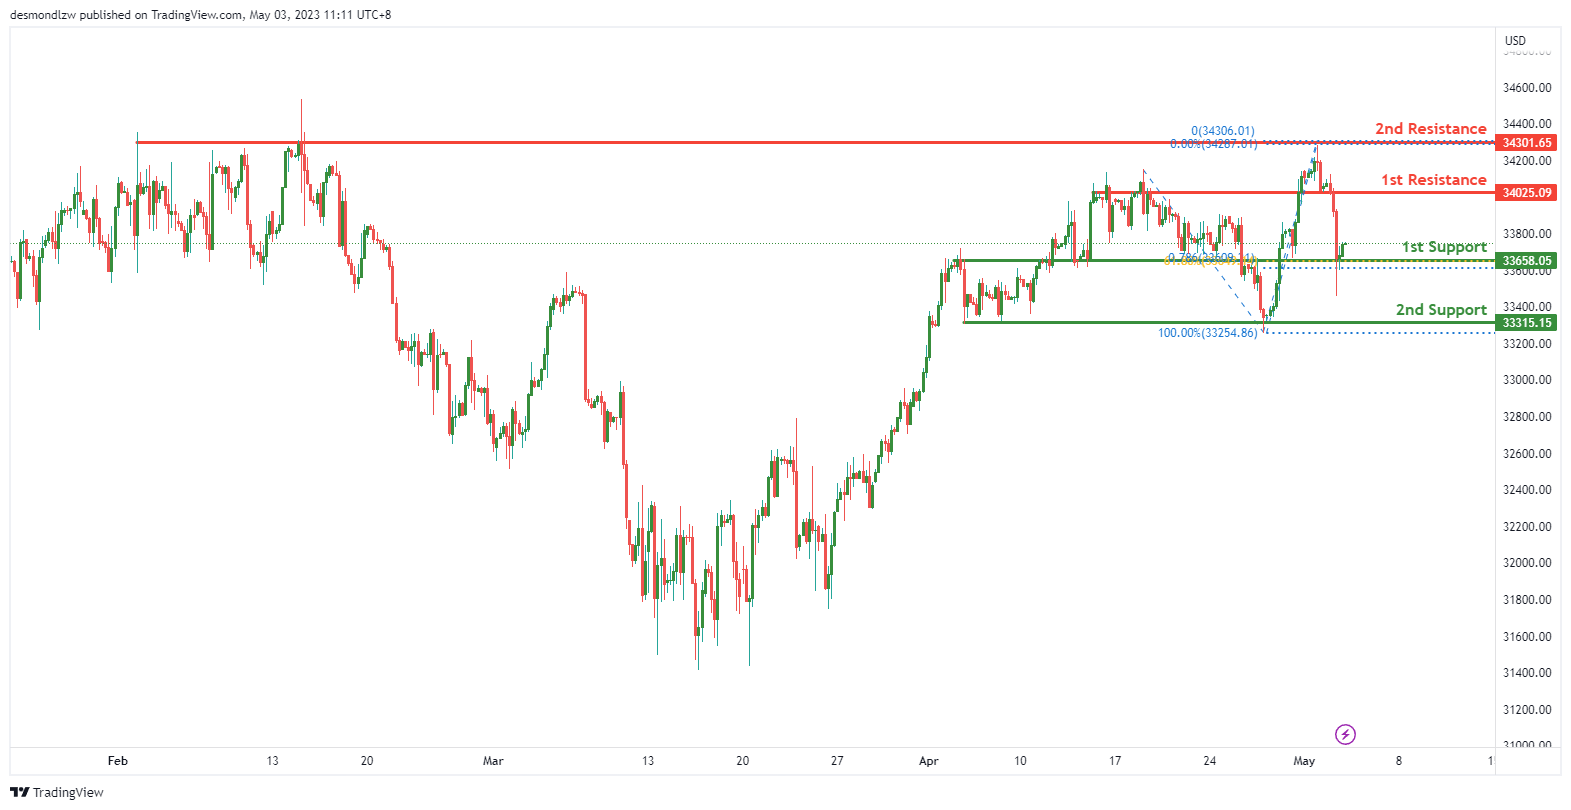
DJ30:
The DJ30 chart is currently displaying bullish momentum, and there is potential for a bullish bounce off the 1st support level at 33658.05, which is an overlap support and also coincides with the 61.80% Fibonacci retracement. If the price manages to bounce from this level, it may head towards the 1st resistance at 34025.09, which is a pullback resistance level.
If the price continues its bullish movement, it may potentially break through the 1st resistance and head towards the 2nd resistance level at 34301.65, which is a multi-swing high resistance level. However, if the price fails to bounce from the 1st support level, it may potentially drop towards the 2nd support level at 33315.15, which is a multi-swing low support level.
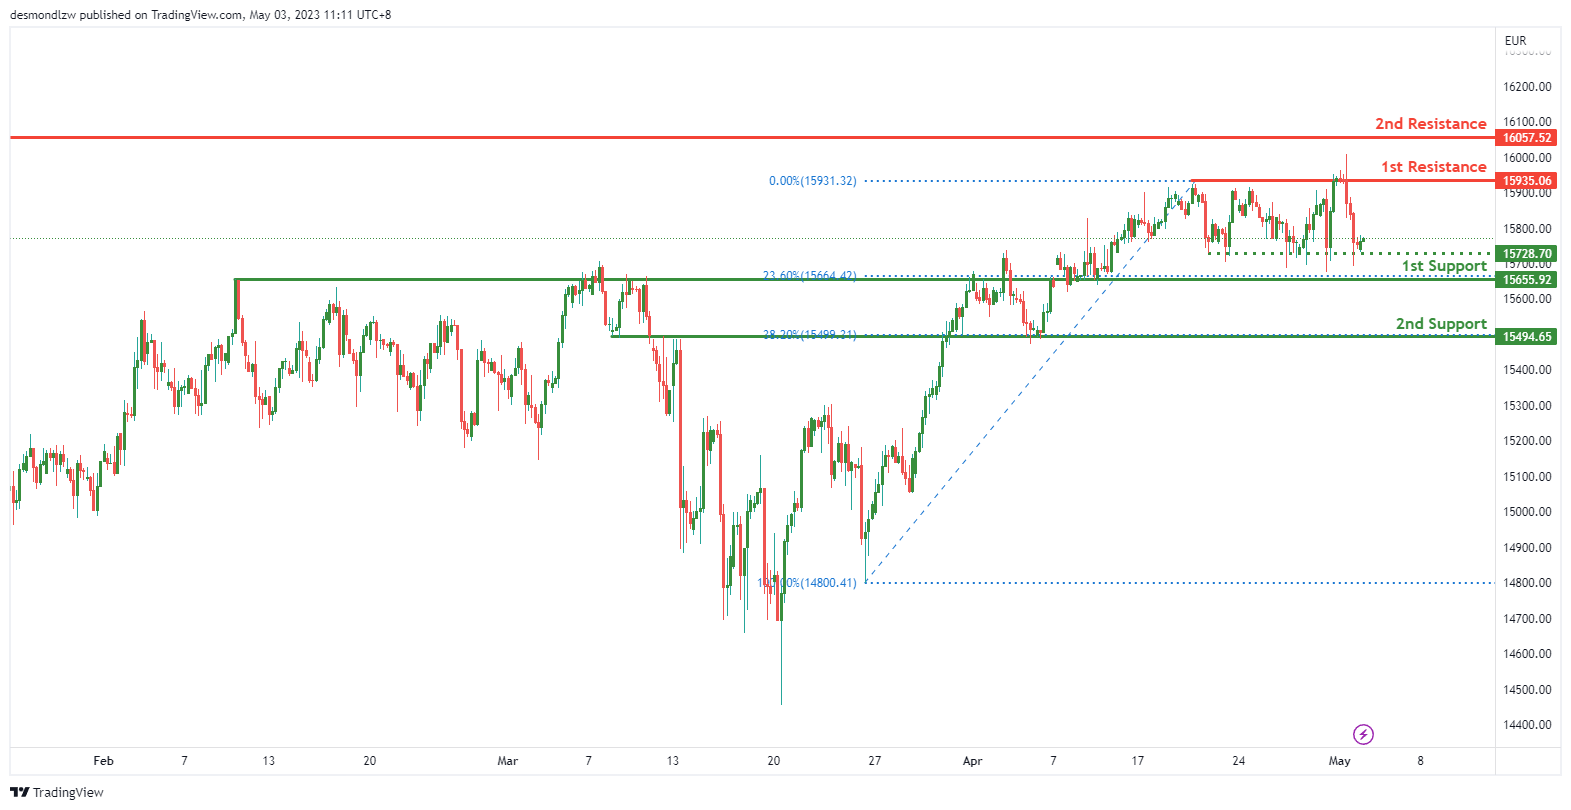
GER30:
The GER30 chart is displaying bullish momentum, and price could potentially make a bullish bounce off the 1st support level at 15655.92, which is an overlap support level and coincides with the 23.60% Fibonacci retracement. If the price bounces from this level, it may head towards the 1st resistance level at 15935.06, which is a multi-swing high resistance level.
In the event that the price breaks through the 1st support level, it may drop towards the 2nd support level at 15494.65, which is also an overlap support level and coincides with the 38.20% Fibonacci retracement.
Additionally, there is an intermediate support level at 15728.70, which is a multi-swing low support level. This level may act as support if the price breaks through the 1st support level.
On the upside, the 2nd resistance level at 16057.52 may act as a resistance level if the price manages to break through the 1st resistance level.
BTC/USD:
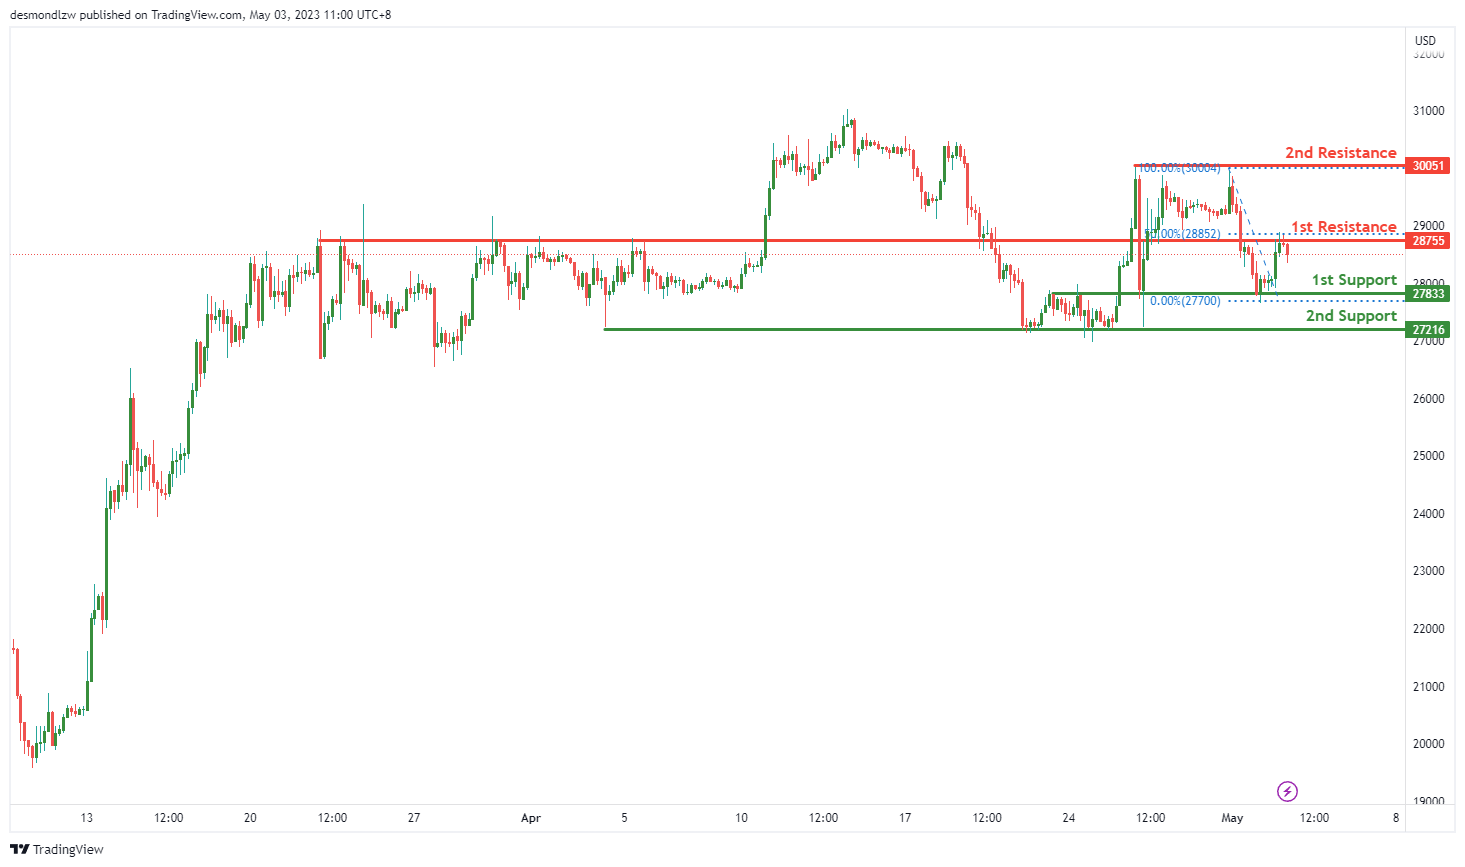
The BTC/USD chart shows a strong bearish momentum, and it’s currently testing a key resistance level at 28755 that lines up with the 50% Fibonacci retracement and is also an overlap resistance level. If the price reacts bearishly off this level, it could potentially drop towards the 1st support at 27833, which is an overlap support level. If the price breaks through the 1st support level, it may continue its bearish movement towards the 2nd support level at 27216, which is also a multi-swing low support level.
On the other hand, if the price manages to break through the 1st resistance level at 28755, it may continue its bullish movement towards the 2nd resistance level at 30051, which is a multi-swing high resistance level. However, given the overall bearish momentum of the chart, this scenario seems less likely.
In summary, the BTC/USD chart is displaying bearish momentum and there is potential for a bearish reaction off the 1st resistance level at 28755, with the 1st support level at 27833 being the potential target. The 2nd support level at 27216 could also act as a support level if the price breaks through the 1st support level. On the upside, the 1st and 2nd resistance levels at 28755 and 30051, respectively, may act as resistance levels if the price manages to break through the 1st resistance level.
US500
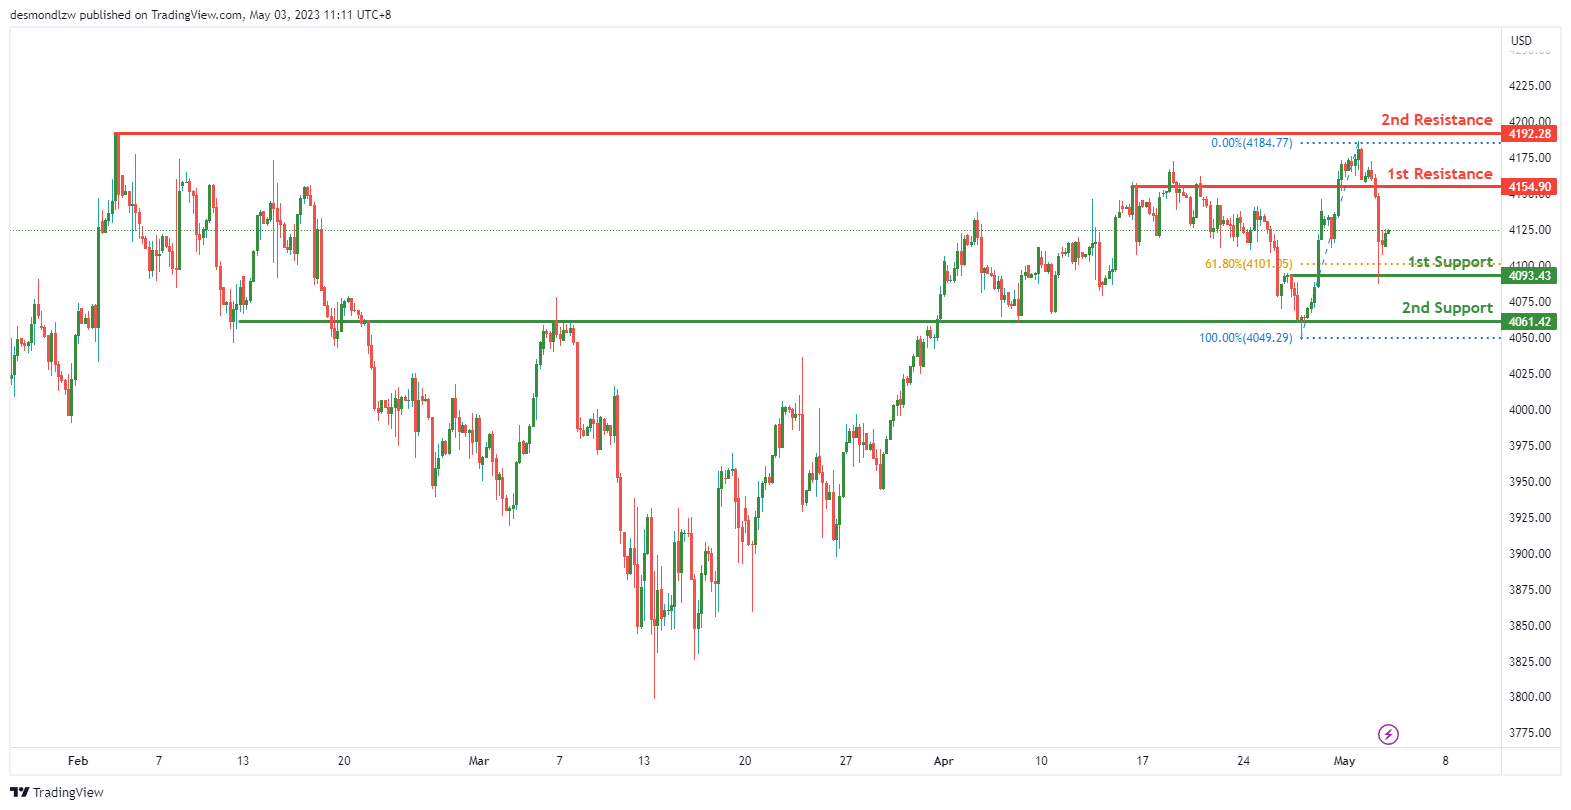
The US500 chart is displaying bullish momentum, with potential for a bullish continuation towards the 1st resistance level at 4145.90. The 1st support level at 4093.43 is a strong overlap support level and also lines up with the 61.80% Fibonacci retracement. If price were to bounce from this level, it could continue its bullish movement towards the 1st resistance level. The 2nd support level at 4061.42 is also an overlap support level.
On the upside, the 1st resistance level at 4145.90 is a pullback resistance level, and if price manages to break through it, it may continue towards the 2nd resistance level at 4192.28, which is a multi-swing high resistance level.
Overall, the US500 chart is displaying bullish momentum, and the potential for a bullish continuation towards the 1st resistance level at 4145.90. The 1st support level at 4093.43 and 2nd support level at 4061.42 may act as support levels if the price drops. The 1st and 2nd resistance levels at 4145.90 and 4192.28, respectively, may act as resistance levels if the price manages to break through the 1st resistance level.
ETH/USD:
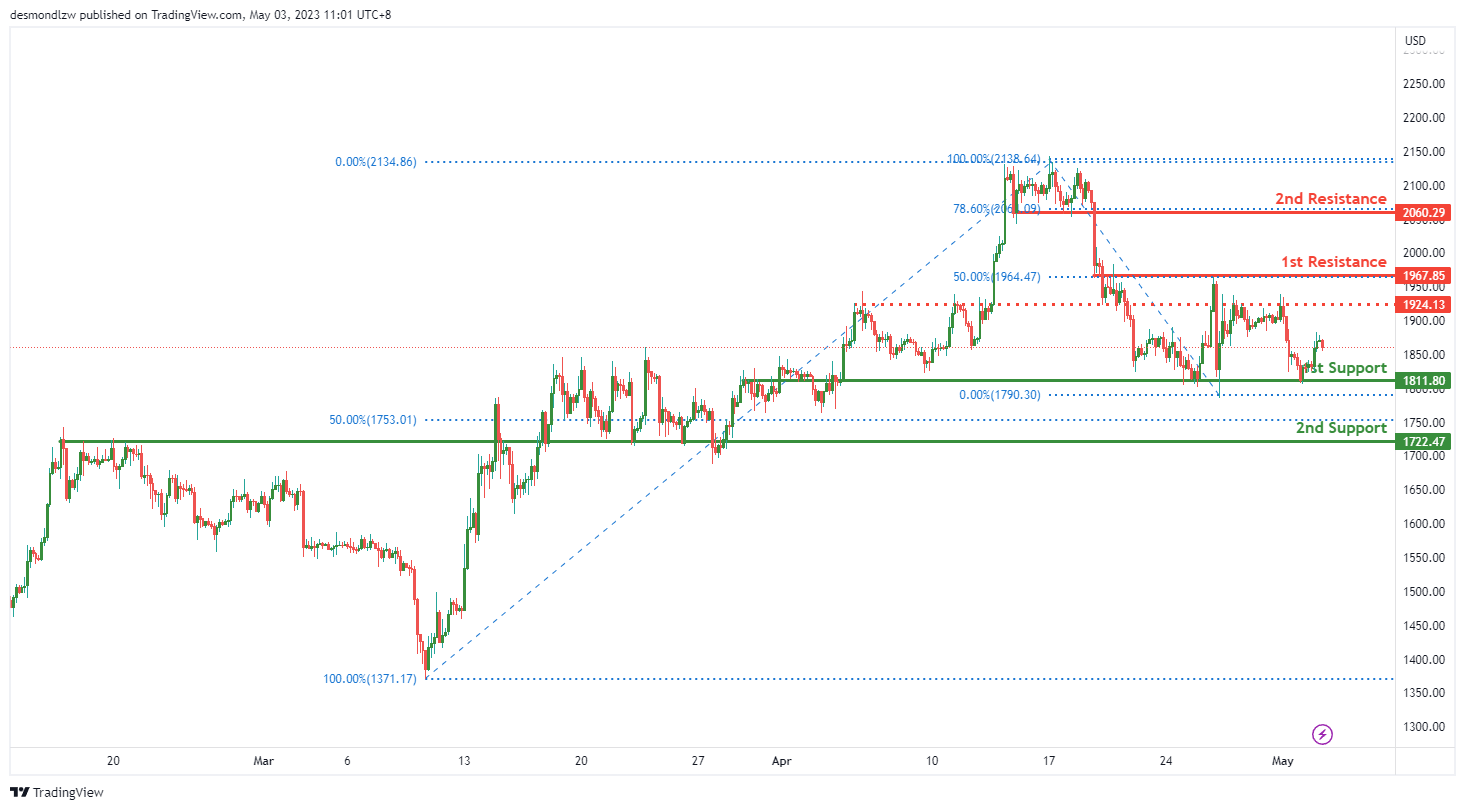
The ETH/USD chart is displaying bearish momentum, with potential for a bearish continuation towards the 1st support level at 1811.80. The 1st support level is a strong overlap support level, which may act as a support level if price were to drop further. The 2nd support level at 1722.47 is also an overlap support level and lines up with the 50% Fibonacci retracement level.
On the upside, the 1st resistance level at 1967.85 is also an overlap resistance level and lines up with the 50% Fibonacci retracement level. If the price manages to break through this level, it could potentially rise towards the 2nd resistance level at 2060.29, which is a pullback resistance level and coincides with the 78.60% Fibonacci retracement level. There is also an intermediate resistance level at 1924.13 which is also an overlap resistance level.
Overall, the ETH/USD chart is displaying bearish momentum, with potential for a bearish continuation towards the 1st support level at 1811.80. The 1st and 2nd support levels at 1811.80 and 1722.47 respectively, may act as support levels if the price drops. The 1st and 2nd resistance levels at 1967.85 and 2060.29, respectively, may act as resistance levels if the price manages to break through the 1st resistance level.
WTI/USD:
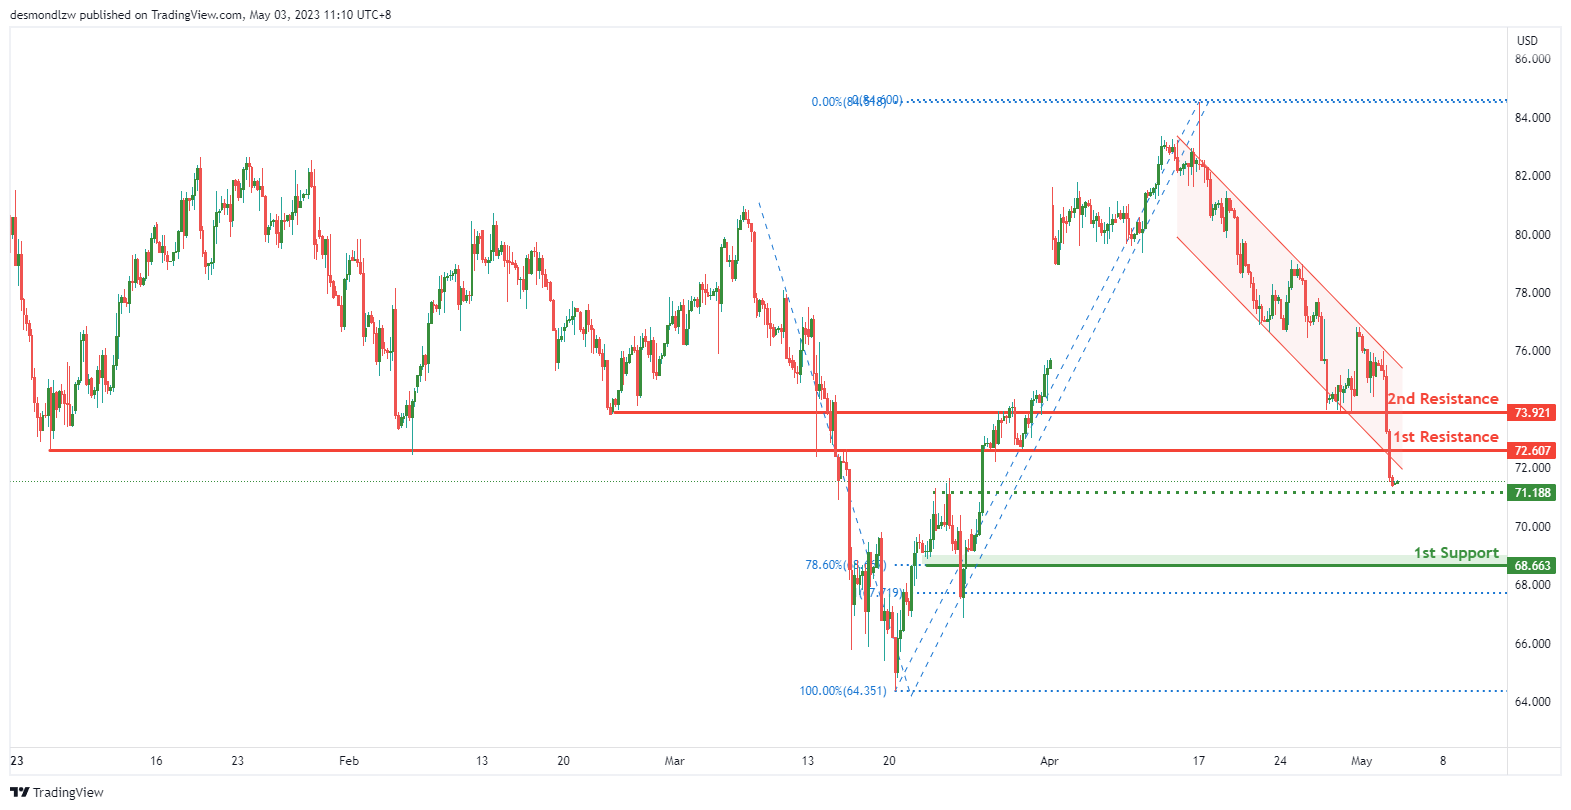
The WTI chart is currently showing a bearish momentum, with potential for a continuation towards the 1st support level at 68.66. This support level is a pullback support and also lines up with the 78.60% Fibonacci retracement, making it a strong level of support. The intermediate support level at 71.18 is also a pullback support level that could act as support if the price were to drop further.
On the upside, the 1st resistance level at 72.60 is an overlap resistance level, and if the price were to rise, it may encounter resistance at this level. The 2nd resistance level at 73.92 is also an overlap resistance level.
Overall, the WTI chart is showing bearish momentum, and the potential for a continuation towards the 1st support level at 68.66. The 1st and intermediate support levels at 68.66 and 71.18, respectively, may act as support levels if the price drops further. The 1st and 2nd resistance levels at 72.60 and 73.92, respectively, may act as resistance levels if the price manages to rise.
XAU/USD (GOLD):
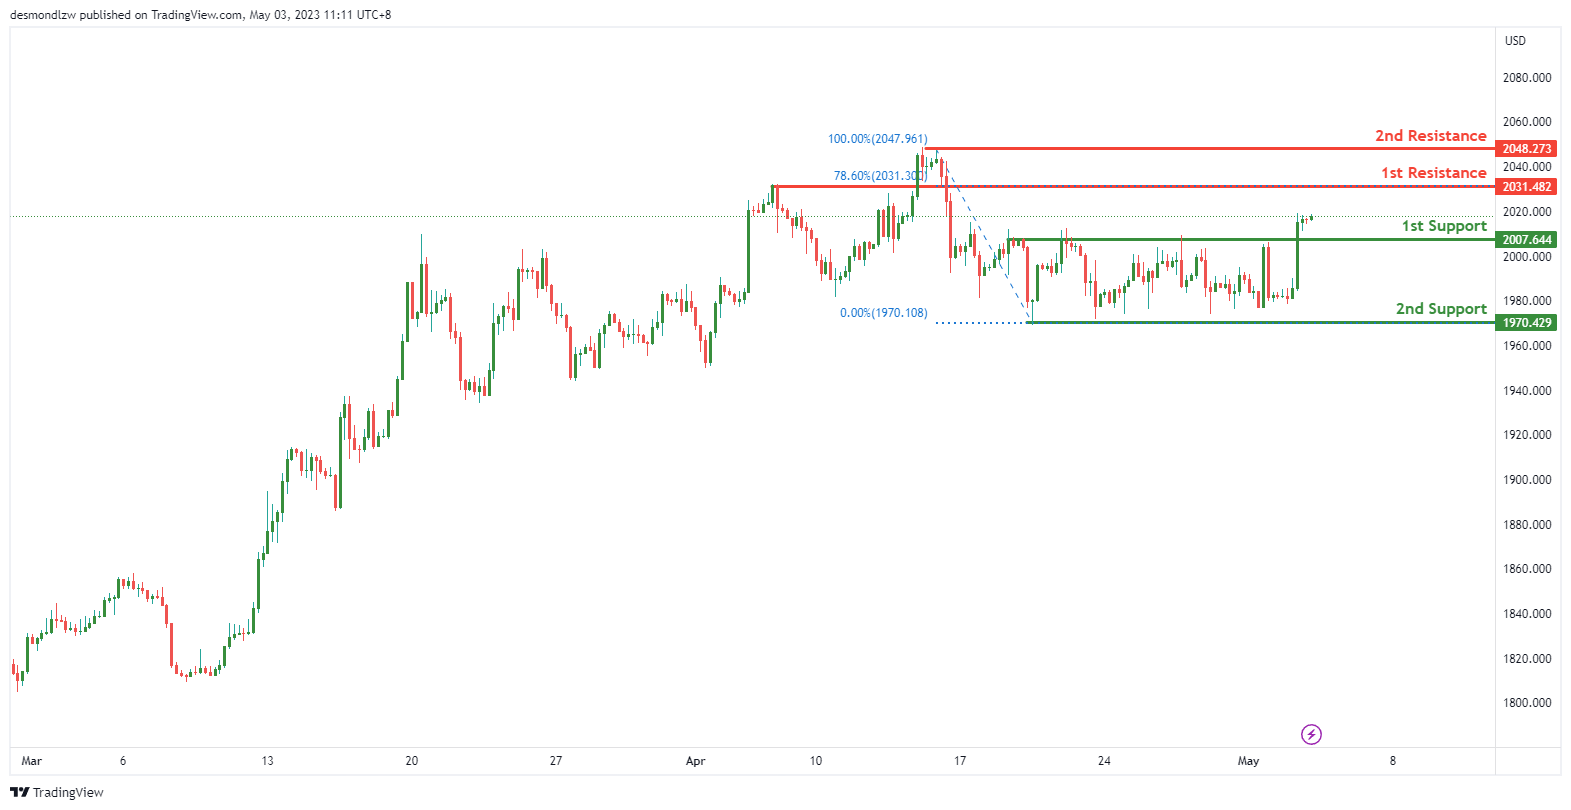
The XAU/USD chart is displaying bullish momentum, indicating the potential for a bullish continuation towards the 1st resistance level at 2031.48. The 1st support level at 2007.64 serves as a strong pullback support level, which could initiate a bullish movement towards the 1st resistance level, should the price bounce off it. The 2nd support level at 1970.42 is also a multi-swing low support level, which further reinforces its potential to act as a support level.
On the upside, the 1st resistance level at 2031.48 serves as a pullback resistance level, which could cause a reversal in bullish momentum if the price fails to break through it. If the price manages to break through, it could continue towards the 2nd resistance level at 2048.27, which is a swing high resistance level.
In summary, the XAU/USD chart is displaying bullish momentum with the potential for a bullish continuation towards the 1st resistance level at 2031.48. The 1st and 2nd support levels at 2007.64 and 1970.42, respectively, could act as support levels if the price drops. The 1st and 2nd resistance levels at 2031.48 and 2048.27, respectively, may act as resistance levels if the price manages to break through the 1st resistance level.


