
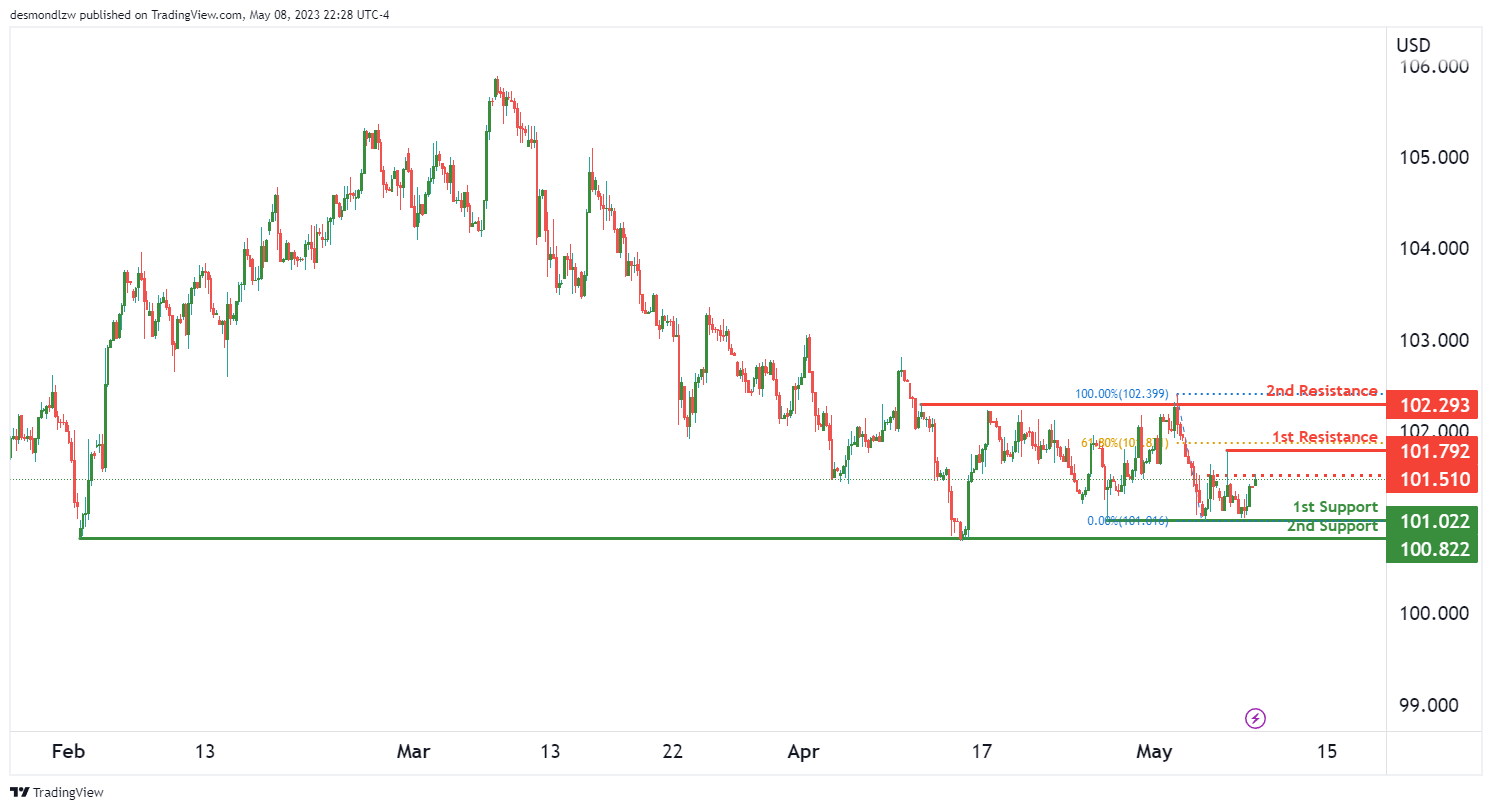
DXY:
The overall momentum of the chart is bullish, and there is a potential for a bullish continuation towards the 1st resistance level.
There are two support levels to consider for this instrument. The 1st support level is at 101.02, and this is a multi-swing low support level. It has acted as a strong support level in the past, and if price were to drop to this level again, it could potentially act as a support level again. The 2nd support level is at 100.82, and this is also a multi-swing low support level. If price were to drop further, it could potentially find support at this level as well.
On the resistance side, the 1st resistance level is at 101.79, and this is a swing high resistance level. This level has acted as a strong resistance level in the past, and if price were to rise towards this level, it could potentially face resistance here. The 2nd resistance level is at 102.29, and this is a multi-swing high resistance level. This level has also acted as a strong resistance level in the past, and if price were to break above the 1st resistance level, it could potentially rise towards this level.
There is also an intermediate resistance level at 101.51, and this is a multi-swing high resistance level. This level has acted as a strong resistance level in the past, and if price were to break above this level, it could potentially trigger a stronger bullish acceleration towards the 1st resistance level.
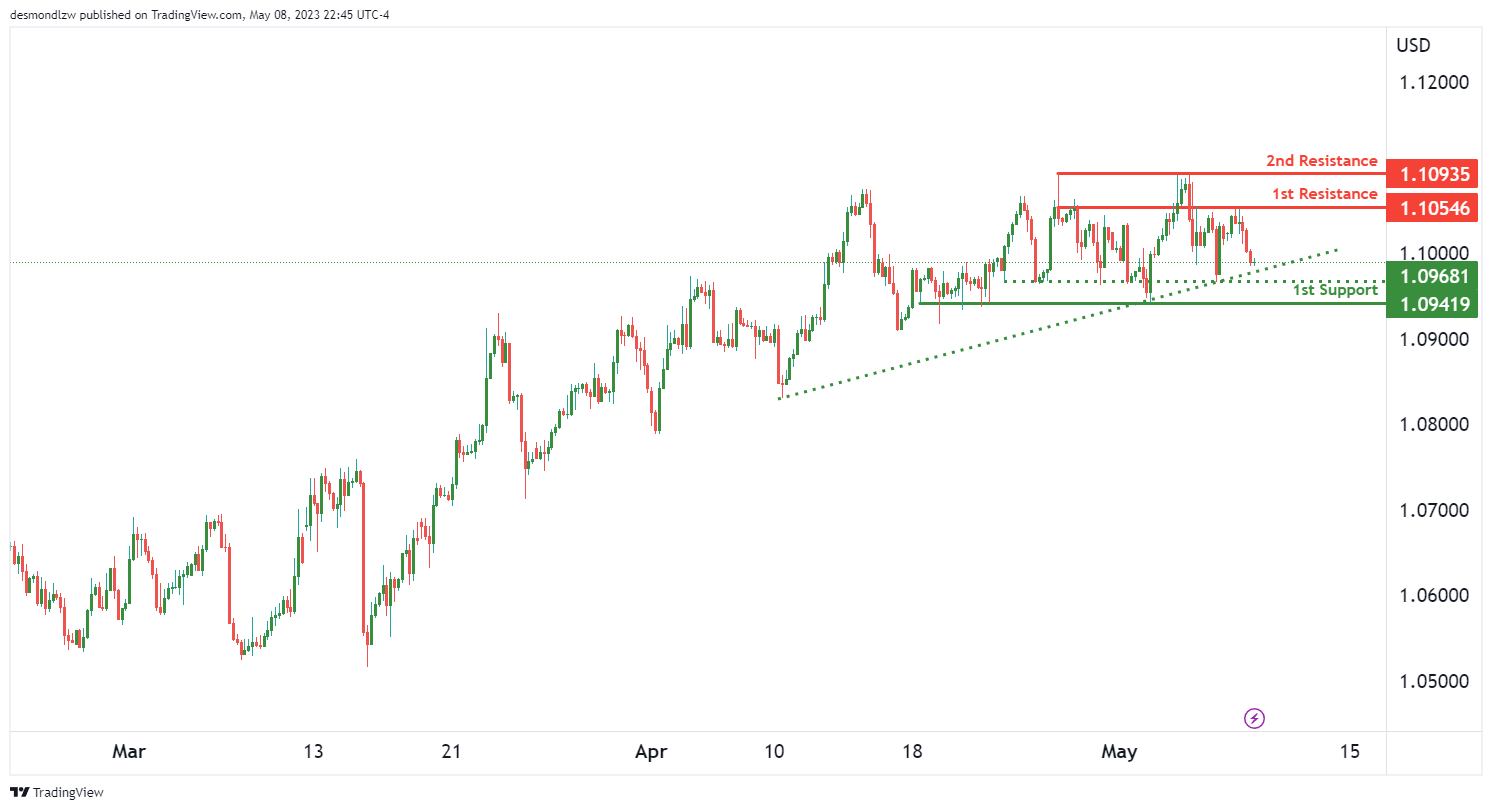
EUR/USD:
The EUR/USD instrument. The overall momentum of the chart is currently bearish, and this is due to the possibility that the price may break below the ascending trendline, which could cause the price to drop towards the 1st support level.
The 1st support level is at 1.0941, and this is a multi-swing low support level. This suggests that price has previously bounced off this level, and it could potentially act as a support level again if price were to drop towards this level.
The intermediate support level is at 1.0968, and this is also a multi-swing low support level. This level has acted as a strong support level in the past, and if price were to drop further, it could potentially find support at this level as well.
On the resistance side, the 1st resistance level is at 1.1054, and this is an overlap resistance level. This means that there is a confluence of factors, such as a previous support level now acting as a resistance level, and this could make this level a strong resistance level.
The 2nd resistance level is at 1.1093, and this is a multi-swing high resistance level. This level has acted as a strong resistance level in the past, and if price were to rise towards this level, it could potentially face resistance here.
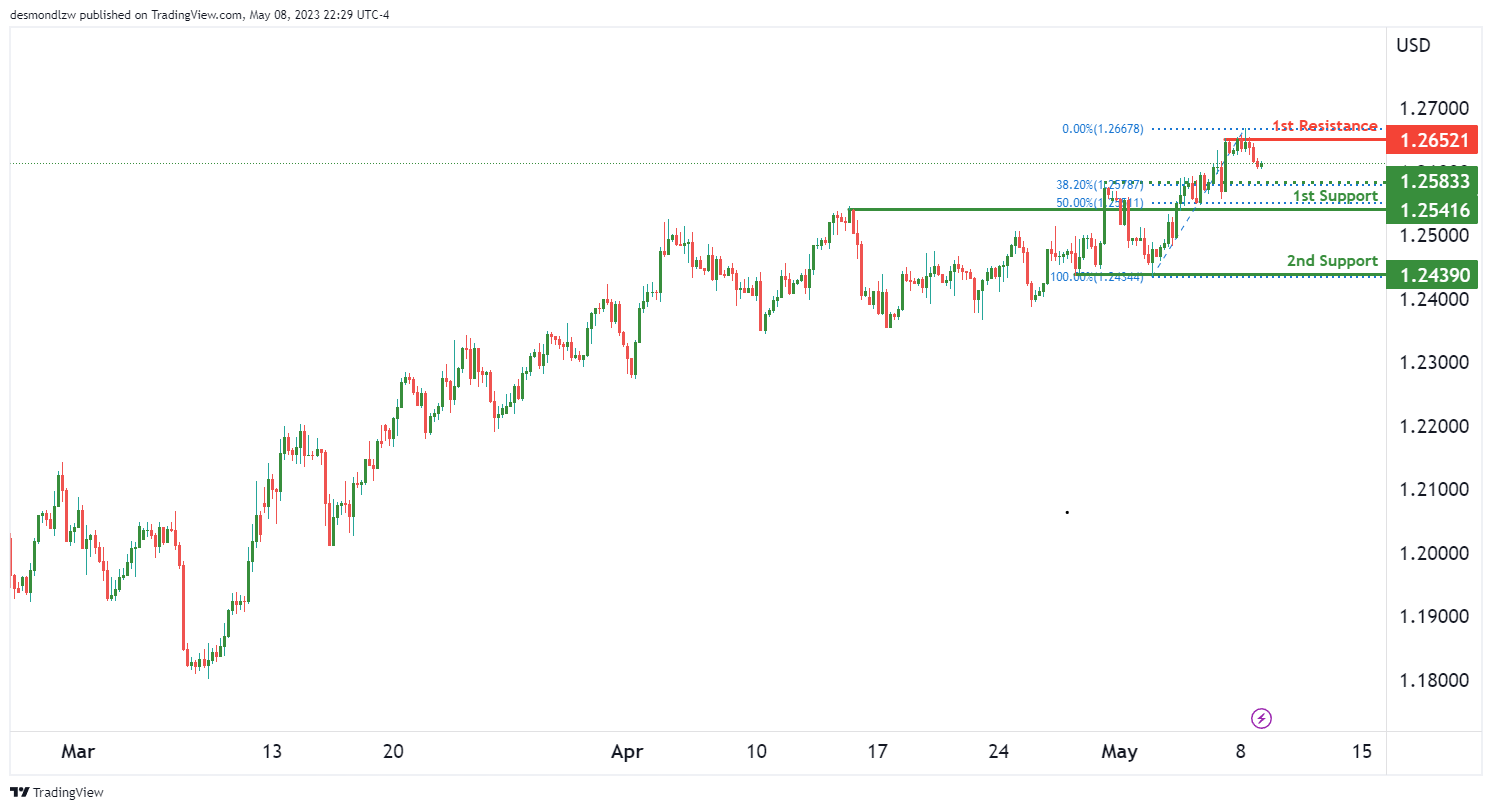
GBP/USD:
The GBP/USD instrument. The overall momentum of the chart is still bearish, and there is a potential for a bearish continuation towards the 1st support level.
The 1st support level is at 1.2541, and this is an overlap support level. This means that there is a confluence of factors, such as a previous resistance level now acting as a support level, and this could make this level a strong support level. Additionally, this level coincides with the 50% Fibonacci retracement level, which could make it an even stronger support level.
The 2nd support level is at 1.2439, and this is a multi-swing low support level. This level has acted as a strong support level in the past, and if price were to drop further, it could potentially find support at this level as well.
On the resistance side, the 1st resistance level is at 1.2652, and this is a multi-swing high resistance level. This level has acted as a strong resistance level in the past, and if price were to rise towards this level, it could potentially face resistance here.
There is also an intermediate support level at 1.2583, and this is a multi-swing high resistance level. This suggests that price has previously struggled to break above this level, and if price were to drop towards this level, it could potentially act as a support level. Additionally, this level coincides with the 38.20% Fibonacci retracement level, which could make it an even stronger support level.
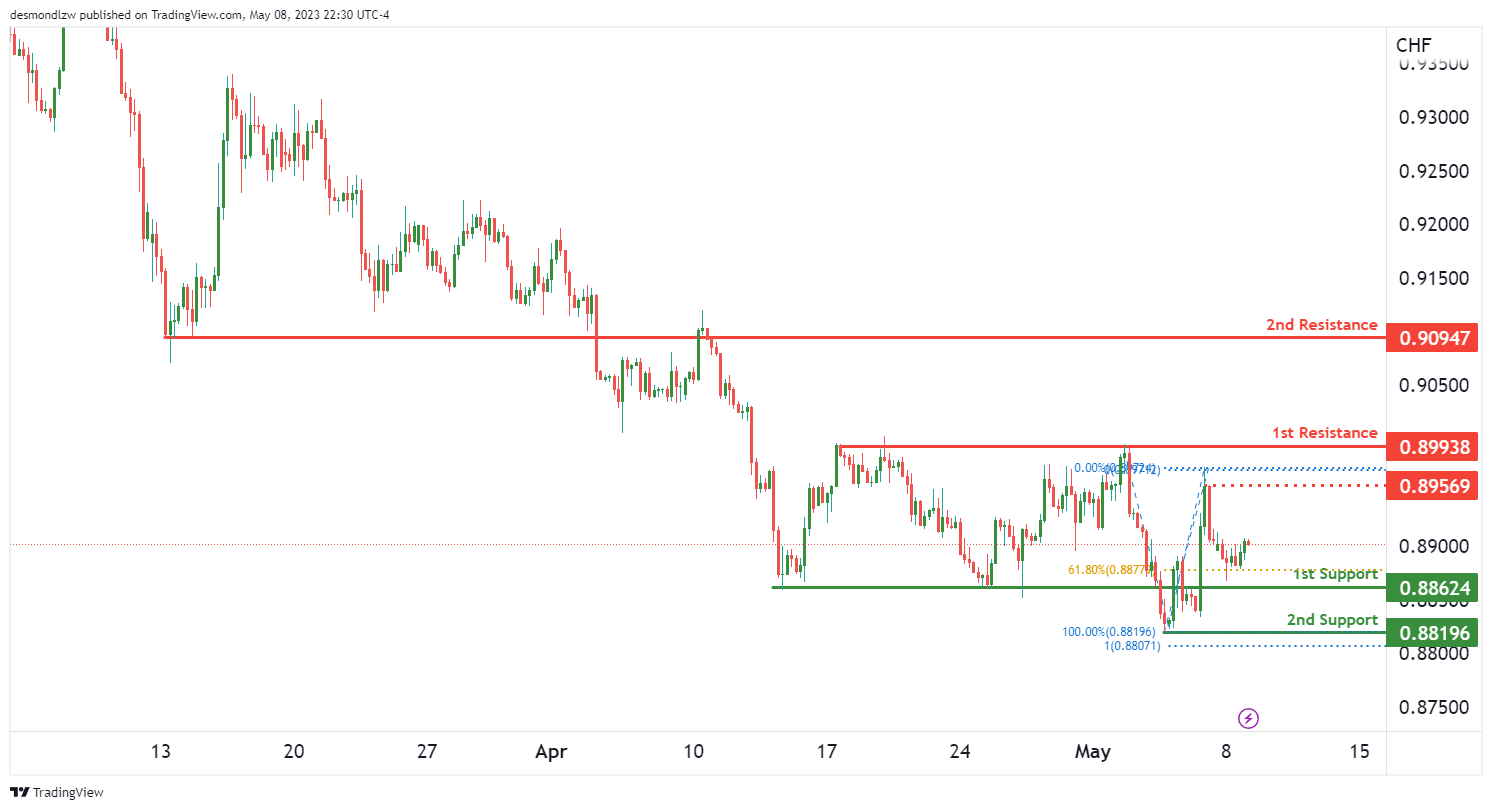
USD/CHF:
The USD/CHF instrument. The overall momentum of the chart is still bearish, but there is a potential for a bullish continuation towards the 1st resistance level.
The 1st support level is at 0.8862, and this is an overlap support level. This means that there is a confluence of factors, such as a previous resistance level now acting as a support level, and this could make this level a strong support level. Additionally, this level coincides with the 61.80% Fibonacci retracement level, which could make it an even stronger support level.
The 2nd support level is at 0.8819, and this is a swing low support level. This level has acted as a strong support level in the past, and if price were to drop further, it could potentially find support at this level as well. Additionally, this level coincides with the 100% Fibonacci projection level, which could make it an even stronger support level.
On the resistance side, the 1st resistance level is at 0.8993, and this is a multi-swing high resistance level. This level has acted as a strong resistance level in the past, and if price were to rise towards this level, it could potentially face resistance here.
The 2nd resistance level is at 0.9095, and this is an overlap resistance level. This means that there is a confluence of factors, such as a previous support level now acting as a resistance level, and this could make this level a strong resistance level.
There is also an intermediate resistance level at 0.8956, and this is a swing high resistance level. This means that price has struggled to break above this level in the past, and if price were to rise towards this level, it could potentially face resistance here.
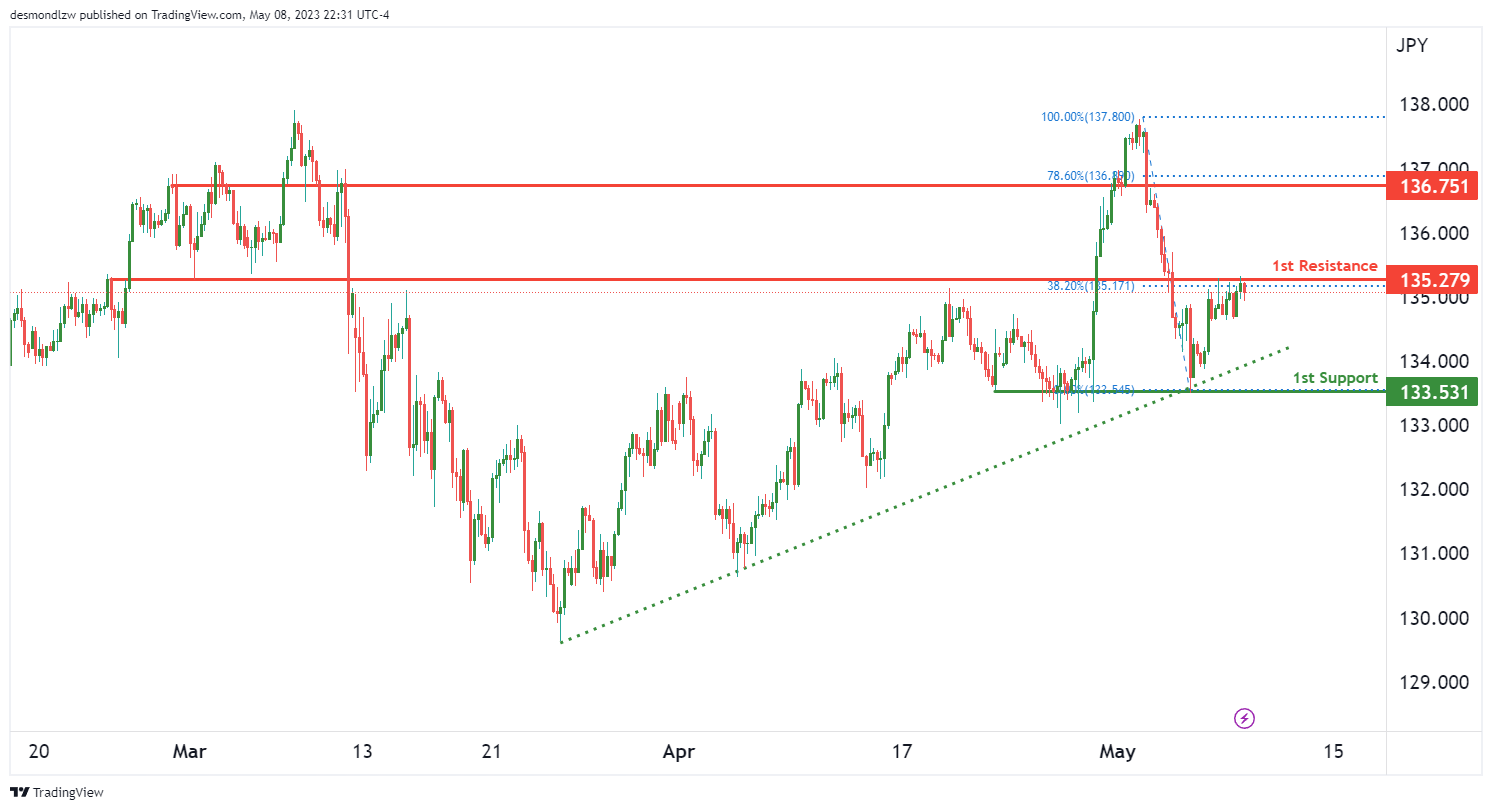
USD/JPY:
The USD/JPY instrument. The overall momentum of the chart is bullish, and this is due to price being above a major ascending trend line, which suggests that further bullish momentum could be on the cards.
There is a potential for a bullish break through of the 1st resistance level and a rise towards the 2nd resistance level.
The 1st support level is at 133.53, and this is a multi-swing low support level. This means that price has bounced off this level multiple times in the past, and it could potentially act as a strong support level again in the future.
The 1st resistance level is at 135.27, and this is an overlap resistance level. This means that there is a confluence of factors, such as a previous support level now acting as a resistance level, and this could make this level a strong resistance level. Additionally, this level coincides with the 38.20% Fibonacci retracement level, which could make it an even stronger resistance level.
The 2nd resistance level is at 136.75, and this is also an overlap resistance level. This means that there is a confluence of factors, such as a previous support level now acting as a resistance level, and this could make this level a strong resistance level. Additionally, this level coincides with the 78.60% Fibonacci retracement level, which could make it an even stronger resistance level.
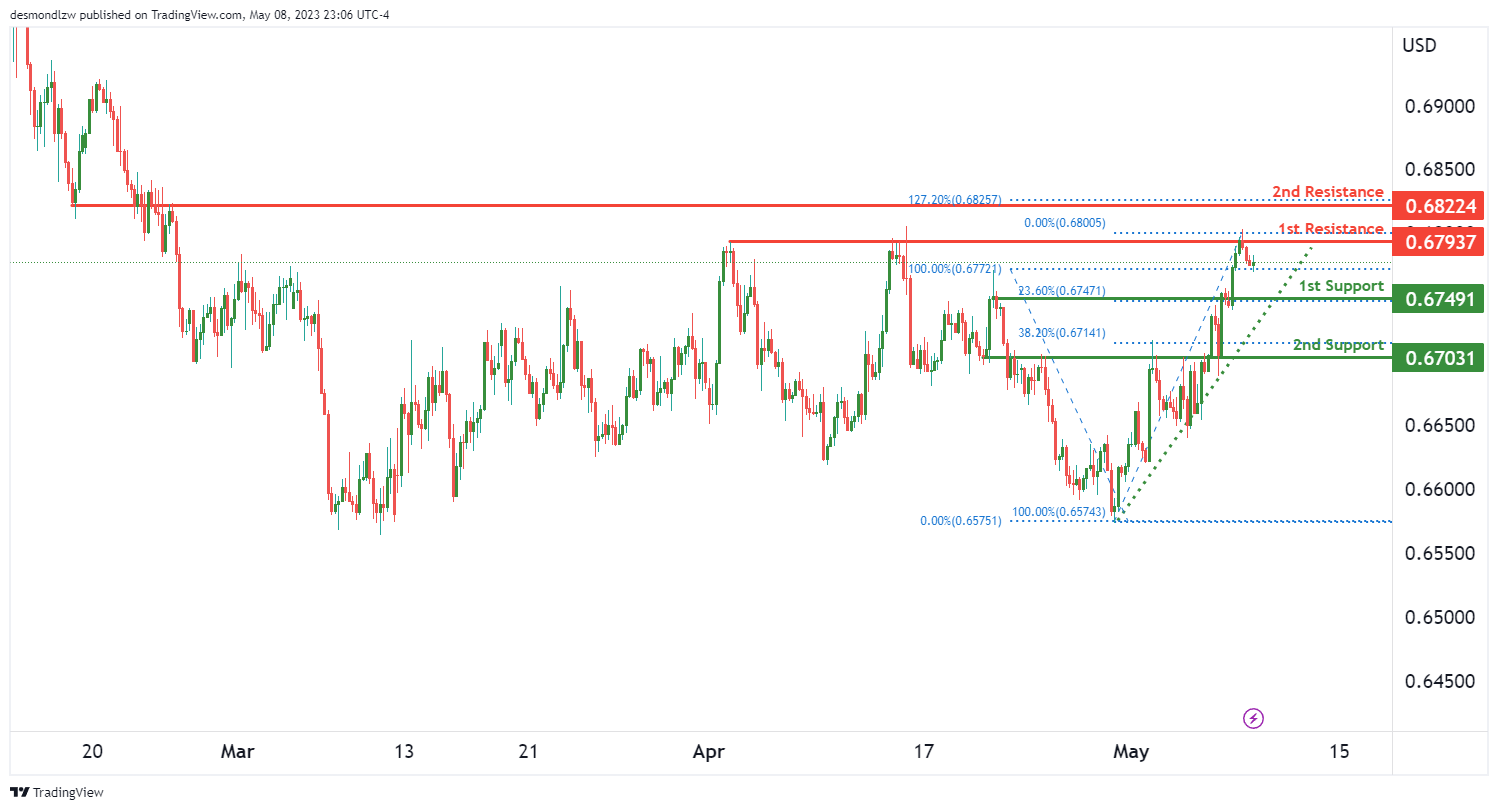
AUD/USD:
The overall momentum of the AUD/USD chart is currently bullish, with price above a major ascending trend line suggesting further upside potential. However, in the short term, there could be a drop towards the first support level before potentially bouncing back up towards the first resistance.
The first support level is at 0.6749, which is an overlap support level and also coincides with a 23.60% Fibonacci retracement. The second support level is at 0.6703, which is another overlap support level and coincides with a 38.20% Fibonacci retracement.
On the upside, the first resistance level is at 0.6793, which is a multi-swing high resistance level. The second resistance level is at 0.6822, which is an overlap resistance level and coincides with a 127.20% Fibonacci extension.
If price drops towards the first support level in the short term, there could be a potential bounce from there towards the first resistance level. However, if price breaks below the first support level, it could potentially drop further towards the second support level.
NZD/USD
The NZD/USD Potential for Bullish Continuation
The overall momentum of the NZD/USD chart is currently bullish, with price trading above a major ascending trend line that suggests further bullish momentum is on the cards. However, in the short term, price may drop further to the first support level before bouncing and rising towards the first resistance.
The first support level is at 0.6315, which is a pullback support level at the 23.60% Fibonacci retracement. This support level is followed by the second support level at 0.6264, which is an overlap support level at the 38.20% Fibonacci retracement. These support levels are considered good because they have held up multiple times in the past, indicating a strong level of support.
On the other hand, the first resistance level is at 0.6351, which is a multi-swing high resistance level. This is followed by the second resistance level at 0.6390, which is another multi-swing high resistance level. These resistance levels are considered good because they have prevented price from rising higher in the past, suggesting that they may continue to do so.
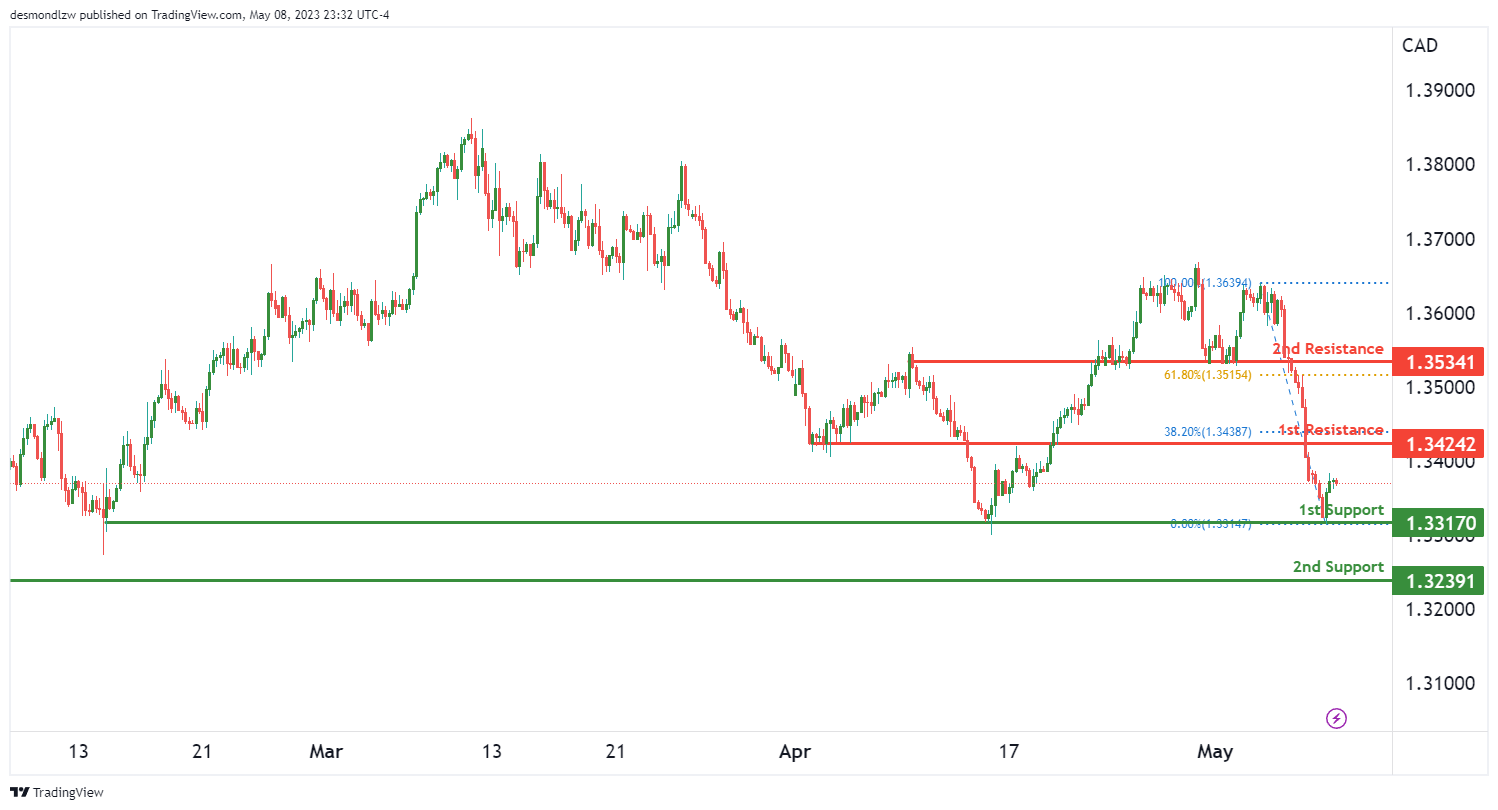
USD/CAD:
The USD/CAD chart is currently showing bullish momentum with the potential for further upside. The overall momentum of the chart is bullish, suggesting that prices may continue to rise in the near future. If the bullish momentum continues, the price could potentially make a bullish continuation towards the 1st resistance level.
There are two support levels to watch out for in case of a price drop. The 1st support level is at 1.3317, which is a multi-swing low support level. The 2nd support level is at 1.3239, which is a swing low support level.
On the upside, there are two resistance levels to watch out for. The 1st resistance level is at 1.3424, which is a pullback resistance level that coincides with the 38.20% Fibonacci retracement level. The 2nd resistance level is at 1.3534, which is also a pullback resistance level that coincides with the 61.80% Fibonacci retracement level.
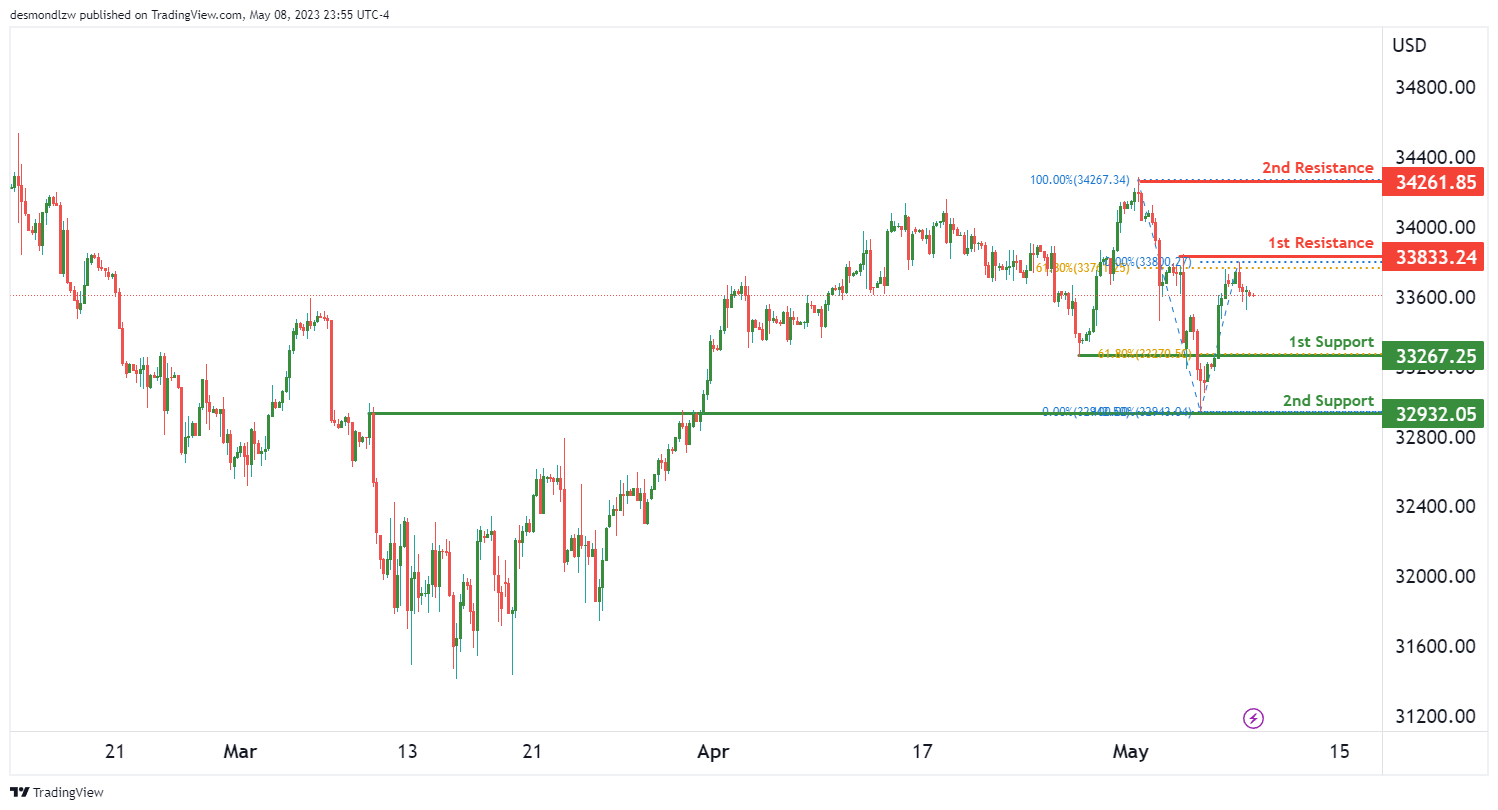
DJ30:
The overall momentum of the DJ30 chart is bearish. The potential price move for this instrument is a bearish continuation towards the first support level. The first support level is located at 33267.25, which is a pullback support level at the 61.80% Fibonacci Retracement. The second support level is located at 32932.05, which is a pullback support level.
On the resistance side, the first resistance level is located at 33833.24, which is a multi-swing high resistance level at the 61.80% Fibonacci Retracement. The second resistance level is located at 34261.85, which is a swing high resistance level.
GER30:
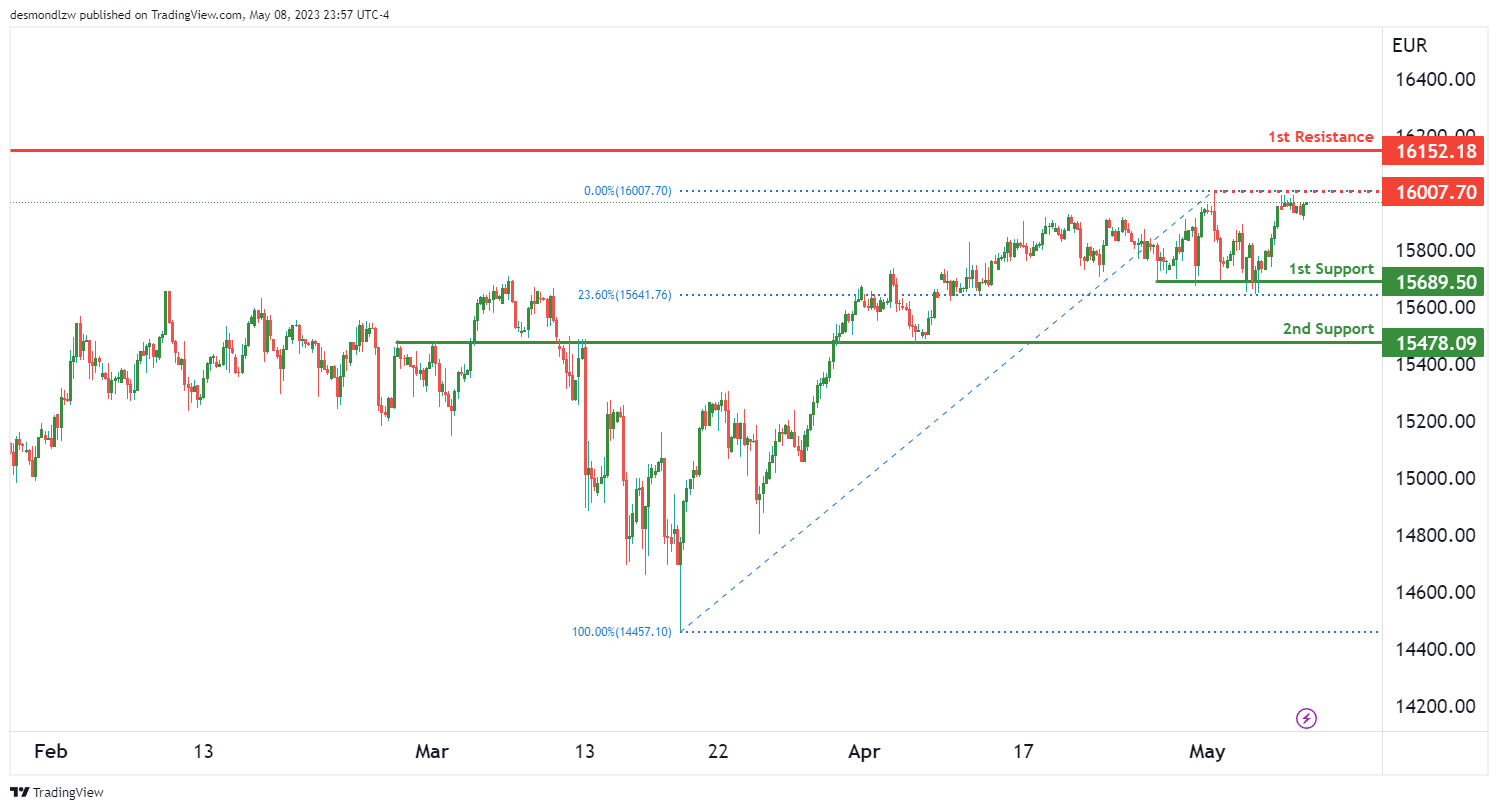
The GER30 (German DAX) index appears to have a bullish overall momentum, and the price could potentially make a bullish continuation towards the first resistance level.
The first support level is at 15689.50, which is a multi-swing low support and also corresponds to the 23.60% Fibonacci retracement level. The second support level is at 15478.09, which is an overlap support.
The first resistance level is at 16152.18, which is a swing high resistance. An intermediate resistance level can also be identified at 16007.70, which is a multi-swing high resistance.
If the bullish momentum continues, prices could potentially rise from the current level towards the first resistance level, followed by a potential break above the intermediate resistance level, towards the swing high resistance. On the other hand, if the bullish momentum loses steam, prices could retrace towards the first or second support levels.
BTC/USD:
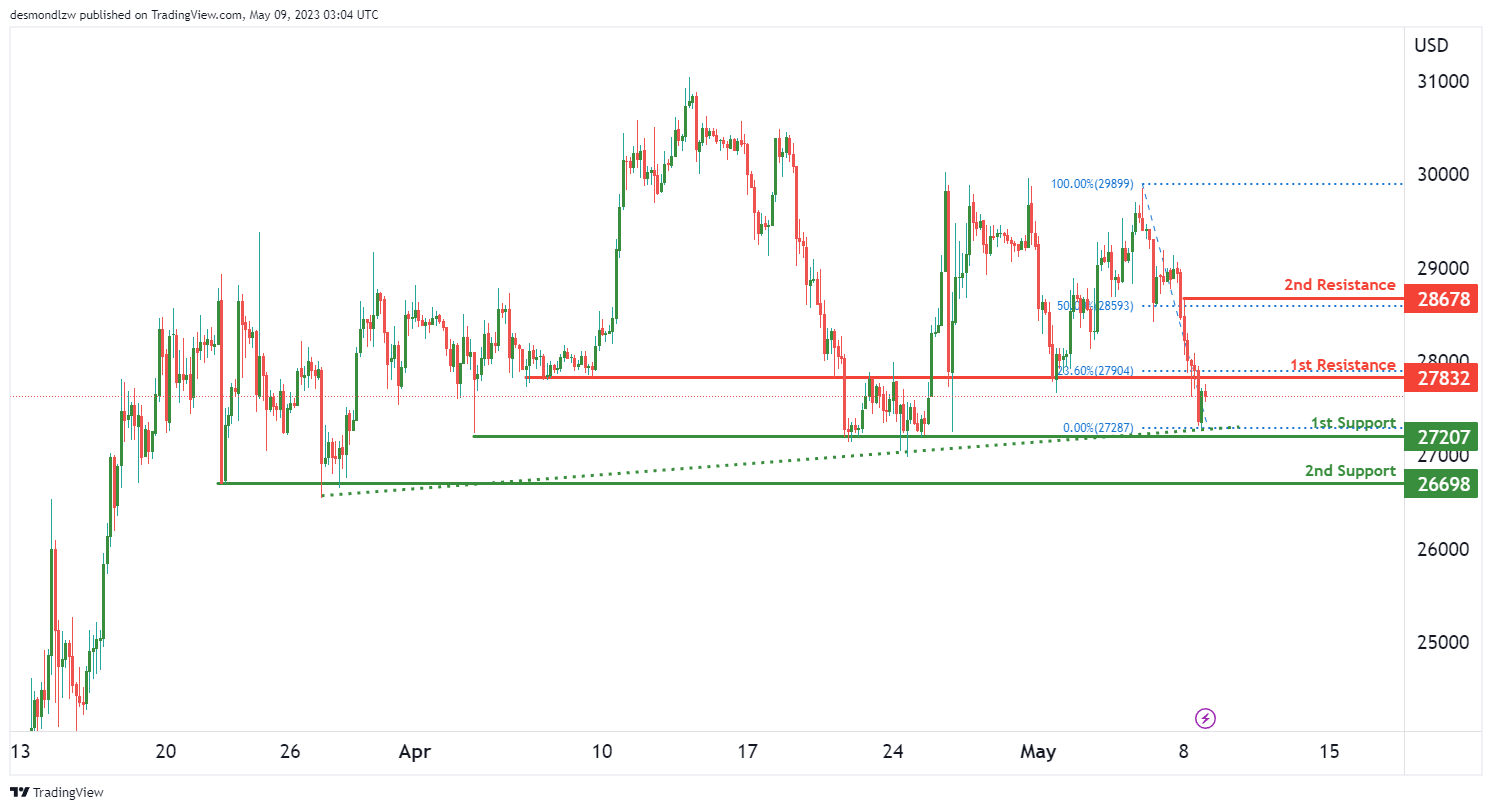
The BTC/USD chart is showing strong bullish momentum, with price currently above a major ascending trend line. This suggests that further upside potential is likely in the near term.
In the short term, price could potentially make a bullish continuation towards the first resistance level at 27832, followed by the second resistance level at 28678.
On the downside, there are two important support levels to watch out for. The first support level is at 27207, which is a multi-swing low support. The second support level is at 26698, which is also a multi-swing low support.
Looking at the Fibonacci retracement levels, the first resistance level coincides with the 38.20% retracement level, adding to its significance as a key level to watch out for. The second resistance level is at the 50% retracement level and is also a swing high resistance level.
US500
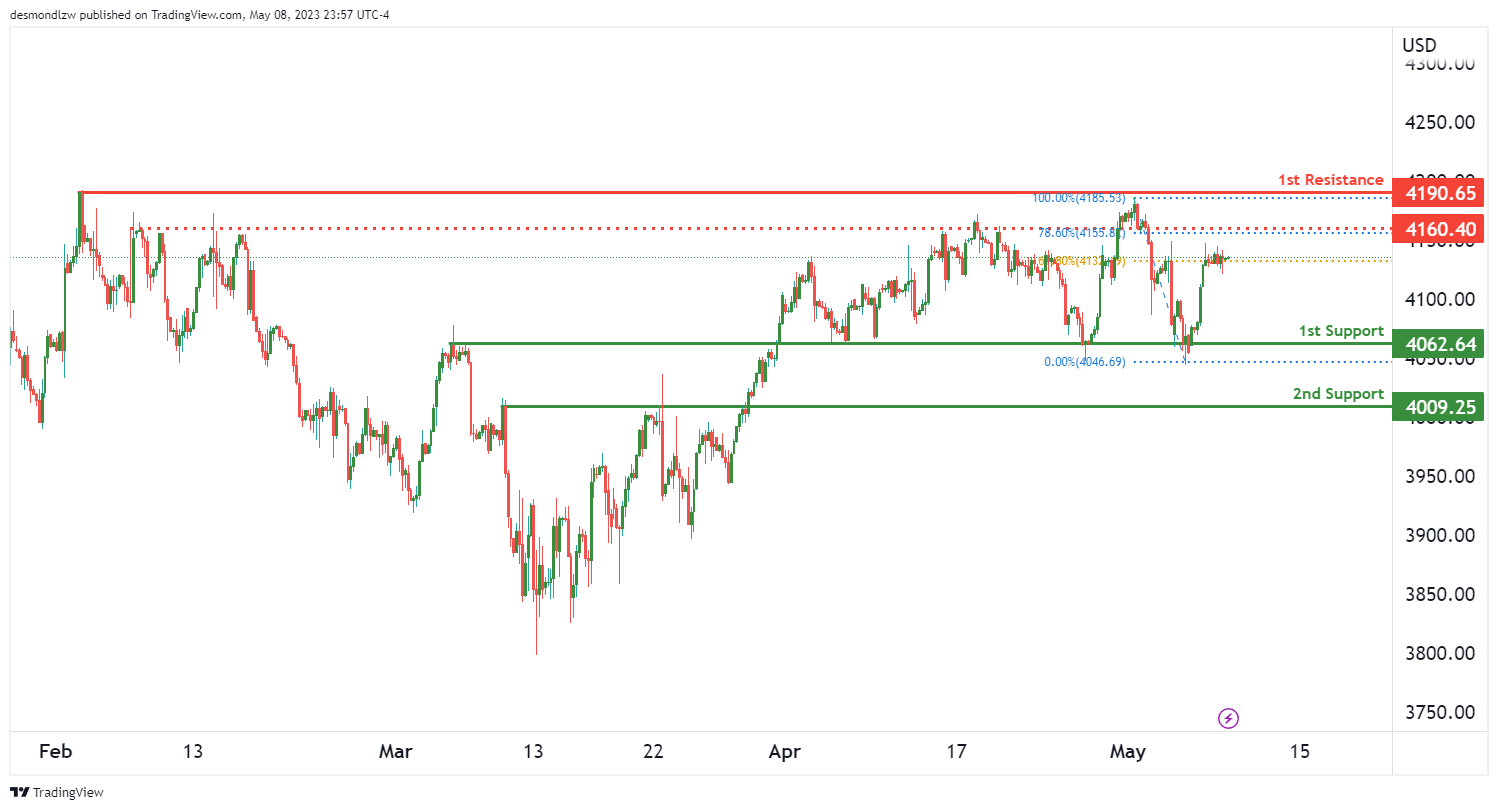
The overall momentum of the US500 chart is bullish. The price is expected to make a bullish continuation towards the 1st resistance level.
The 1st support level is at 4062.64, which is an overlap support. The 2nd support level is at 4009.25, which is a pullback support. These levels could potentially act as support areas where price could bounce from.
The 1st resistance level is at 4190.65, which is a multi-swing high resistance. This level could potentially act as a resistance area where price could reverse from. An intermediate resistance level is at 4160.40, which is an overlap resistance and also coincides with the 78.60% Fibonacci retracement level.
ETH/USD:
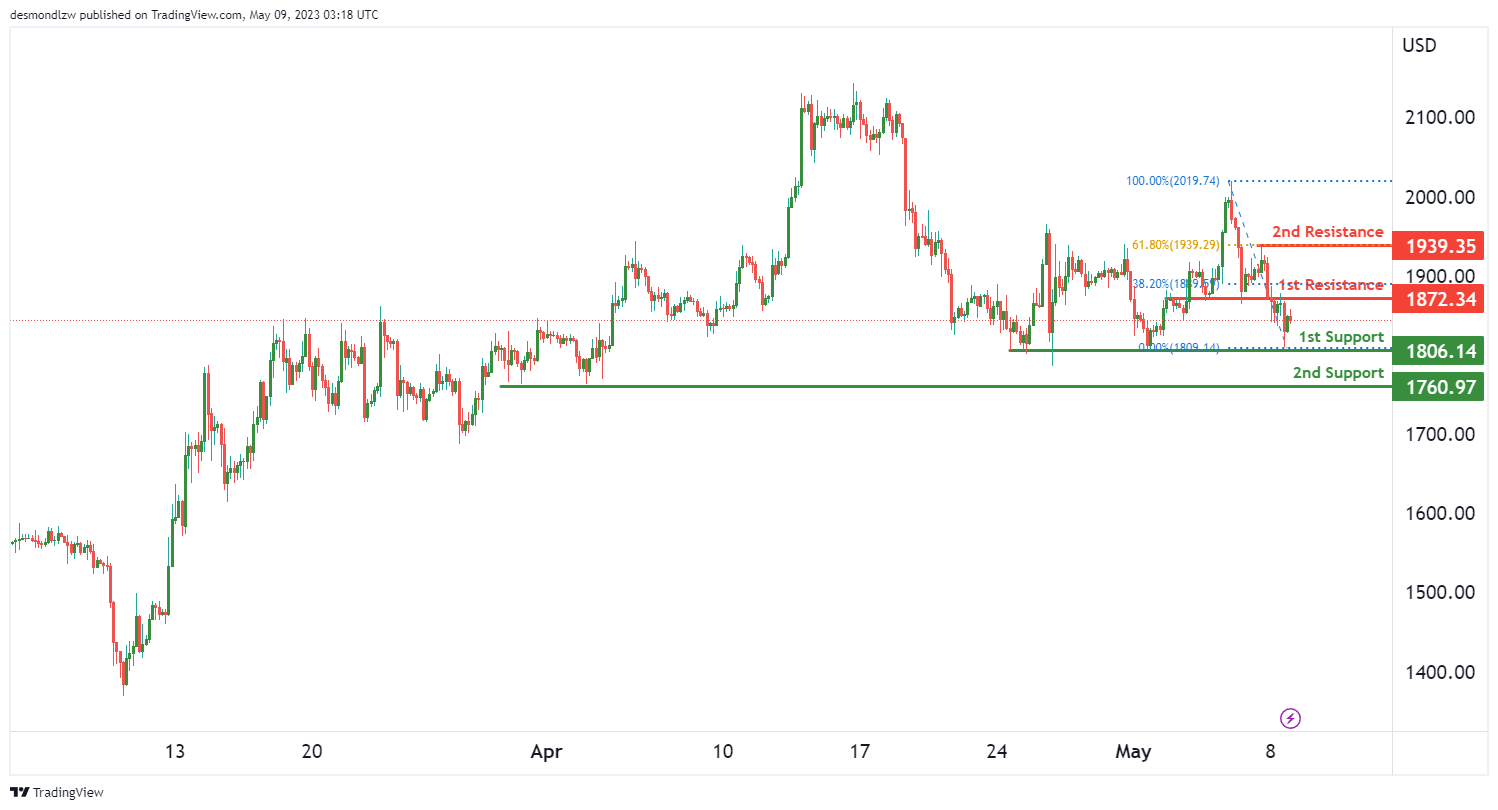
The overall momentum of ETH/USD is currently bullish, with the price above a major ascending trend line. This suggests that further bullish momentum is on the cards for the cryptocurrency.
Looking at the chart, the price of ETH/USD could potentially make a bullish continuation towards the first resistance level at 1877.34. If the price manages to break through this level, it could rise towards the second resistance level at 1939.35.
On the downside, there are two support levels to watch out for. The first support level is at 1808.14, which is a multi-swing low support. The second support level is at 1760.97, which is another multi-swing low support.
In terms of resistance, the first level at 1877.34 is an overlap resistance and is also at the 38.20% Fibonacci retracement level. The second resistance level at 1939.35 is a swing high resistance and is also at the 61.80% Fibonacci retracement level.
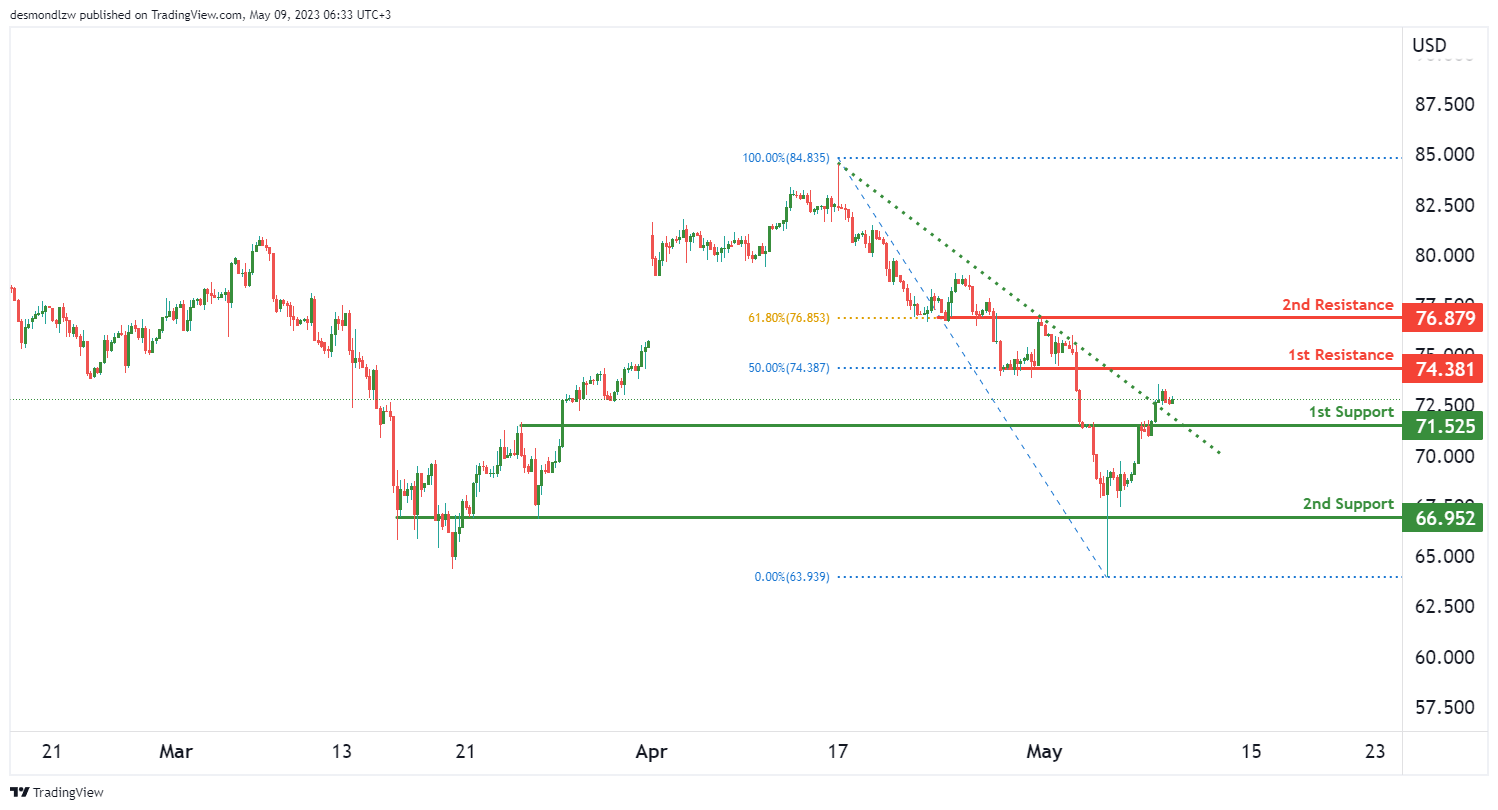
WTI/USD:
Crude oil prices have been bullish lately, and this momentum is expected to continue based on a number of factors. The overall momentum of the chart is bullish, which means that we can expect prices to continue to rise. One of the reasons for this is that the price broke above a descending resistance line, which triggered a potential bullish move.
Looking at the support and resistance levels, the first support level is at $71.52, which is an overlap support level. This means that this level has been tested several times in the past and has held as support. The second support level is at $66.95, which is also an overlap support level.
On the other hand, the first resistance level is at $74.38, which is a pullback resistance level and corresponds to the 50% Fibonacci retracement level. This level is expected to hold as resistance initially. The second resistance level is at $76.87, which is an overlap resistance level and corresponds to the 61.80% Fibonacci retracement level. This level is expected to be the next target if the price can break above the first resistance level.
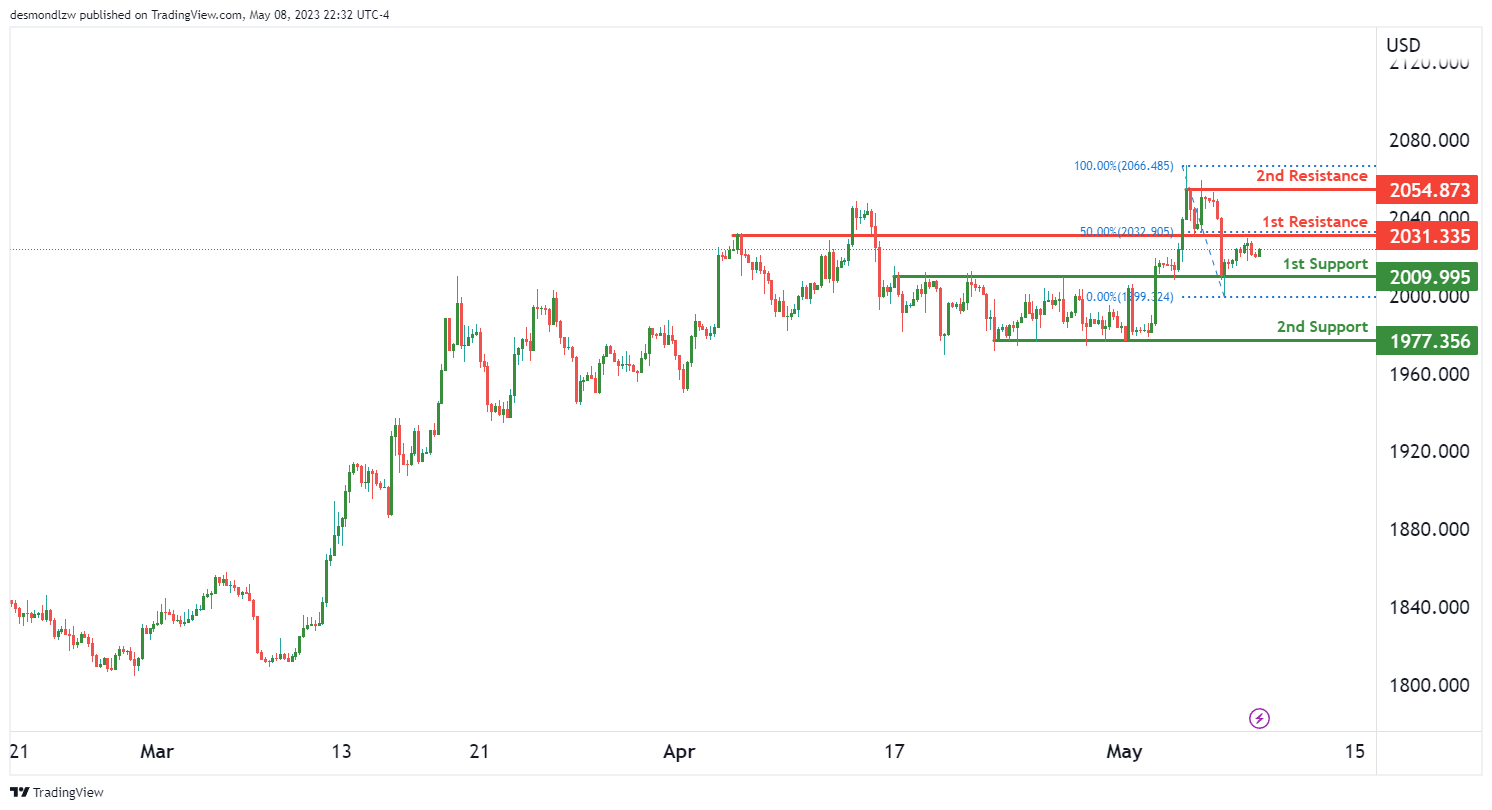
XAU/USD (GOLD):
The price of gold (XAU/USD) has been showing bearish momentum on the charts, with potential for a rise towards the first resistance in the short term before reversing and dropping towards the first support level.
The first support level is identified at 2009.99, as an overlap support level. This level could potentially act as a bounce point for the price, providing some temporary relief to the bears. If the price drops below this level, it could continue the bearish trend towards the second support level at 1977.35. This level is identified as a multi-swing low support level, and if the price reaches this level, it could indicate a further downward trend.
On the other hand, the first resistance level is identified at 2031.33, which is also the 50% Fibonacci retracement level. This level could act as a pullback resistance level, where the price might reverse off of it and move towards the support levels. The second resistance level at 2054.87 is identified as a multi-swing high resistance level, and if the price breaks above it, it could potentially signal a reversal of the bearish trend.


