
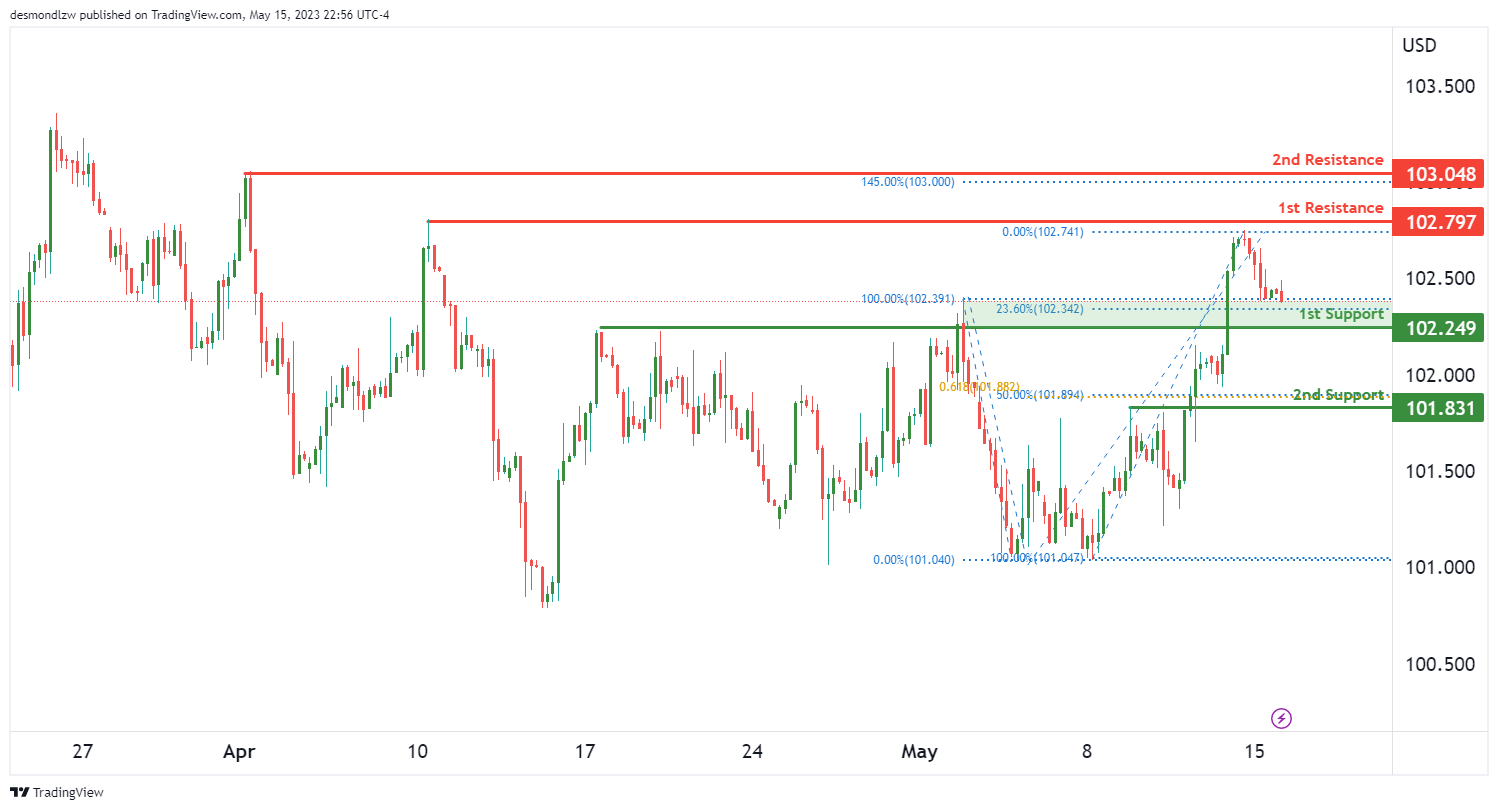
DXY:
The Dollar Index (DXY) is currently observing a significant bullish momentum, suggesting a potential continued upward movement. The bullish tendency could potentially lead the price to bounce off the first support and head towards the first resistance.
Our first support stands at 102.24. This key level serves as a pullback support, indicating a strong potential for price stability. Additionally, it aligns with a 23.6% Fibonacci retracement, further suggesting the robustness of this support level.
If the price manages to rebound from the first support, it could potentially rise towards the first resistance level, which is situated at 102.79. This level is a swing high resistance, suggesting it could be a significant barrier to further price increases.
However, should the price fail to maintain above the first support, our second support at 101.83 could come into play. This level also serves as a pullback support. Additionally, it is a point of Fibonacci confluence, coinciding with both a 61.8% Fibonacci projection and a 50% Fibonacci retracement, making it a crucial level to monitor.
Looking beyond the first resistance, our second resistance stands at 103.04. This level, a swing high resistance, coincides with a 145% Fibonacci extension, indicating it could be a significant hurdle for bullish momentum.
EUR/USD:
The EUR/USD pair is currently experiencing a pronounced bearish momentum with high confidence, suggesting a potential continued downward movement. The strong bearish tendency is indicated by the price’s position below the bearish Ichimoku cloud and a major descending trend line, suggesting that further bearish momentum is likely.
Our first resistance stands at 1.0909. This level serves as a pullback resistance, aligning with a 23.6% Fibonacci retracement. This suggests that it might be a significant barrier to any potential upward movement. If the price reacts bearishly off this first resistance, it could potentially drop towards the first support level.
The first support is found at 1.0846, a multi-swing low support level. This suggests a strong potential for price stability at this level. It is crucial to monitor the market’s reaction at this point, as a significant break below could further bolster the bearish momentum.
Should the price fail to maintain above the first support, our second support at 1.0792 could come into play. This level serves as a swing low support, making it a critical level to watch for potential price rebounds.
Looking beyond the first resistance, our second resistance stands at 1.0942. This level is an overlap resistance, suggesting that it could present a significant hurdle for any bullish momentum.
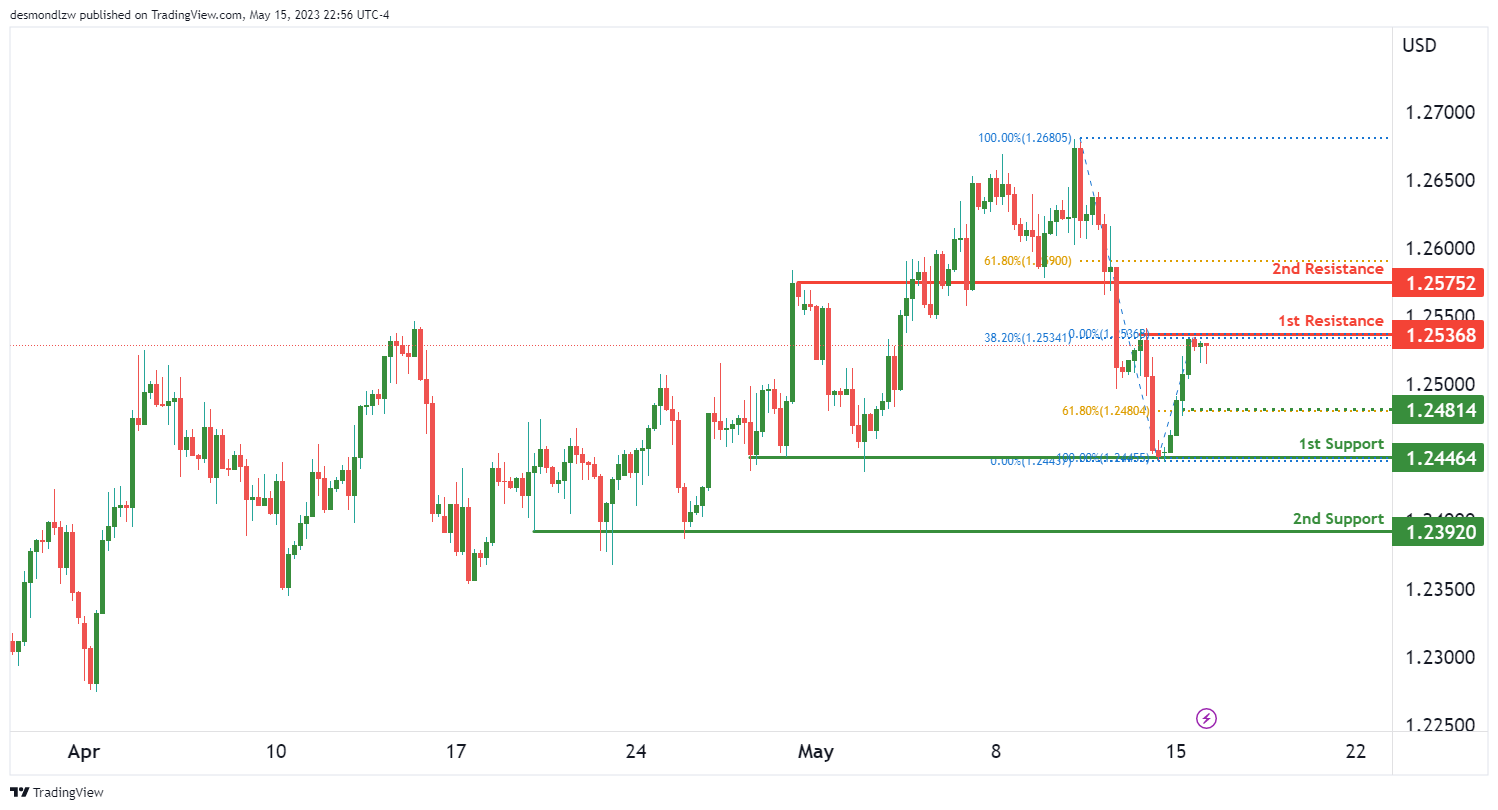
GBP/USD:
The GBP/USD pair is currently observing a notable bearish momentum, indicating the possibility of a downward trend continuation. There’s a potential for the price to react bearishly off the first resistance level, leading to a potential drop towards the first support level.
Our first resistance stands at 1.2536, serving as a multi-swing high resistance and coinciding with a 38.2% Fibonacci retracement. This suggests that it might present a significant barrier to any upward price movements.
In the event of a bearish reaction from this first resistance, the price could potentially descend towards the first support level, situated at 1.2446. This level serves as a multi-swing low support, indicating a strong potential for price stability at this point.
However, should the price fail to hold above the first support, our second support at 1.2392 could come into play. This level also serves as a multi-swing low support, making it a crucial level to watch for potential price rebounds.
Beyond the first resistance, our second resistance is at 1.2575. This level is a pullback resistance and aligns with a 61.8% Fibonacci retracement, suggesting that it could pose a significant hurdle for any potential bullish momentum.
Additionally, there is an intermediate support level at 1.2464, which is a swing low support, further emphasizing the bearish bias of the current price movement.
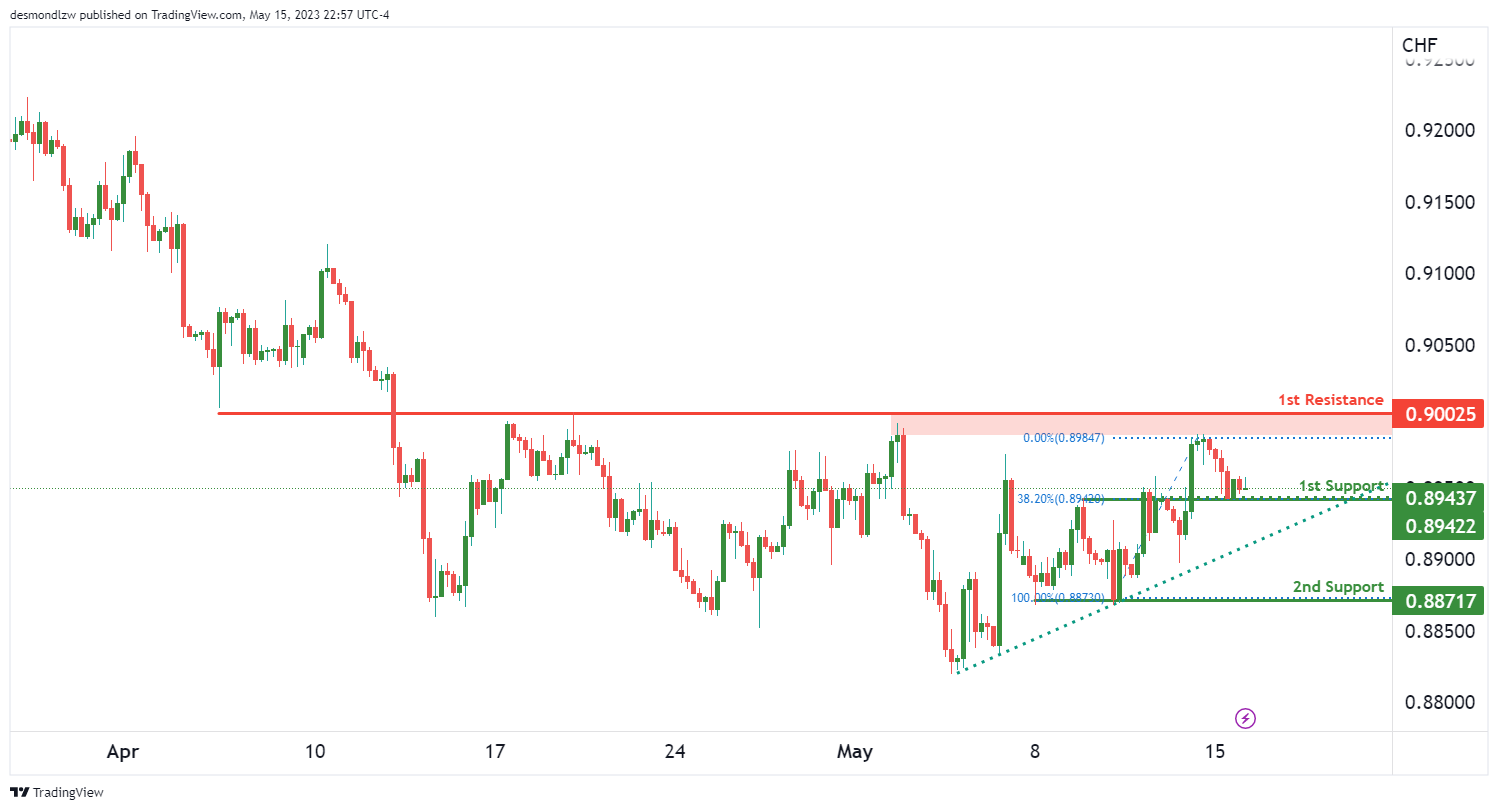
USD/CHF:
The USD/CHF pair is currently demonstrating notable bullish momentum, indicating a potential continuation of the upward trend. This bullish tendency is further suggested by the price’s position above a major ascending trend line, suggesting that further bullish momentum is likely.
Our first support level stands at 0.8943, which serves as an overlap support and aligns with a 38.2% Fibonacci retracement. This suggests a strong potential for price stability at this level. In the event of a bullish bounce from this first support, the price could potentially rise towards the first resistance level at 0.9002.
The first resistance level is an overlap resistance, suggesting that it might pose a significant barrier to further price increases.
However, should the price fail to maintain above the first support, the second support at 0.8871 could come into play. This level serves as a multi-swing low support, making it a crucial level to watch for potential price rebounds.
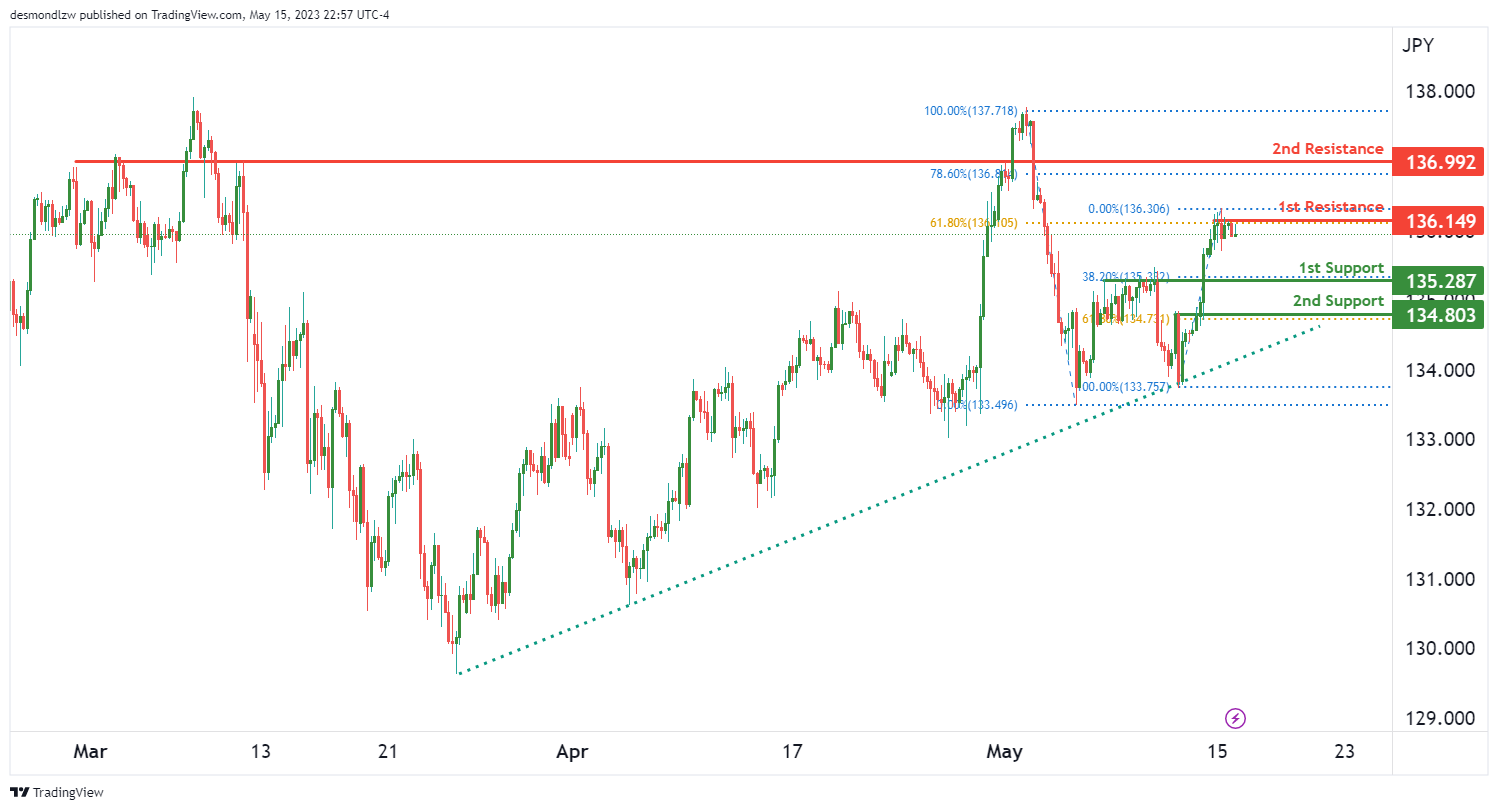
USD/JPY:
The USD/JPY pair is currently demonstrating strong bullish momentum, indicating the potential for a continuation of the upward trend. This bullish tendency is further suggested by the price’s position above a major ascending trend line, suggesting further bullish momentum is likely.
Our first support level stands at 135.28, which serves as a pullback support and coincides with a 38.2% Fibonacci retracement. This suggests a strong potential for price stability at this level.
However, in light of the current bullish momentum, the focus is on the potential for the price to break through the first resistance level, situated at 136.14. This level serves as a multi-swing high resistance and aligns with a 61.8% Fibonacci retracement, suggesting it might present a significant barrier to further price increases. A bullish breakthrough of this level could potentially lead to a rise towards the second resistance level.
The second resistance stands at 136.99 and is characterized as a pullback resistance. It also coincides with a 78.6% Fibonacci retracement, suggesting that it could pose a significant hurdle for any potential bullish momentum.
In the event the price fails to maintain above the first support, the second support at 134.80 could come into play. This level serves as an overlap support and coincides with a 61.8% Fibonacci retracement, making it a crucial level to watch for potential price rebounds.
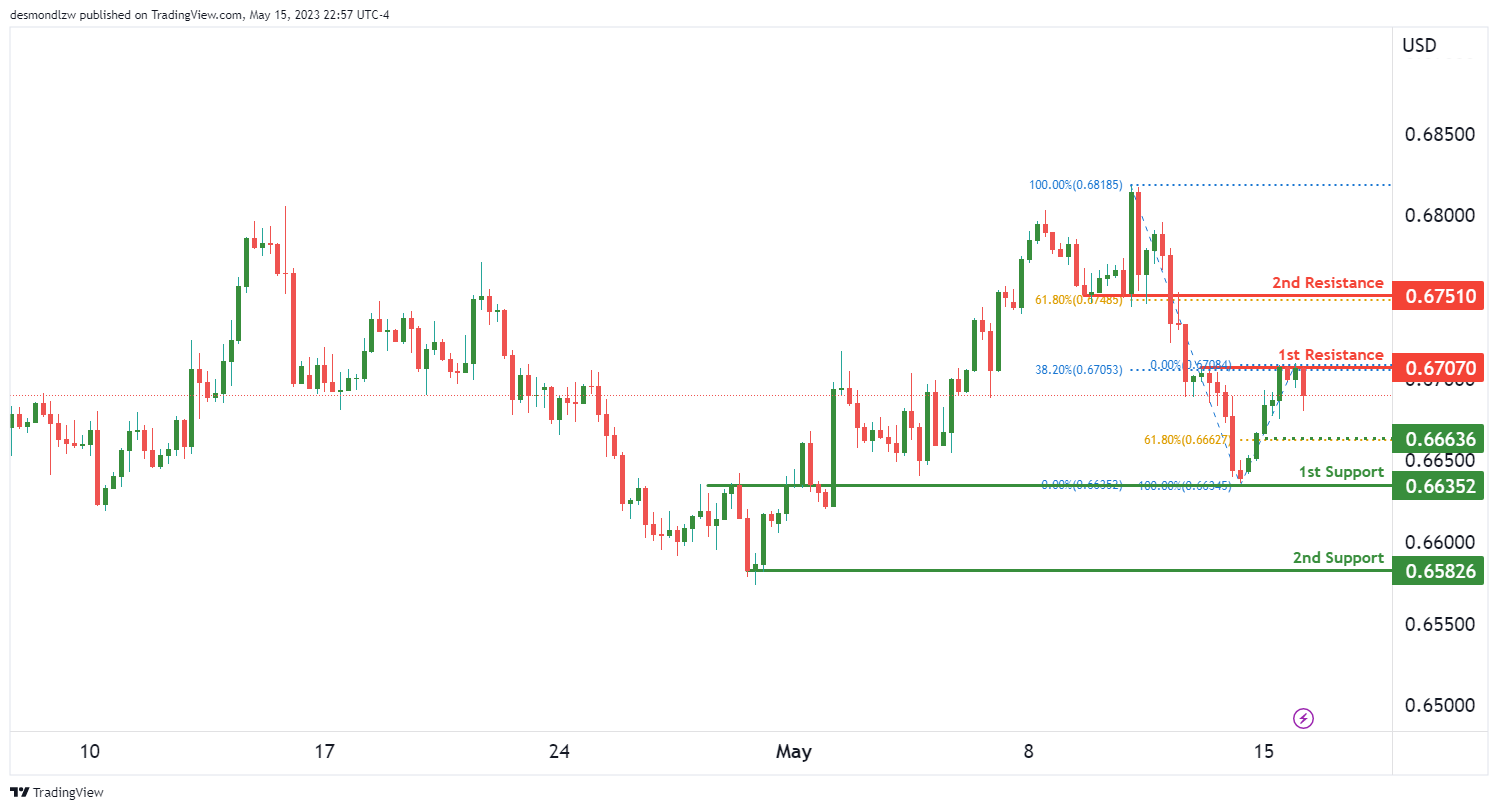
AUD/USD:
The AUD/USD pair is currently demonstrating significant bearish momentum, indicating a possible continuation of the downward trend. There’s a potential for the price to continue bearishly towards the first support level.
Our first support level is located at 0.6635, which serves as an overlap support, suggesting a strong potential for price stability at this point. A bearish continuation from the current price levels might lead the price towards this first support.
However, should the price fail to maintain above the first support, our second support at 0.6582 could come into play. This level serves as a multi-swing low support, making it a crucial level to watch for potential price rebounds.
Looking upwards, our first resistance stands at 0.6707. This level is a multi-swing high resistance and aligns with a 38.2% Fibonacci retracement, suggesting that it might present a significant barrier to any upward price movements.
Beyond the first resistance, our second resistance is at 0.6751. This level is a pullback resistance and coincides with a 61.8% Fibonacci retracement, suggesting that it could pose a significant hurdle for any potential bullish momentum.
Additionally, there is an intermediate support level at 0.6663, which aligns with a 61.8% Fibonacci retracement, further emphasizing the bearish bias of the current price movement.
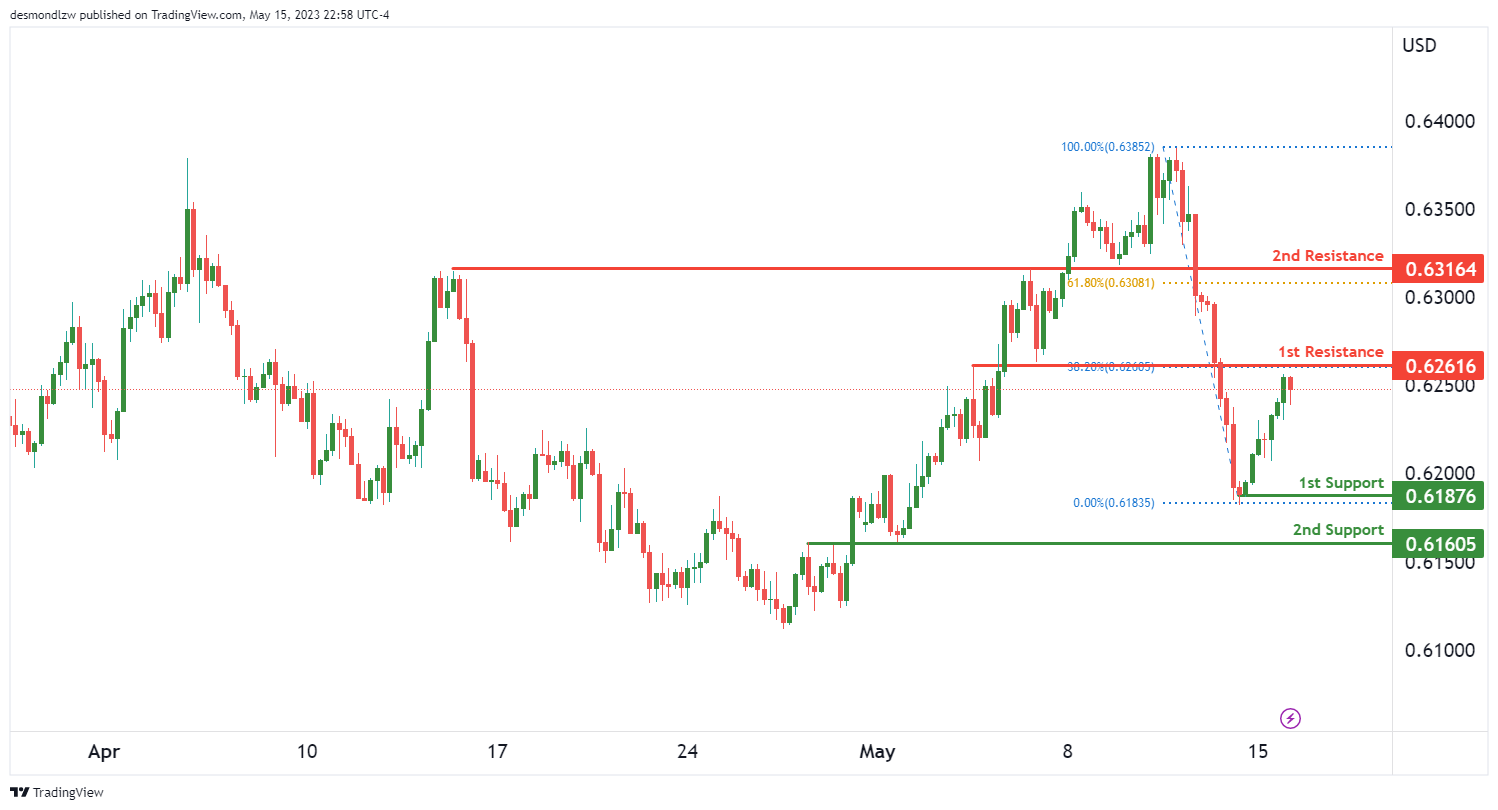
NZD/USD
The NZD/USD pair is currently showing significant bearish momentum, indicating a possible continuation of the downward trend. There’s a potential for a bearish reaction off the first resistance, leading to a drop towards the first support level.
Our first support level is located at 0.6187, functioning as a swing low support. This suggests a strong potential for price stability and may serve as a pivot for any potential bullish reversal.
However, should the price fail to maintain above the first support, our second support at 0.6160 could be activated. This level serves as an overlap support and coincides with a 38.2% Fibonacci retracement, making it a significant level to watch for potential price rebounds.
Looking upward, our first resistance is at 0.6261. This level acts as a pullback resistance and coincides with a 61.8% Fibonacci retracement, suggesting that it may present a substantial barrier to any upward price movements.
Beyond the first resistance, our second resistance is at 0.6316. This level is a pullback resistance, suggesting it could pose a significant hurdle for any potential bullish momentum.
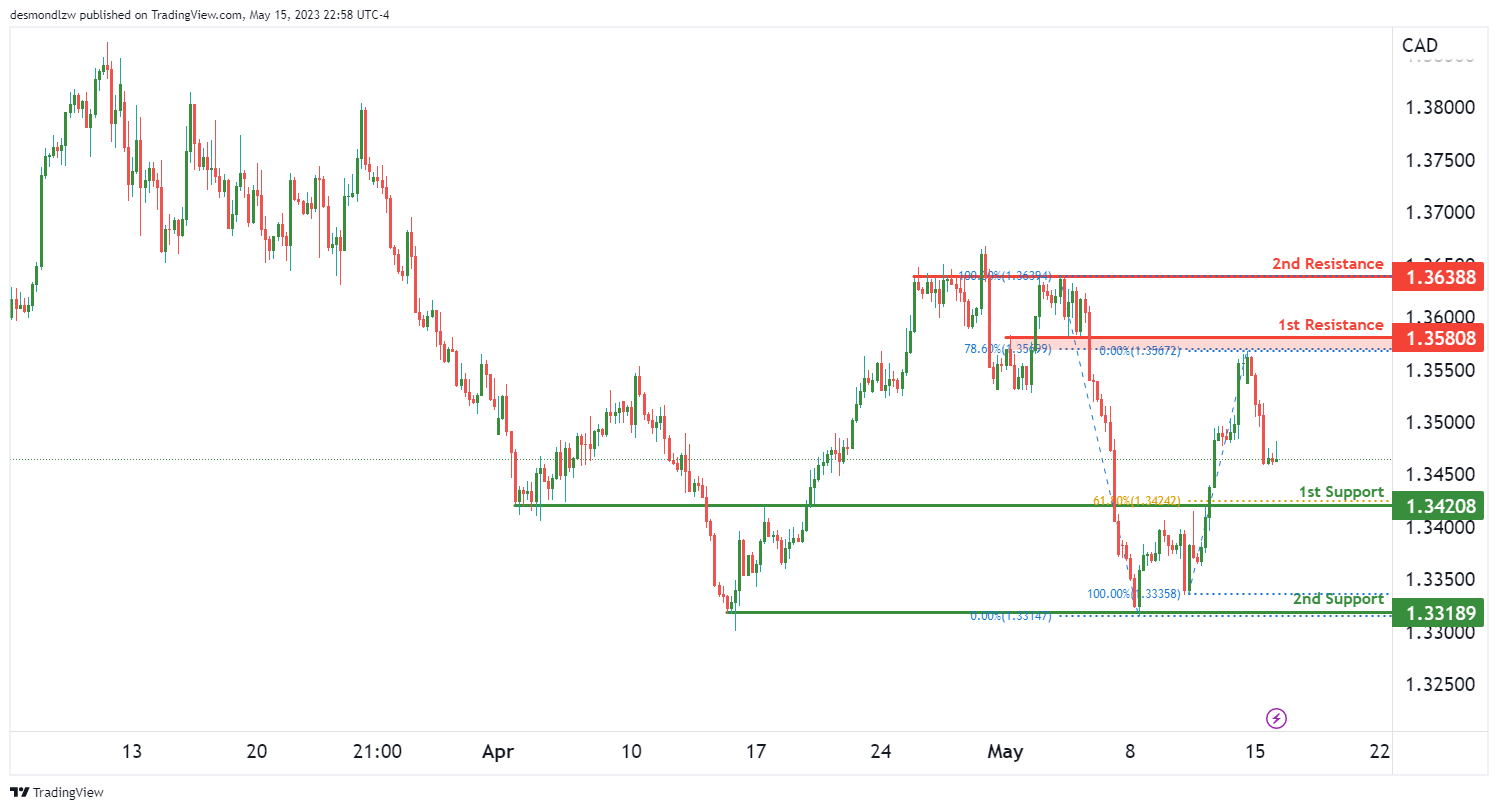
USD/CAD:
The USD/CAD pair is currently demonstrating significant bearish momentum, suggesting a possible continuation of the downward trend. There’s potential for a bearish continuation towards the first support level.
Our first support level is located at 1.3420, acting as a pullback support and coinciding with a 61.8% Fibonacci retracement. This suggests a strong potential for price stability and may serve as a pivot point for any potential bullish reversal.
However, should the price fail to hold above the first support, our second support at 1.3318 could come into play. This level serves as a multi-swing low support, making it a significant level to watch for potential price rebounds.
Looking upwards, our first resistance stands at 1.3580. This level acts as an overlap resistance and aligns with a 78.6% Fibonacci retracement, suggesting it might present a significant barrier to any upward price movements.
Beyond the first resistance, our second resistance is at 1.3638. This level is a multi-swing high resistance, suggesting it could pose a significant hurdle for any potential bullish momentum.

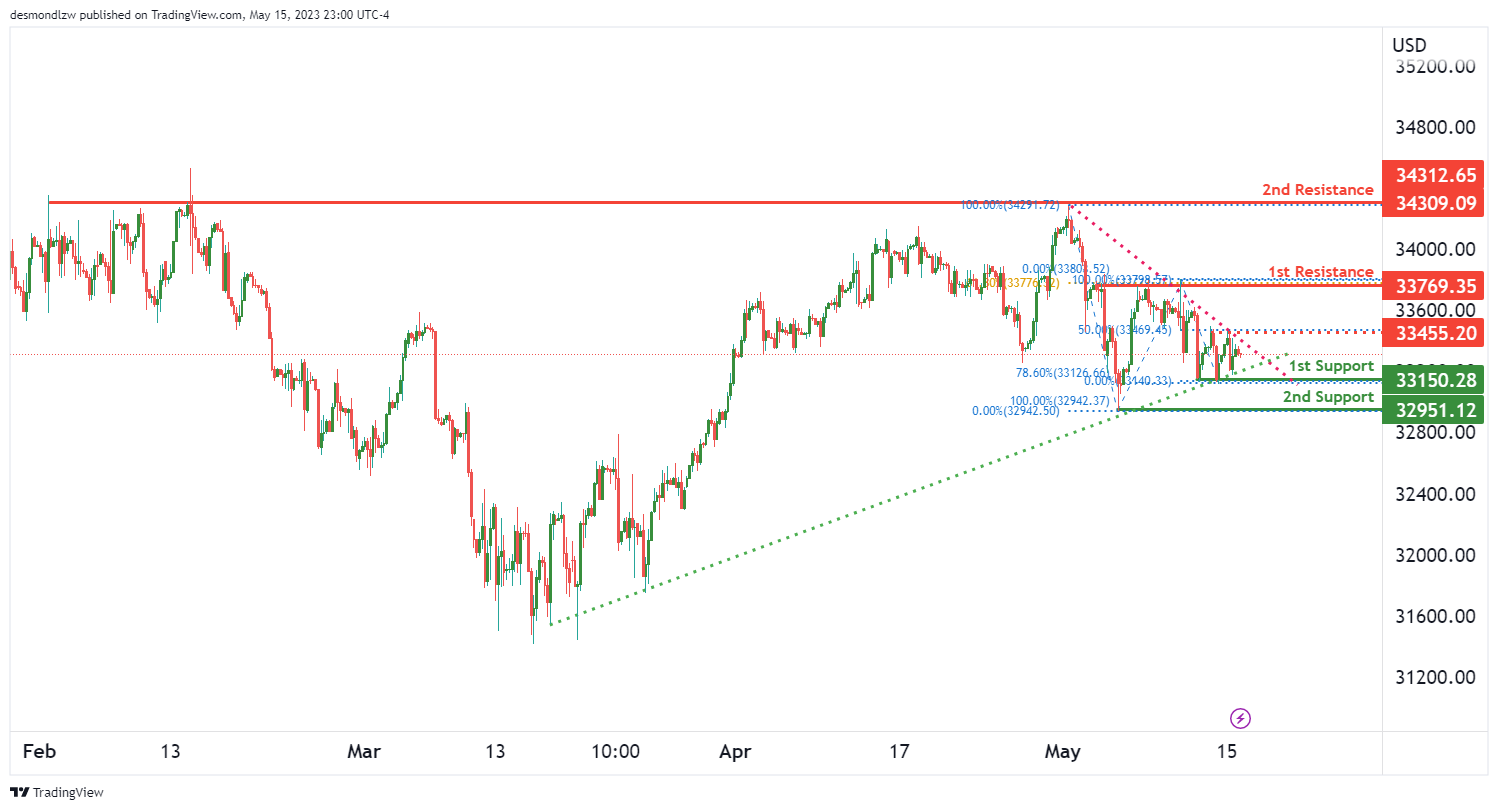
DJ30:
The Dow Jones Industrial Average (DJ30) currently exhibits a neutral momentum, leaving the market in a state of anticipation. The DJ30 might potentially fluctuate between the first resistance and the first support level, suggesting that neither the bulls nor the bears have a strong hold over the market direction.
The first support level stands at 33150.28, acting as a pullback support and aligning with a 78.6% Fibonacci retracement. This level could offer considerable support to the index, should it face any downward pressure.
Should the index breach the first support, the second support at 32951.12 could come into play. This level is a swing low support, and its significance lies in its ability to potentially halt further losses.
On the upside, the first resistance is at 33769.35, acting as a multi-swing high resistance and coinciding with a 61.8% Fibonacci retracement. This level could pose a challenge for the bulls, and any significant move above this level could signal a shift in the market sentiment.
Further up, the second resistance at 34309.09, another multi-swing high resistance, could provide a robust barrier to any sharp bullish momentum.
Intriguingly, the DJ30’s recent price action has formed a symmetrical triangle chart pattern, often seen as a period of consolidation before a significant breakout or breakdown. A break above the upper trendline of this pattern could signal a bullish breakout, while a break below the lower trendline might indicate a bearish breakdown.
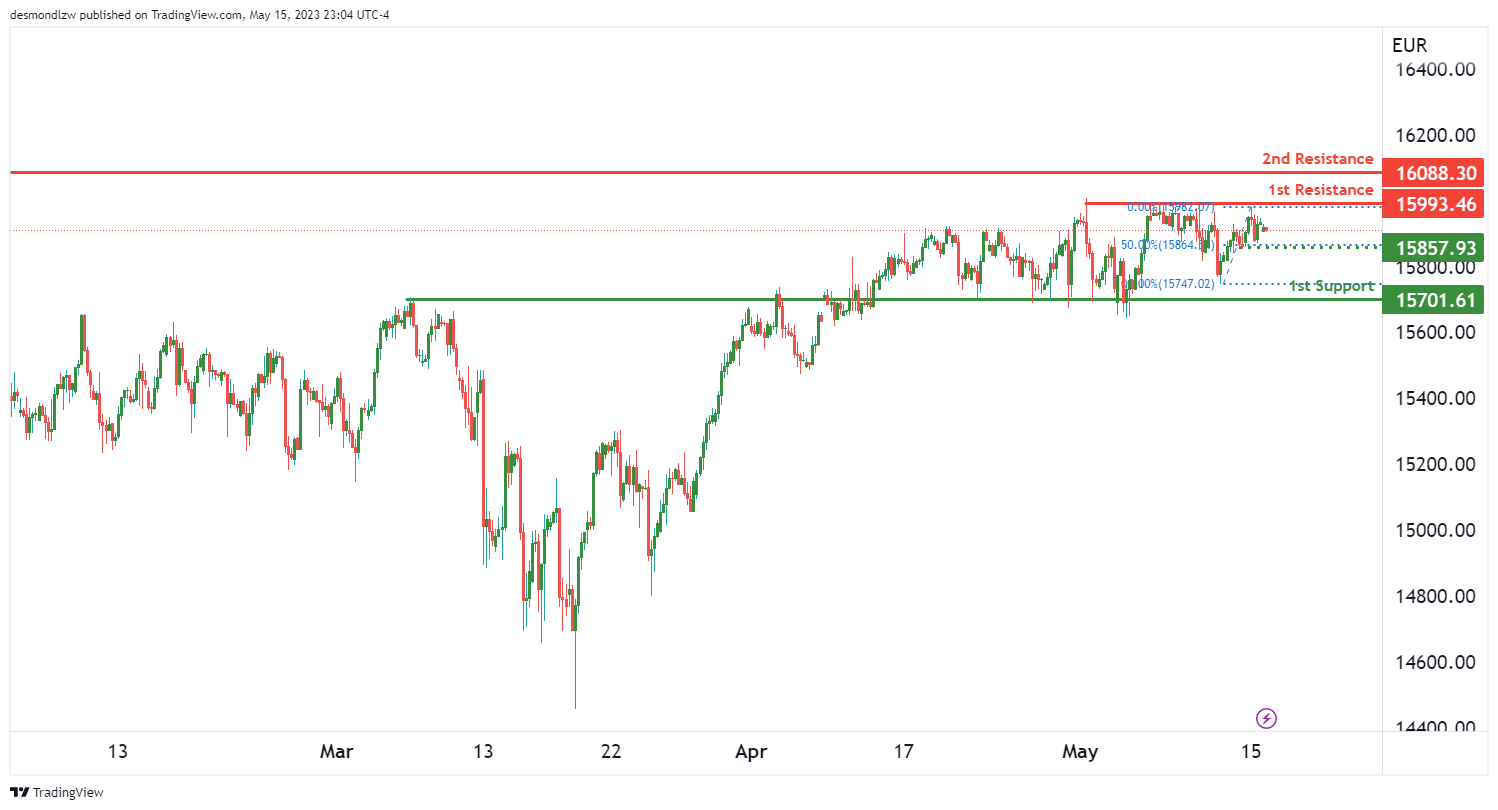
GER30:
The GER30, or the DAX 30 Index, currently finds itself in a neutral momentum, indicating an ongoing tussle between the bulls and the bears. The market might potentially see the GER30 fluctuate between the first resistance and the first support level, highlighting a state of balance between upward and downward forces.
The first support level is located at 15701.61, functioning as an overlap support. This level is significant as it represents a price point where the market previously found enough demand to halt a downward move and start an upward one. Hence, it could act as a robust floor, propping the GER30 up if downward pressures materialize.
On the upside, the first resistance stands at 15993.46, a multi-swing high resistance. This level denotes a point where the GER30 previously faced selling pressure strong enough to halt an upward move and start a downward one. It could serve as a substantial ceiling, challenging any bullish attempts to push higher.
A further upward push might encounter the second resistance at 16088.30, a swing high resistance. This level marks a previous high point on the chart, which might again attract selling pressure.
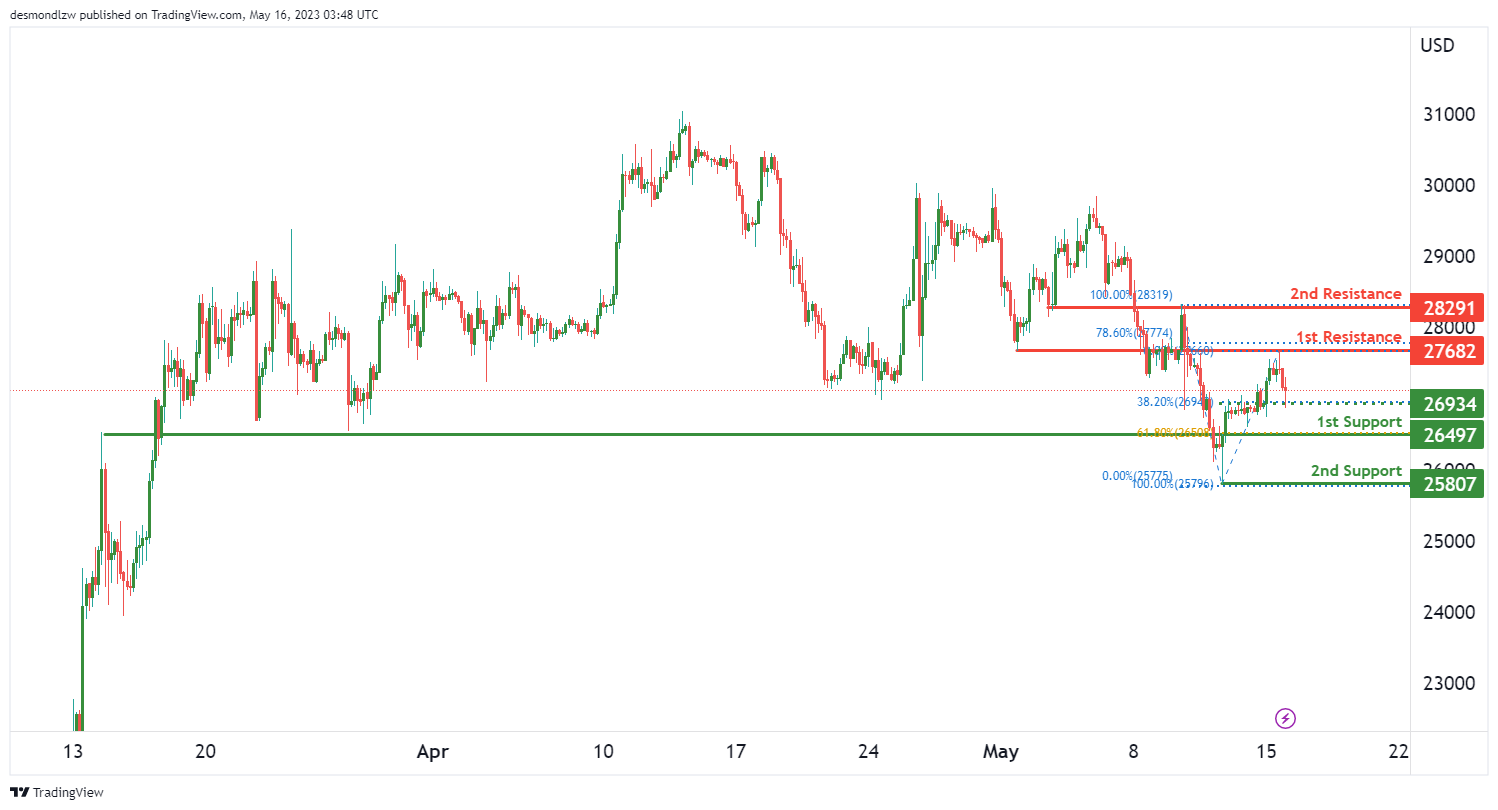
BTC/USD:
The overall momentum of the BTC/USD (Bitcoin/US Dollar) pair is currently bearish, suggesting a likely continuation of the downward move towards the first support level.
The first support is seen at 26497.00, which serves as a pullback support and aligns with the 61.80% Fibonacci retracement level. This key technical level, derived from the Fibonacci sequence, is often used by traders to anticipate areas of possible support or resistance.
A further drop could test the 2nd support at 25807.00, a level marked by a previous swing low. Here, the market had once found enough buying pressure to stop a downward trend and begin an upward move. As such, it could be a challenging barrier for the bears.
On the upside, the first resistance is placed at 27682.00, characterized as an overlap resistance and coinciding with the 78.60% Fibonacci retracement. This level denotes a previous price zone where selling pressure overcame buying pressure, hence it could potentially impede any bullish attempts.
Beyond that, the second resistance is located at 28291.00, another overlap resistance, indicating a price zone that has acted as both support and resistance in the past.
An intermediate support level is also observed at 26934.00, functioning as an overlap support and lining up with the 38.20% Fibonacci retracement. This level could act as a safety net for any steeper falls.
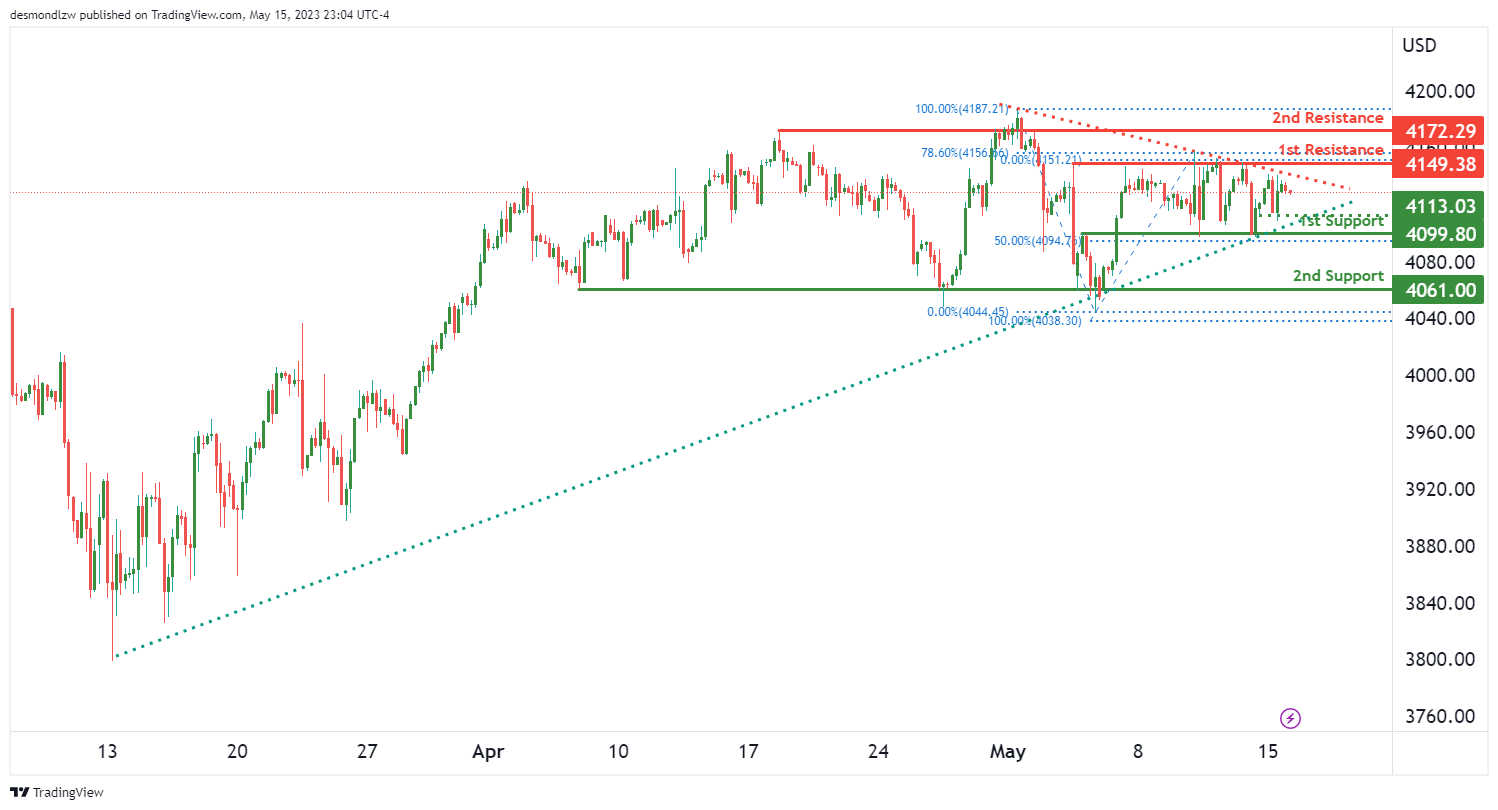
US500
The US500 index is currently demonstrating a neutral momentum, indicating that the price might fluctuate between the first resistance and the first support levels.
The first support level is located at 4099.80, an overlap support that also corresponds with the 50% Fibonacci retracement level. This convergence of key technical indicators might strengthen this level’s potential to halt any downside movement.
If the price continues to fall, the 2nd support level to watch out for is 4061.00. This level, identified as a multi-swing low support, has acted as a floor for the price in the past, suggesting a potential area where buying interest could resurface.
On the upside, the first resistance is placed at 4149.38. This level is characterized as a multi-swing high resistance and aligns with the 78.60% Fibonacci retracement, implying it could pose a significant hurdle for bullish attempts.
Further up, the second resistance is found at 4172.29. This overlap resistance level, where the price has previously alternated between support and resistance, could further limit upside potential.
An intermediate support level is also observed at 4113.03, serving as a swing low support that could offer a temporary resting spot for the price during a potential downward move.
The presence of a symmetrical triangle chart pattern suggests a period of consolidation. This pattern typically precedes a breakout or breakdown. A break above the pattern’s upper trendline might indicate a bullish breakout, while a break below could signal a bearish breakdown.
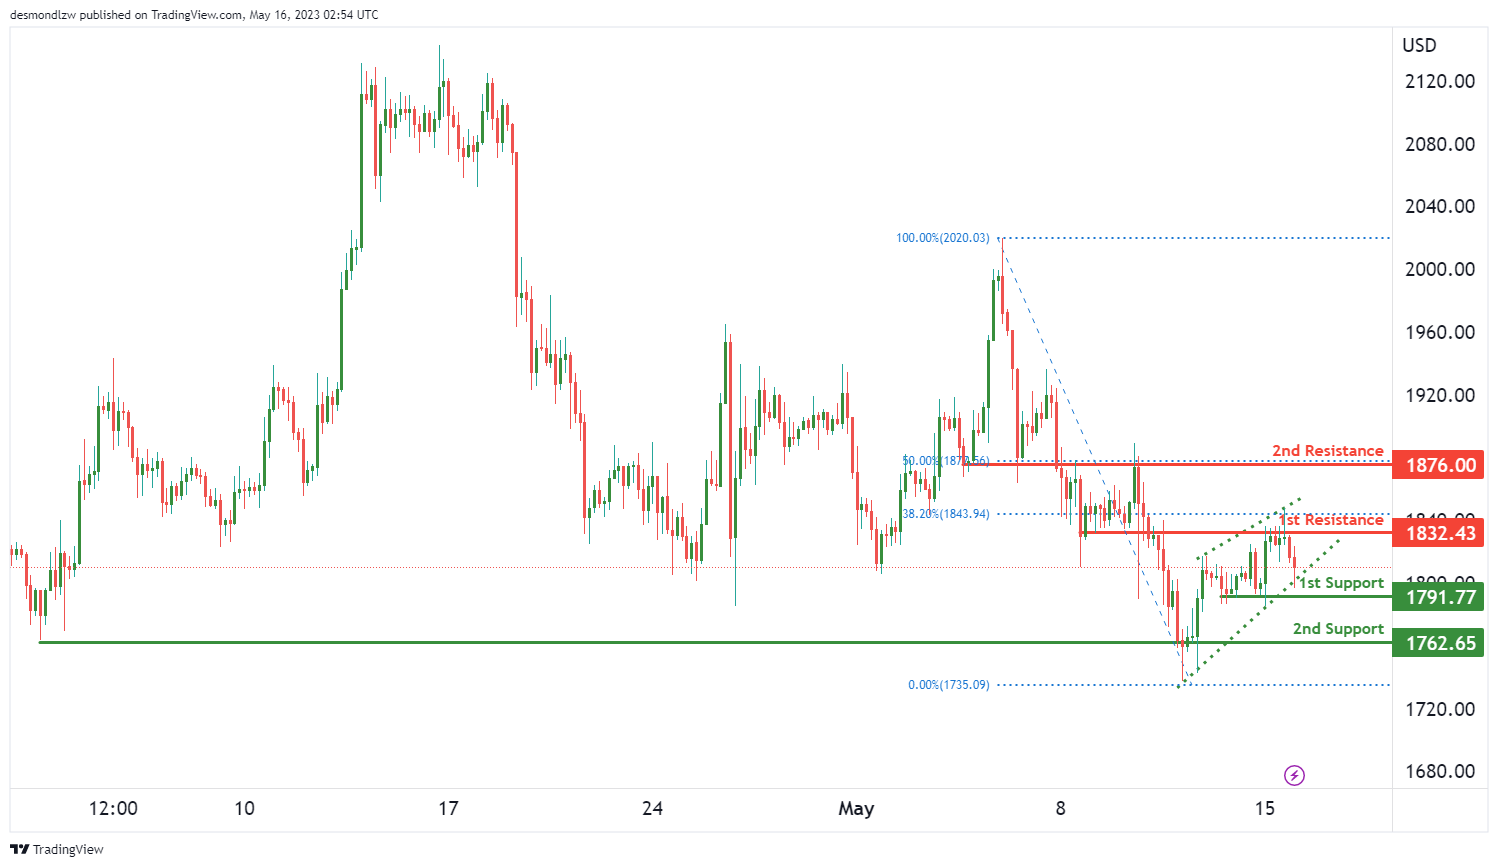
ETH/USD:
Ethereum’s recent price action against the US Dollar (ETH/USD) indicates a bearish momentum, suggesting a potential bearish reaction off the first resistance level and a subsequent drop towards the first support.
The first level of support is found at 1791.77. This multi-swing low support has been tested multiple times in the past, making it a critical level to watch. Should the price action respect this level, we could see a bounce back upwards. However, a break below this support could see the price slide further to the second support at 1762.65, another well-tested multi-swing low support level.
On the upside, the first resistance level is at 1832.43. This overlap resistance, which aligns with the 38.20% Fibonacci retracement level, could pose a significant barrier to bullish price action. Any upside movement could be capped at this point, potentially driving the price back towards support levels.
Further up, the second resistance level is at 1876.00. This is another overlap resistance and coincides with the 50% Fibonacci retracement level, suggesting a significant area of potential sell pressure.
Importantly, the chart pattern indicates a bearish rising wedge formation. This type of wedge pattern is typically bearish, signaling that the price is likely to drop and move in the downward direction soon.
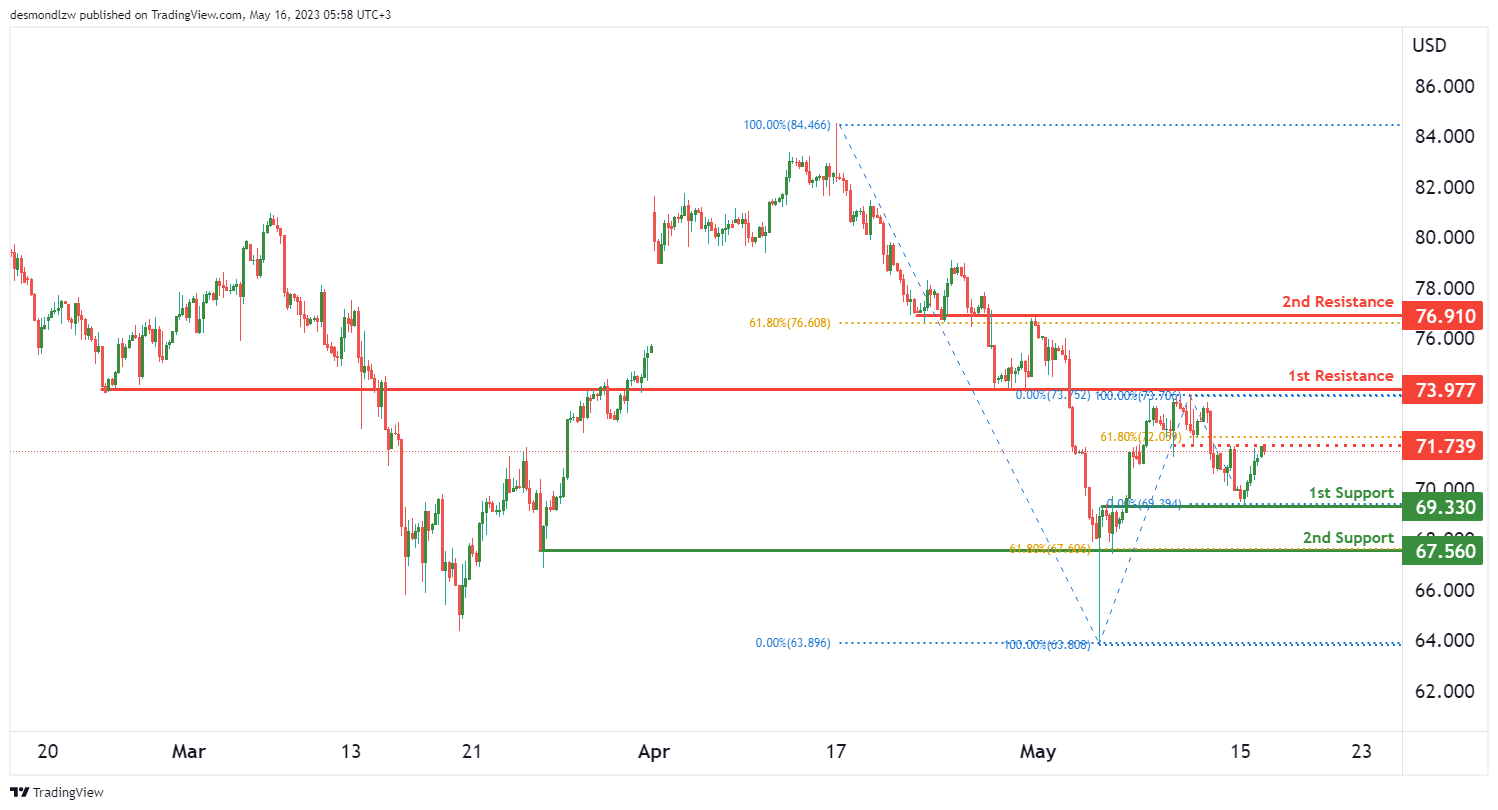
WTI/USD:
The current chart for West Texas Intermediate (WTI) Crude Oil suggests a bearish momentum, with the price potentially making a bearish continuation towards the first support level.
The first support level to watch for is at $69.33, an overlap support that has proven to be a significant level in the past. If this support holds, it could lead to a price bounce. However, if the price breaks through this level, it could fall further towards the second support at $67.56, which is a multi-swing low support level.
On the upside, the first resistance level is at $73.97. This overlap resistance coincides with the 38.20% Fibonacci retracement level, potentially posing a challenge for any bullish momentum. If the price reaches this level and fails to break through, we could see a reversal towards the support levels.
Higher still, the second resistance level is at $76.91, another overlap resistance that aligns with the 61.80% Fibonacci retracement level. This could be a significant hurdle for any bullish price movement, potentially driving the price back down.
In between these levels, there’s an intermediate resistance at $71.73, which is also an overlap resistance and matches up with the 61.80% Fibonacci retracement level. This level could act as a minor barrier to upward price action.
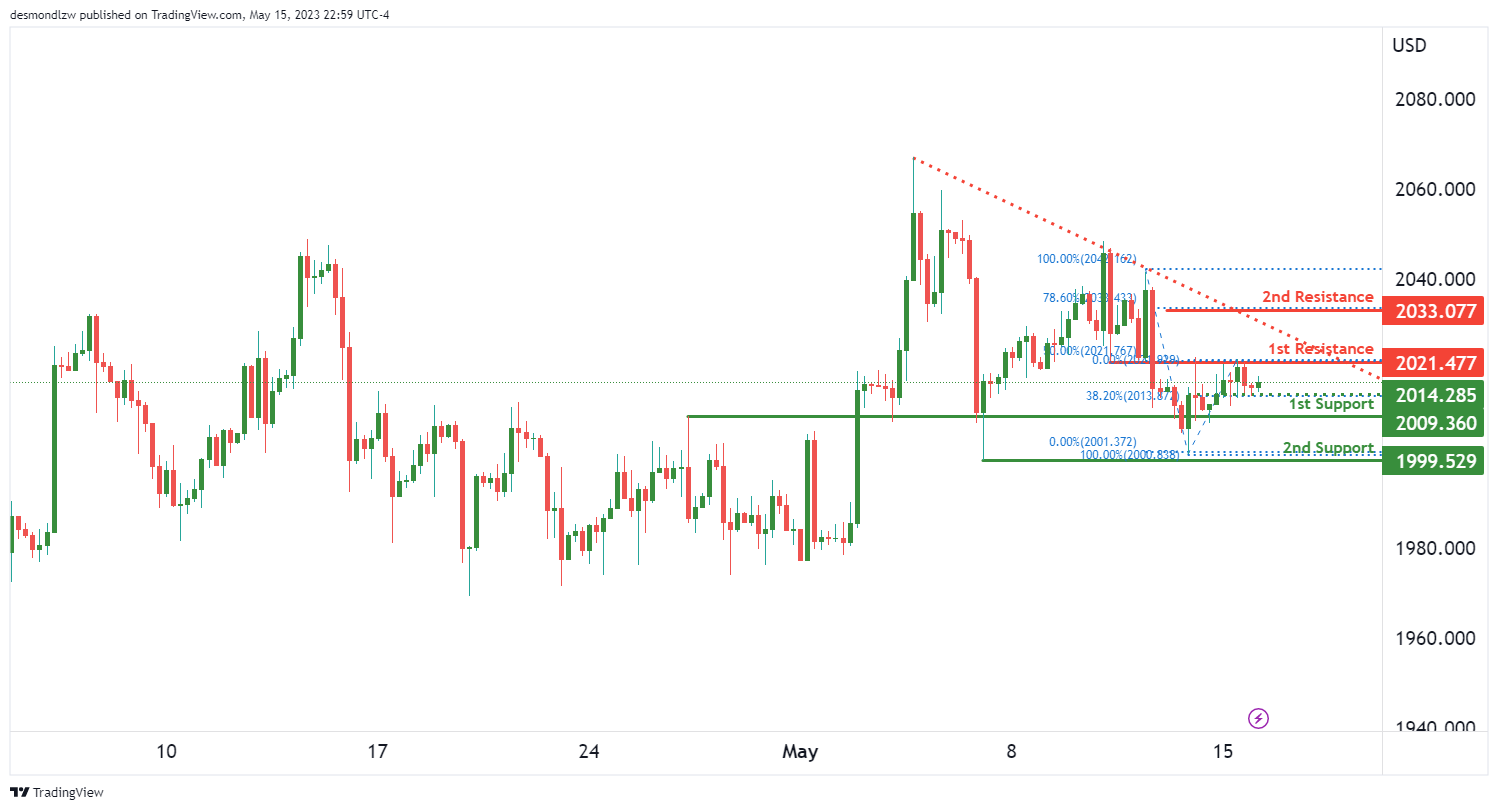
XAU/USD (GOLD):
The overall momentum of the Gold (XAU/USD) chart is bearish. Factors contributing to this bearish momentum include the price being below a major descending trend line, suggesting further downward momentum is likely.
Given the current market conditions, the price could potentially continue its downward move towards the first support level.
The first support level is at $2009.36, which is an overlap support. This support level has been tested multiple times in the past, making it a significant level for traders to watch.
If the price continues to fall, the next level to watch would be the second support at $1999.52. This level has acted as a multi-swing low support and could potentially halt further downward movement.
On the upside, the first resistance is at $2021.47. This level is an overlap resistance and aligns with the 50% Fibonacci retracement level, making it a significant barrier for any bullish price movements.
The second resistance is at $2033.07, which corresponds to the 78.60% Fibonacci retracement level. This level could act as a strong barrier for price, making it difficult for bullish momentum to continue.
The intermediate support level is at $2014.28, which is an overlap support and corresponds with the 38.20% Fibonacci retracement level. This level could potentially act as a stopping point for price during a bearish retracement.


