
DXY:
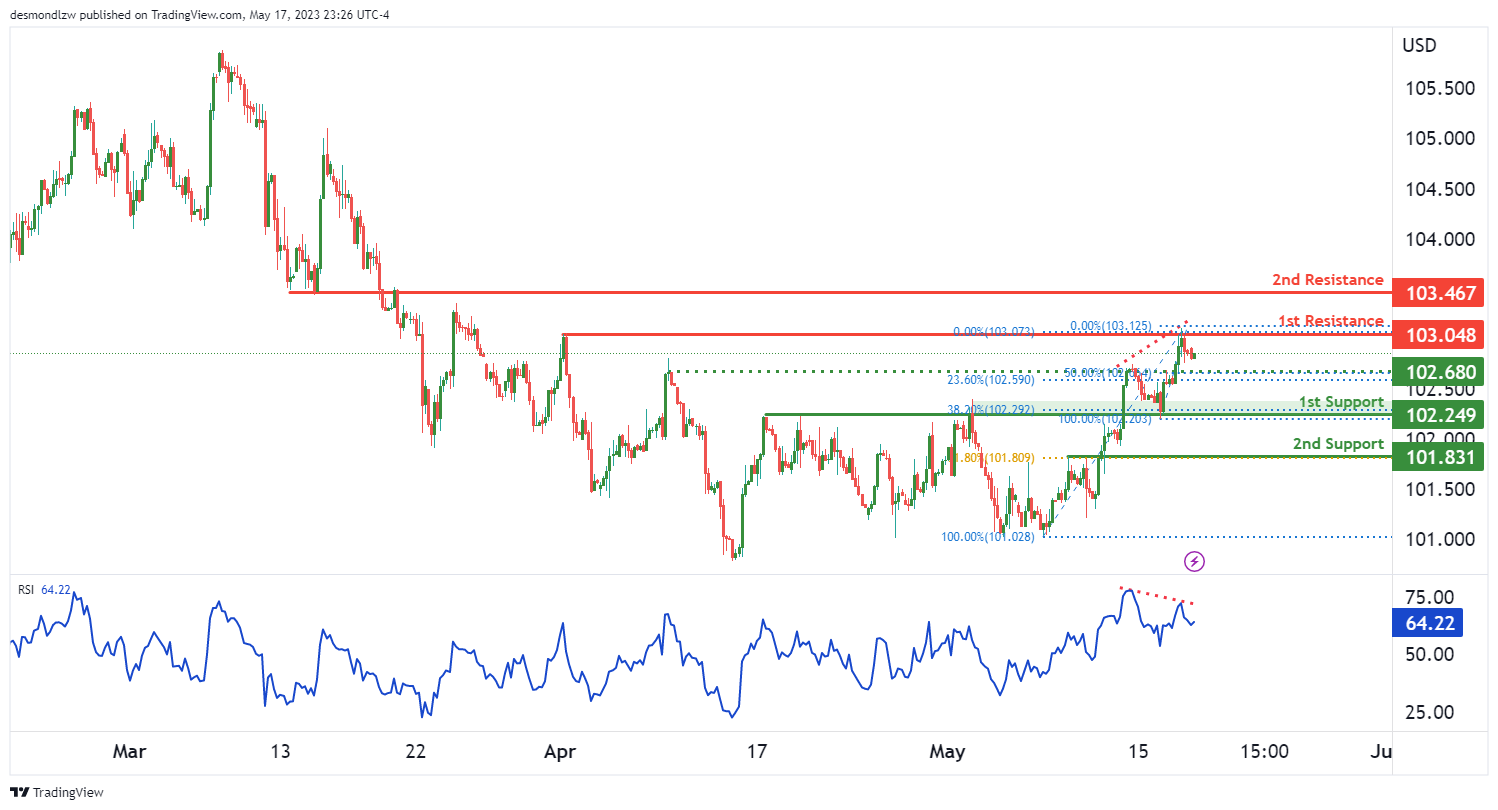
The DXY (US Dollar Index) chart currently indicates bearish momentum, suggesting the potential for further downward movement.
In the near term, there is a possibility of a bearish continuation towards the first support level at 102.24. This level is recognized as an overlap support and coincides with a 38.20% Fibonacci retracement, enhancing its significance.
Additional support can be found at the second support level of 101.83, which is identified as a pullback support and aligns with a 61.80% Fibonacci retracement.
On the resistance side, the first resistance level is at 103.04, characterized as a multi-swing high resistance. There is also a second resistance level at 103.46, considered an overlap resistance.
Furthermore, an intermediate support level at 102.68 is observed, serving as a pullback support. This level exhibits a Fibonacci confluence, with a 23.60% Fibonacci retracement and a 50% Fibonacci retracement.
Supporting the bearish case is the bearish divergence displayed by the RSI indicator compared to the price. This suggests the potential for a rapid decline in price.
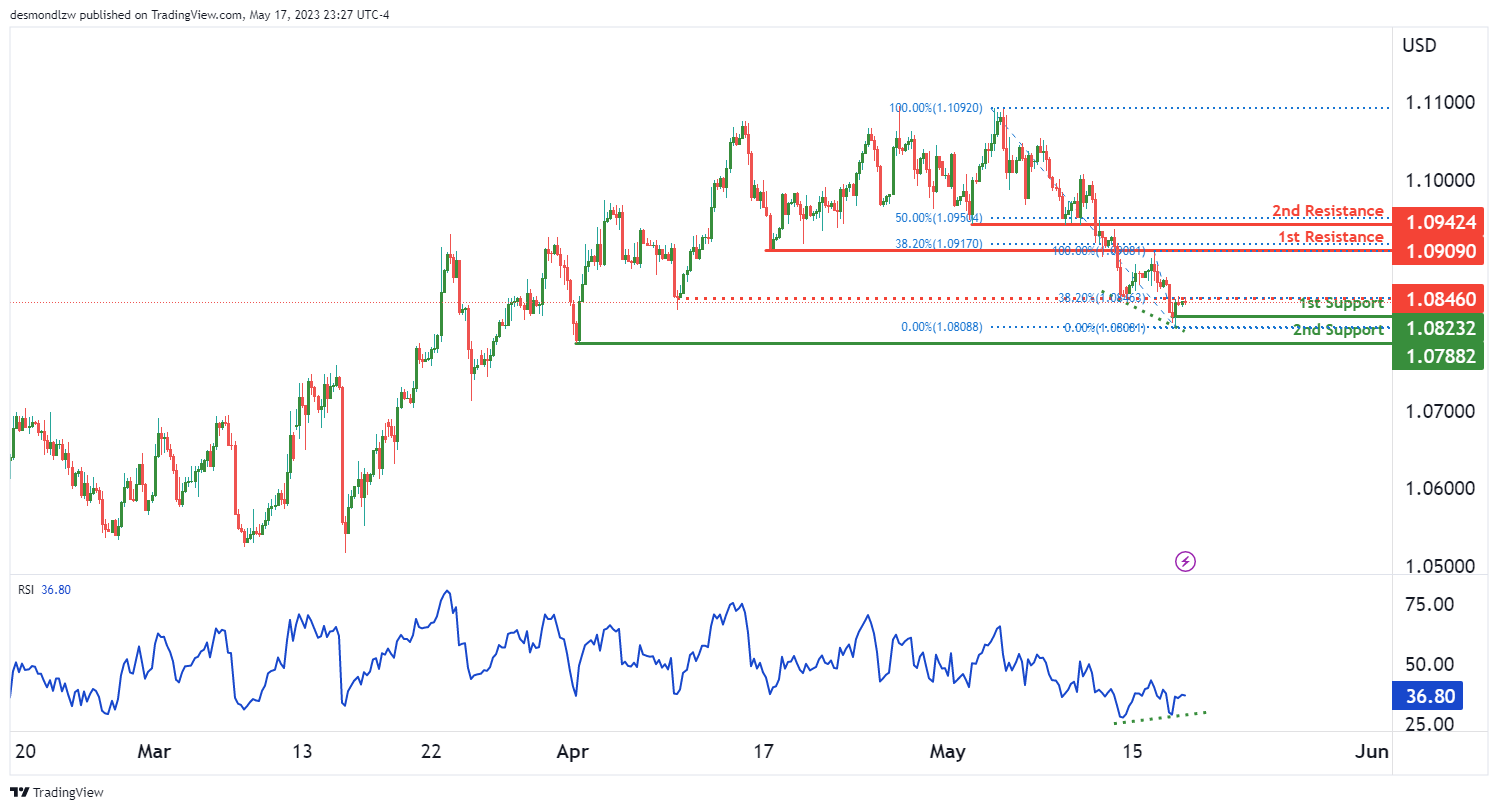
EUR/USD:
The EUR/USD chart currently demonstrates bullish momentum, indicating the potential for further upward movement.
In the near term, there is a possibility of a bullish continuation towards the first resistance level at 1.0909. This level is characterized as an overlap resistance and coincides with a 38.20% Fibonacci retracement, adding to its significance.
Support levels are also present to provide potential price floors. The first support level is at 1.0823, identified as a swing low support. Additionally, the second support level is at 1.0788, also recognized as a swing low support.
Furthermore, there is an intermediate resistance level at 1.0846, which is an overlap resistance. This level aligns with a 38.20% Fibonacci retracement, further reinforcing its importance.
An additional factor supporting the bullish case is the bullish divergence observed in the RSI indicator when compared to the price. This suggests the potential for a rapid increase in price.
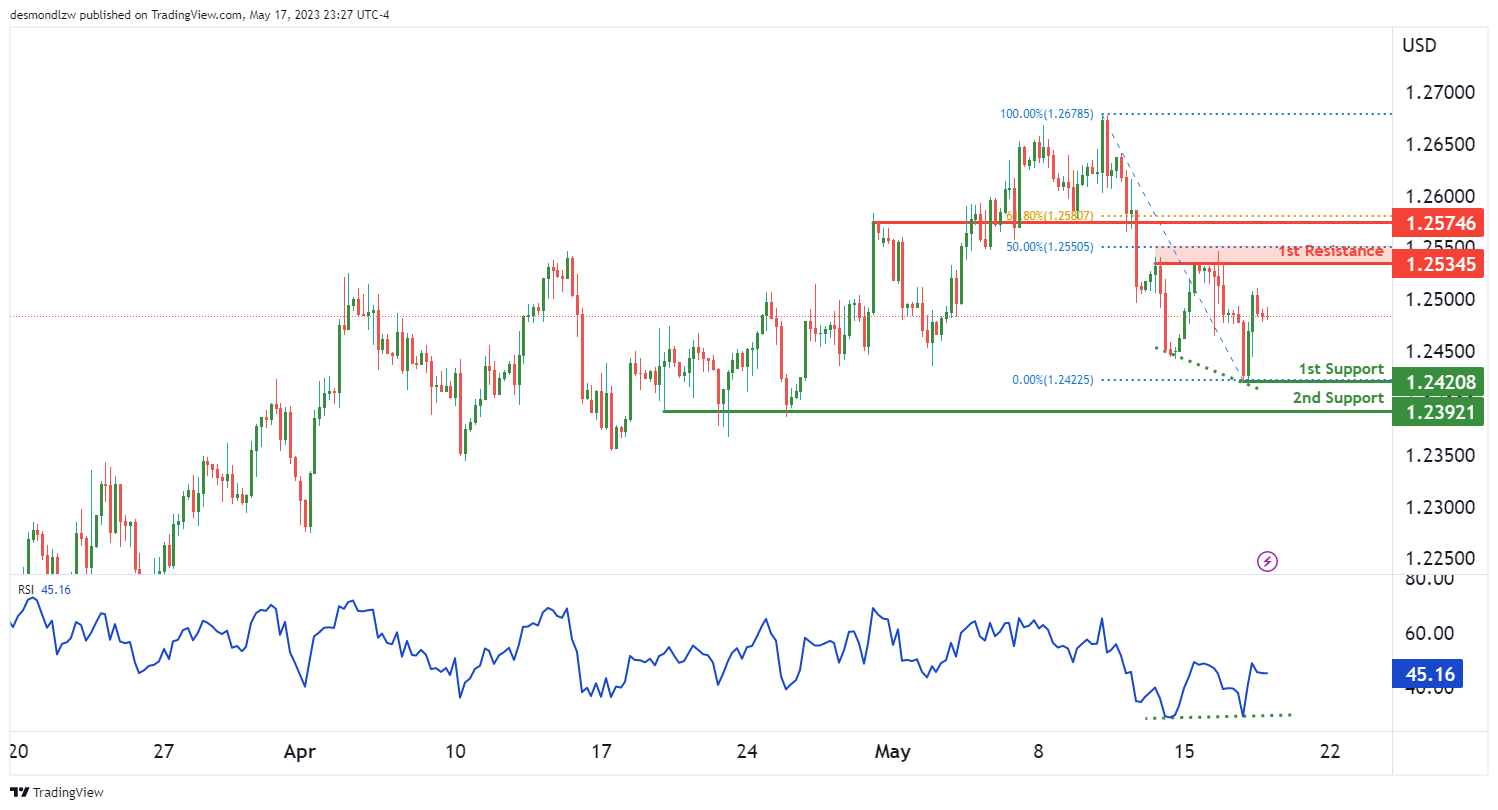
GBP/USD:
The GBP/USD chart currently exhibits bullish momentum, indicating the potential for further upward movement.
In the near term, there is a possibility of a bullish continuation towards the first resistance level at 1.2534. This level is identified as a multi-swing high resistance and coincides with a 50% Fibonacci retracement, adding to its significance.
Additional support can be found at the second support level of 1.2574, which is recognized as a pullback resistance and aligns with a 61.80% Fibonacci retracement.
On the support side, the first support level is at 1.2420, characterized as a swing low support. There is also a second support level at 1.2392, identified as a multi-swing low support.
In support of the bullish case, the RSI indicator displays bullish divergence compared to the price. This suggests the likelihood of a rapid increase in price.
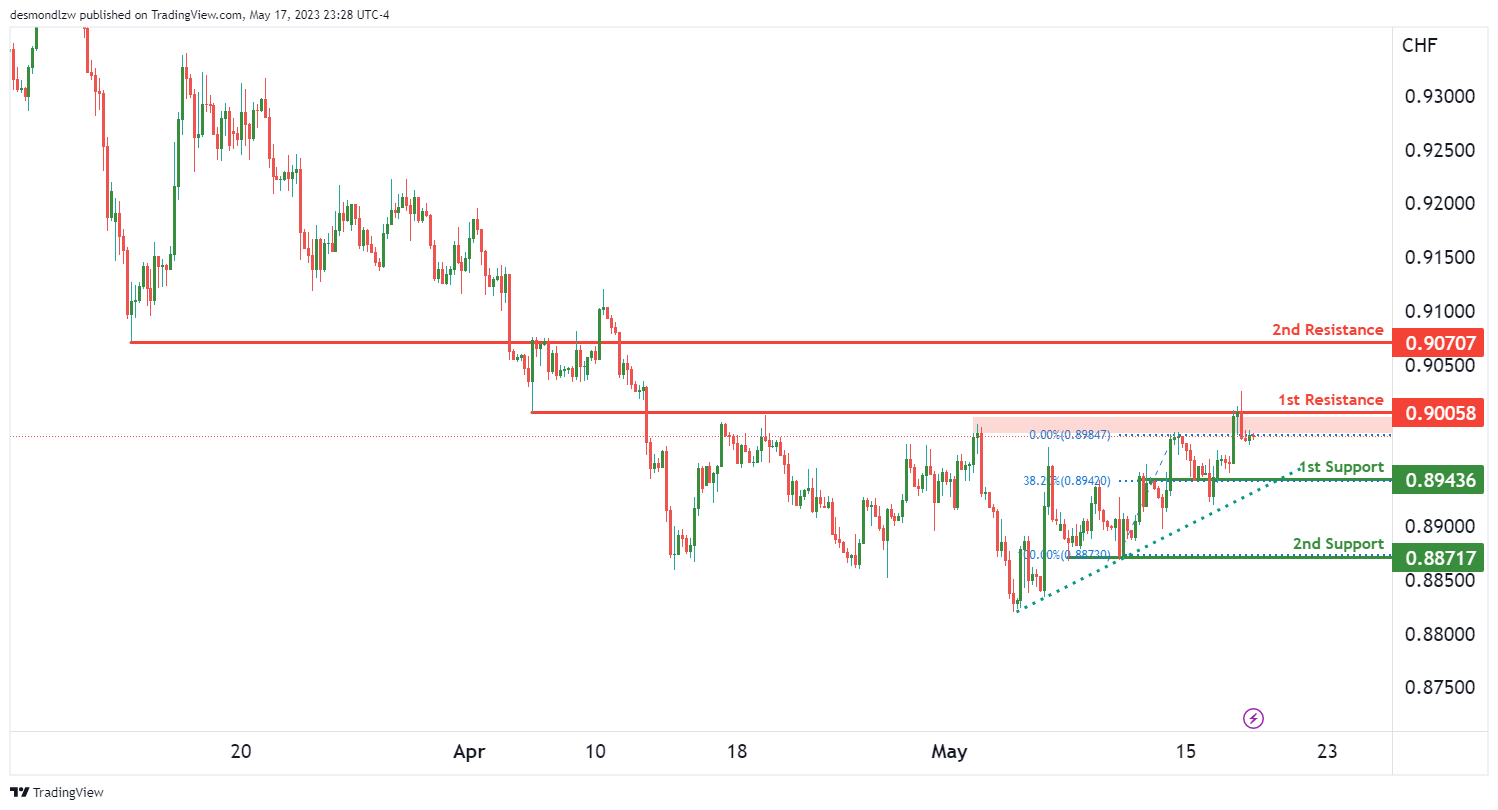
USD/CHF:
The USD/CHF chart currently demonstrates bullish momentum, with price positioned above a major ascending trend line, suggesting the potential for further upward movement.
In the short term, there is a possibility of a drop towards the first support level at 0.8943 before bouncing from that level and rising towards the first resistance.
The first support level at 0.8943 is identified as an overlap support and coincides with a 38.20% Fibonacci retracement, indicating its significance as a potential price floor.
In the event of a further drop, the second support level at 0.8871 can provide additional support. This level is recognized as a multi-swing low support.
On the resistance side, the first resistance level at 0.9950 is an overlap resistance level. Further upward movement could encounter resistance at this level.
There is also a second resistance level at 0.9070, identified as a pullback resistance, which may pose additional hurdles for the price.
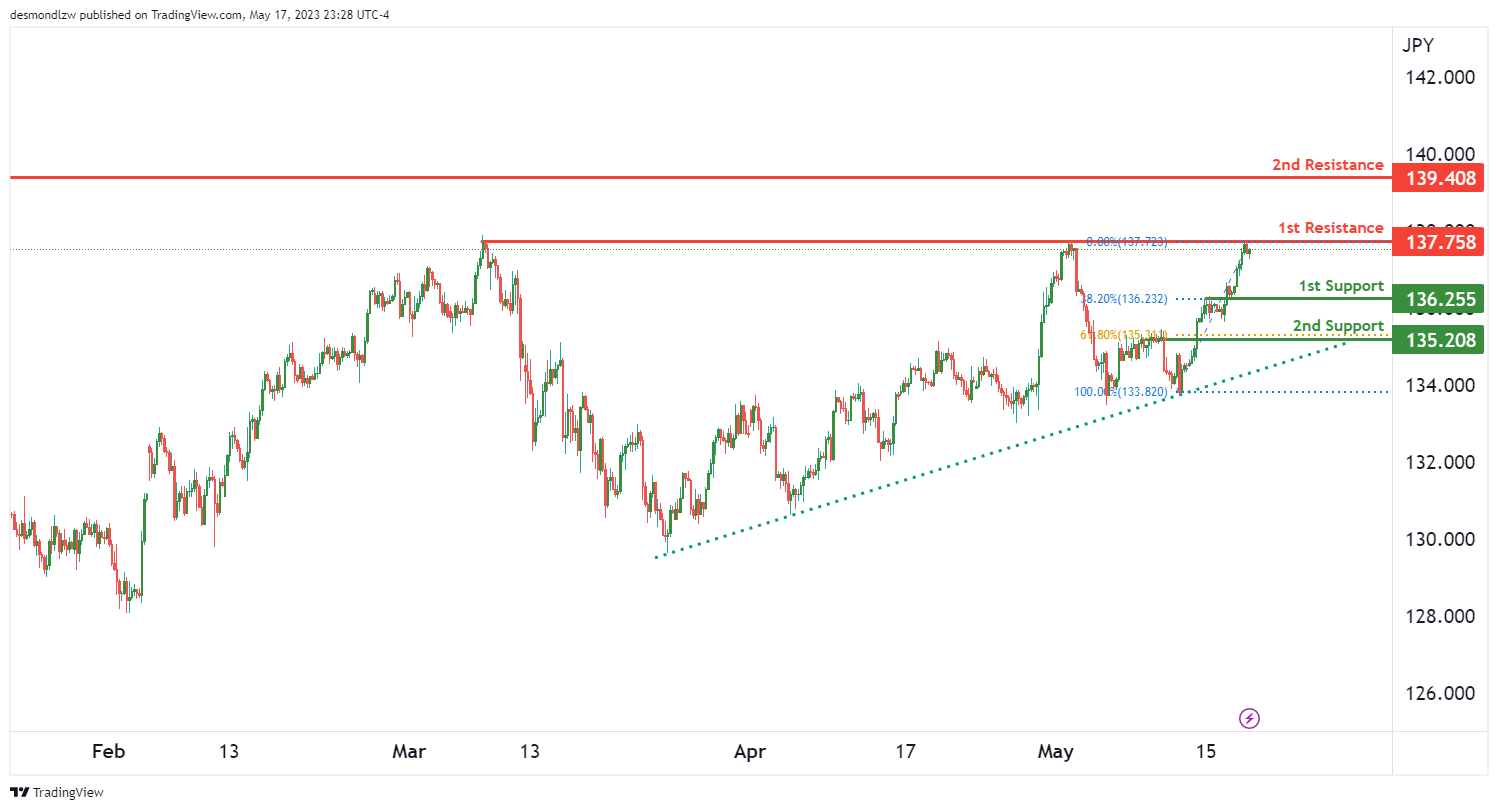
USD/JPY:
The USD/JPY chart is currently showing bullish momentum, with price positioned above a major ascending trend line, suggesting the potential for further upward movement.
In the short term, there is a possibility of a drop towards the first support level at 136.25 before bouncing from that level and rising towards the first resistance.
The first support level at 136.25 is identified as an overlap support and coincides with a 38.20% Fibonacci retracement, indicating its significance as a potential price floor.
In the event of a further drop, the second support level at 135.20 can provide additional support. This level is recognized as a pullback support and coincides with a 61.80% Fibonacci retracement.
On the resistance side, the first resistance level at 137.75 is an overlap resistance level. Further upward movement could encounter resistance at this level.
There is also a second resistance level at 139.40, which is a swing high resistance. This level may pose a significant hurdle for the price.
Considering these factors, the overall momentum of the USD/JPY chart is bullish, suggesting the potential for a drop towards the first support level before a bounce and subsequent rise towards the first resistance level.
AUD/USD:
The AUD/USD chart is currently displaying bullish momentum, indicating the potential for further upward movement.
In line with this bullish momentum, there is a possibility of a bullish continuation towards the first resistance level at 0.6707.
To support this potential upward movement, there are two levels of support. The first support level is at 0.6635, identified as an overlap support. This level may provide a price floor and support any potential pullbacks.
The second support level is at 0.6582, recognized as a swing low support. This level also contributes to the overall bullish bias.
On the resistance side, the first resistance level at 0.6707 is a multi-swing high resistance level. If the price continues to rise, it may encounter resistance at this level.
Additionally, there is a second resistance level at 0.6750, identified as a pullback resistance. This level, coinciding with a 61.80% Fibonacci retracement, could present a stronger barrier for the price.

NZD/USD
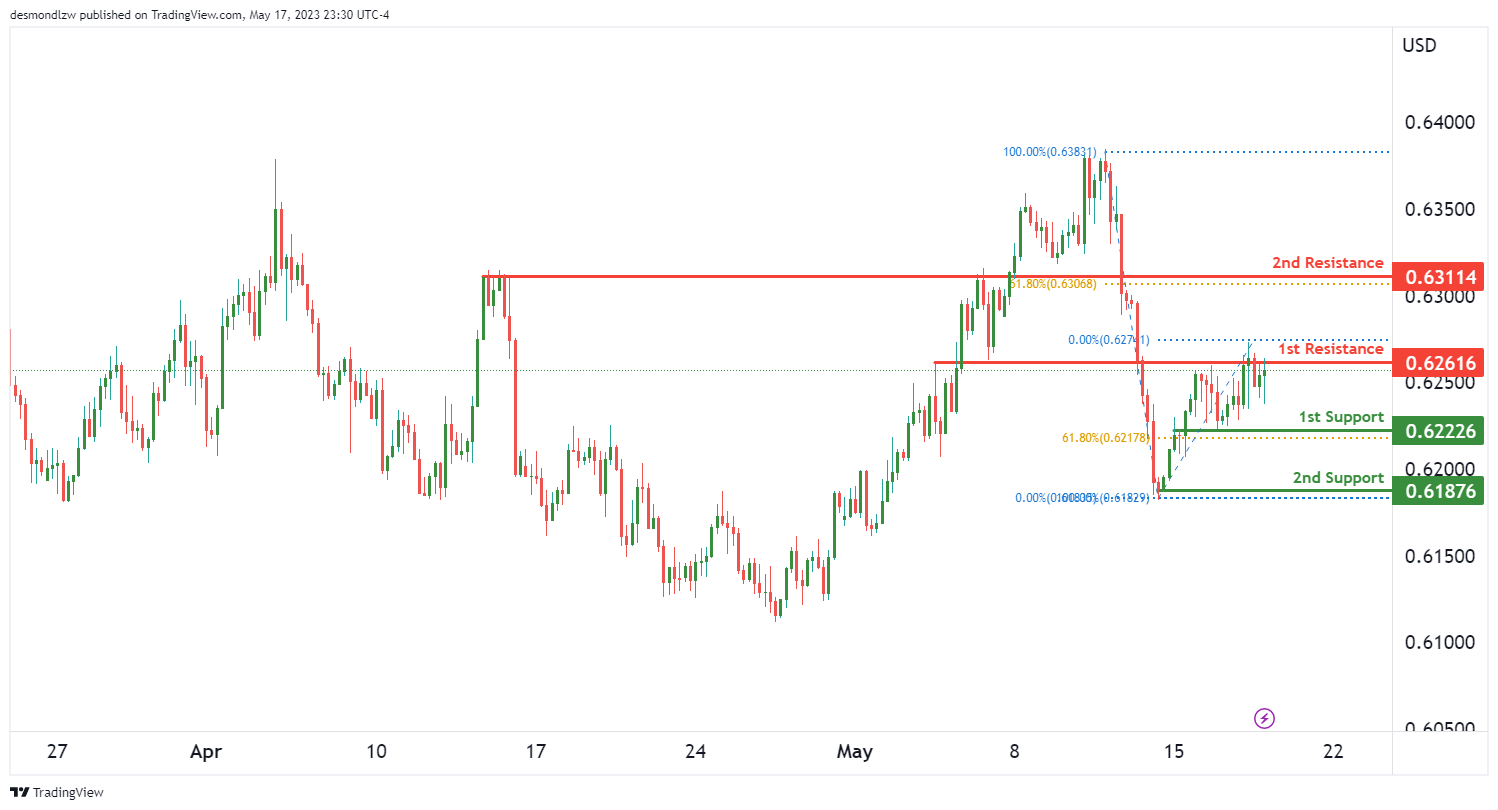
The NZD/USD chart is currently exhibiting bullish momentum, indicating the potential for further upward movement.
In the short term, there is a possibility of a drop towards the first support level at 0.6222. This support level is identified as an overlap support and coincides with a 61.80% Fibonacci retracement, suggesting it could act as a strong price floor.
If the price reaches the first support and bounces from there, it could potentially rise towards the first resistance level at 0.6261. This resistance level is recognized as an overlap resistance.
Furthermore, there is a second support level at 0.6187, identified as a multi-swing low support, which provides additional support if the price were to drop further.
On the resistance side, the second resistance level at 0.6311 is a pullback resistance. This level, coinciding with a 61.80% Fibonacci retracement, could present a stronger barrier for the price.
Overall, the momentum of the NZD/USD chart is bullish, suggesting the potential for a drop to the first support level in the short term, followed by a bounce and a rise towards the first resistance level.

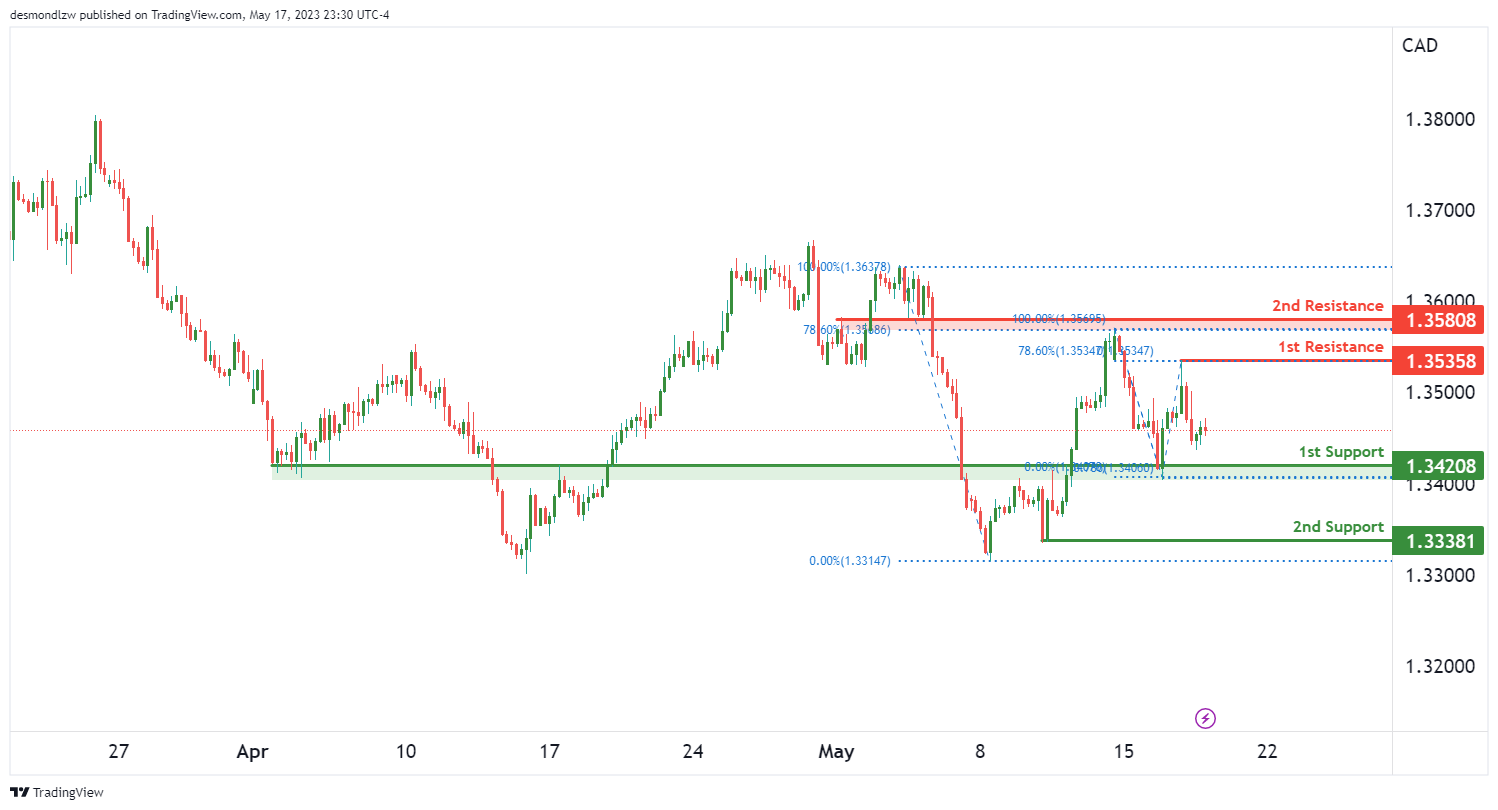
USD/CAD:
The USD/CAD chart is currently exhibiting bullish momentum, indicating the potential for further upward movement.
In the short term, there is a possibility of a bullish continuation towards the first resistance level at 1.3535. This resistance level is identified as a swing high resistance and coincides with a 78.60% Fibonacci retracement, suggesting it could pose a significant challenge for the price.
On the support side, the first support level at 1.3420 is recognized as an overlap support. This level may provide support if the price were to drop.
Additionally, there is a second support level at 1.3338, identified as a swing low support, which provides further support if the price were to drop.
For further upward movement, the second resistance level at 1.3580 is a pullback resistance. This level, coinciding with a 78.60% Fibonacci retracement, could present a stronger barrier for the price.
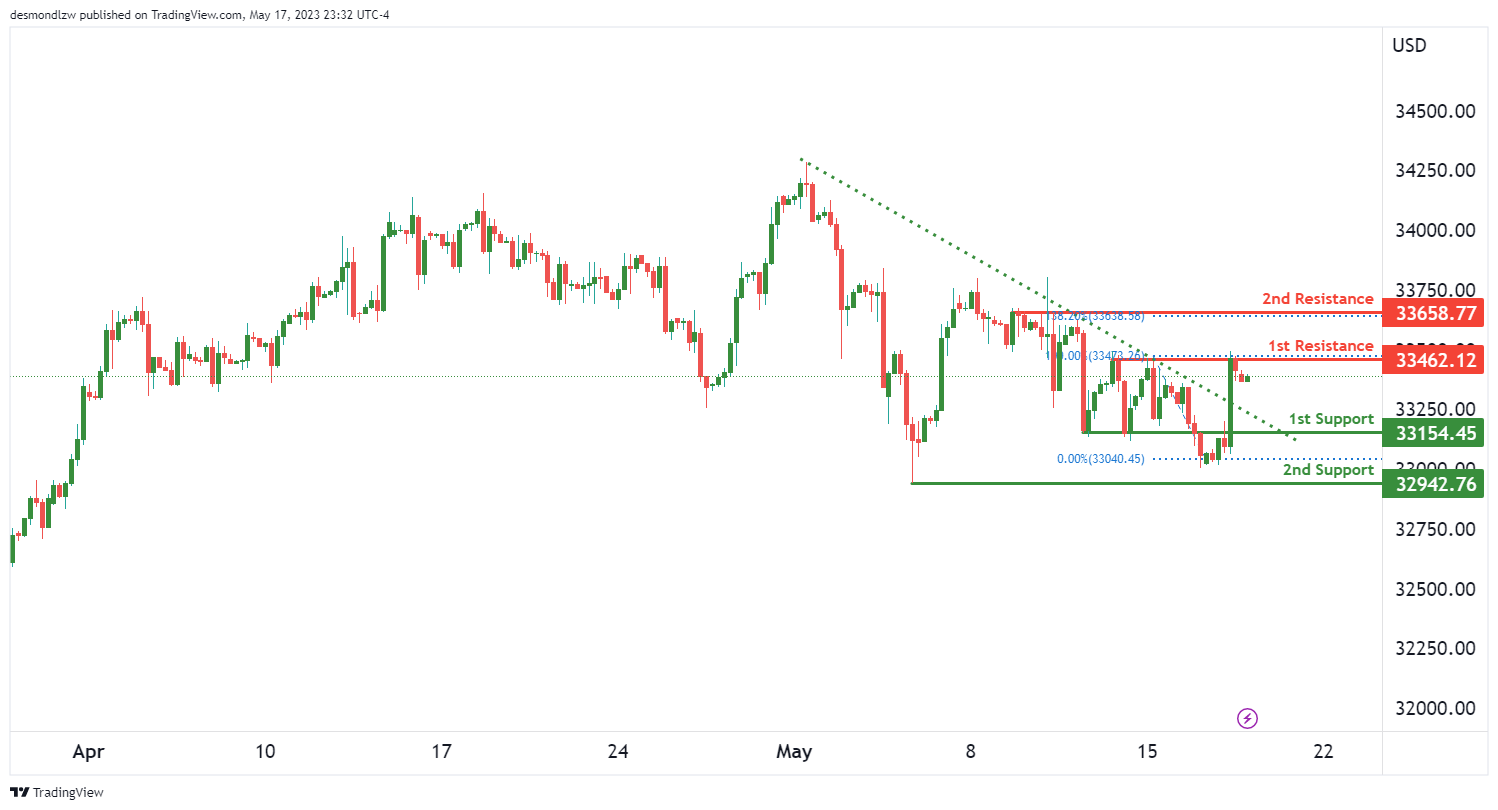
DJ30:
The DJ30 (Dow Jones Industrial Average) chart is currently displaying bullish momentum, suggesting the potential for further upward movement.
One of the factors contributing to this momentum is that the price has broken above a descending resistance line, triggering a potential bullish move.
In terms of potential price action, there is a possibility of a bullish breakout through the first resistance level at 33462.12. This level is identified as a multi-swing high resistance, indicating it could pose a significant challenge for the price. If the price successfully breaks through this level, it may rise towards the second resistance level at 33658.77. This level is also a multi-swing high resistance and coincides with a 138.20% Fibonacci extension, suggesting it could provide strong resistance.
On the support side, the first support level is at 33154.45, which is identified as a pullback support. This level may provide support if the price were to drop. Additionally, there is a second support level at 32942.76, recognized as a swing low support, providing further potential support for the price.
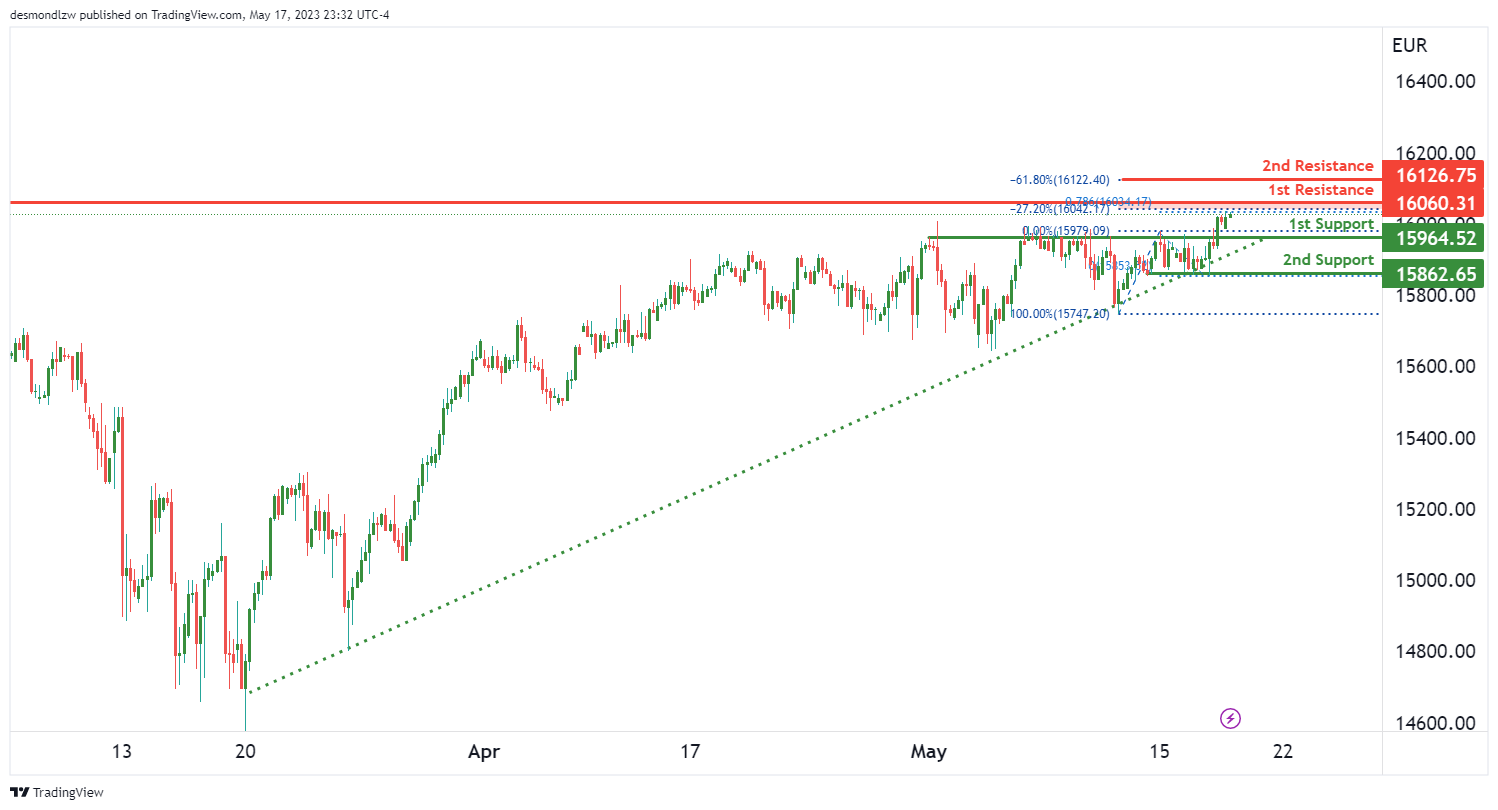
GER30:
The GER30 (DAX 30) chart is currently showing bullish momentum, indicating the potential for further upward movement.
One of the factors contributing to this momentum is that the price is above a major ascending trend line, suggesting the presence of bullish momentum. Additionally, there is an ascending trend line acting as support, further reinforcing the bullish sentiment.
In terms of potential price action, there is a possibility of a bullish breakout through the first resistance level at 16060.31. This level is identified as a swing high resistance and may pose a challenge for the price. If the price successfully breaks through this level, it could potentially rise towards the second resistance level at 16126.75. This level is associated with a -61.8% Fibonacci expansion, which adds to its significance as a potential resistance level.
On the support side, the first support level is at 15964.52, identified as an overlap support. This level may provide support if the price were to drop. Additionally, there is a second support level at 15862.65, recognized as a multi-swing low support, which could provide additional support for the price.
BTC/USD:
The BTC/USD chart is currently showing bearish momentum, indicating a potential downward movement.
One of the factors contributing to this bearish momentum is that the price is below a major descending trend line, suggesting the presence of ongoing bearish pressure.
In terms of potential price action, there is a possibility of a bearish continuation towards the first support level at 26540. This level is identified as an overlap support and may act as a price floor. If the bearish momentum persists, the price could potentially drop further towards the second support level at 25807, which is recognized as a swing low support.
On the resistance side, the first resistance level is at 27675, identified as an overlap resistance. This level coincides with a 78.60% Fibonacci retracement and a 61.80% Fibonacci projection, indicating it is a significant level of resistance. Additionally, there is a second resistance level at 28291, which is also an overlap resistance.
Overall, the momentum of the BTC/USD chart is bearish, and there is a potential for a bearish continuation towards the first support level.
US500
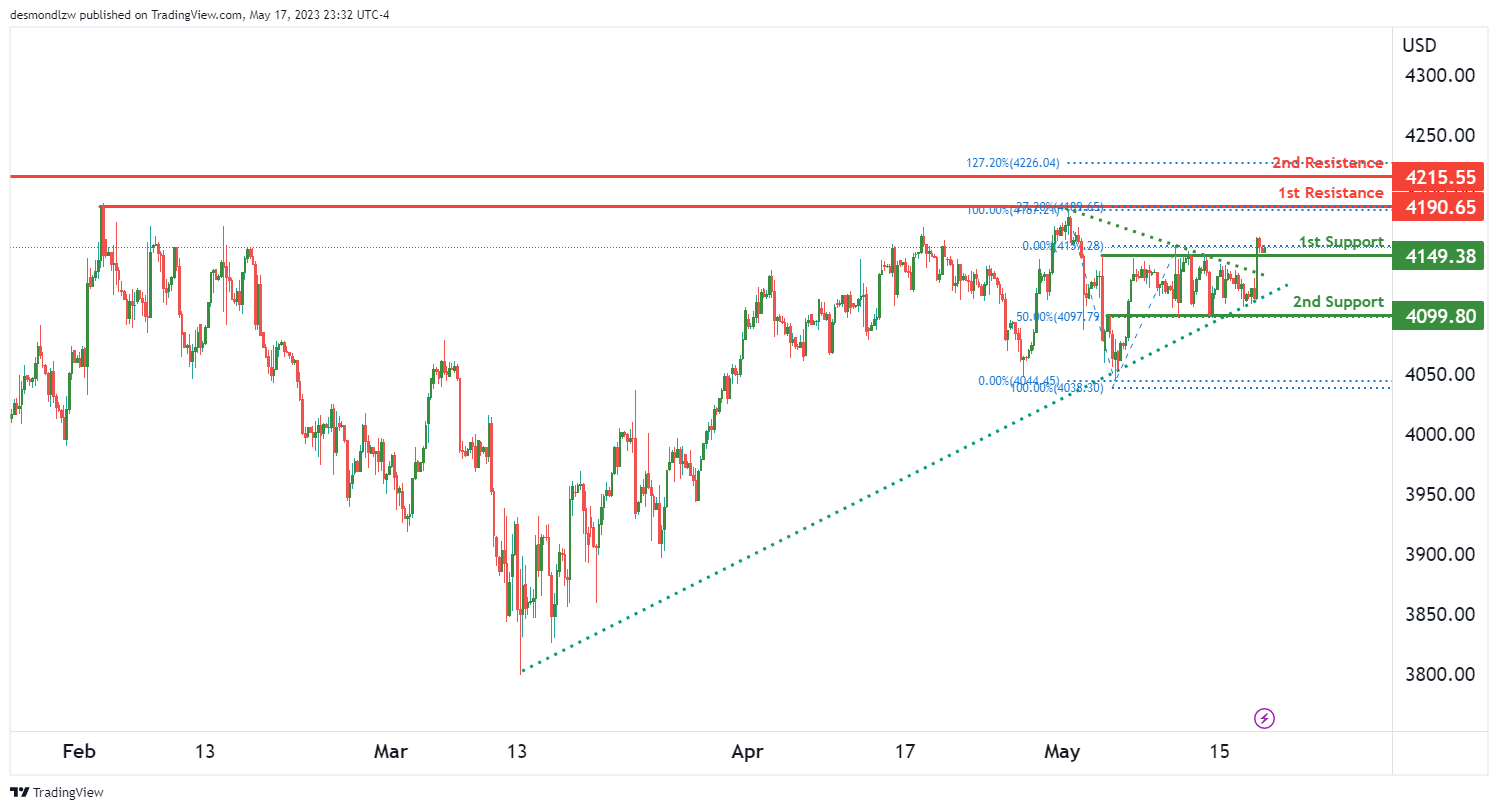
The US500 chart is currently displaying bullish momentum, indicating a potential upward movement.
There is a possibility of a bullish continuation towards the first resistance level at 4190.65. This level is identified as a multi-swing high resistance and could pose a significant challenge for the price. If the bullish momentum continues, the price could potentially rise further towards the second resistance level at 4215.55, which is a swing high resistance and coincides with a 127.20% Fibonacci retracement.
On the support side, the first support level is at 4149.38, identified as a pullback support. This level could potentially act as a price floor. If the price were to drop, the second support level at 4099.80, an overlap support, could provide additional support. It coincides with a 50% Fibonacci retracement, making it a significant level to watch.
Additionally, a symmetrical triangle chart pattern is observed, and a breakout from the upper trendline indicates the start of a new bullish trend.
ETH/USD:
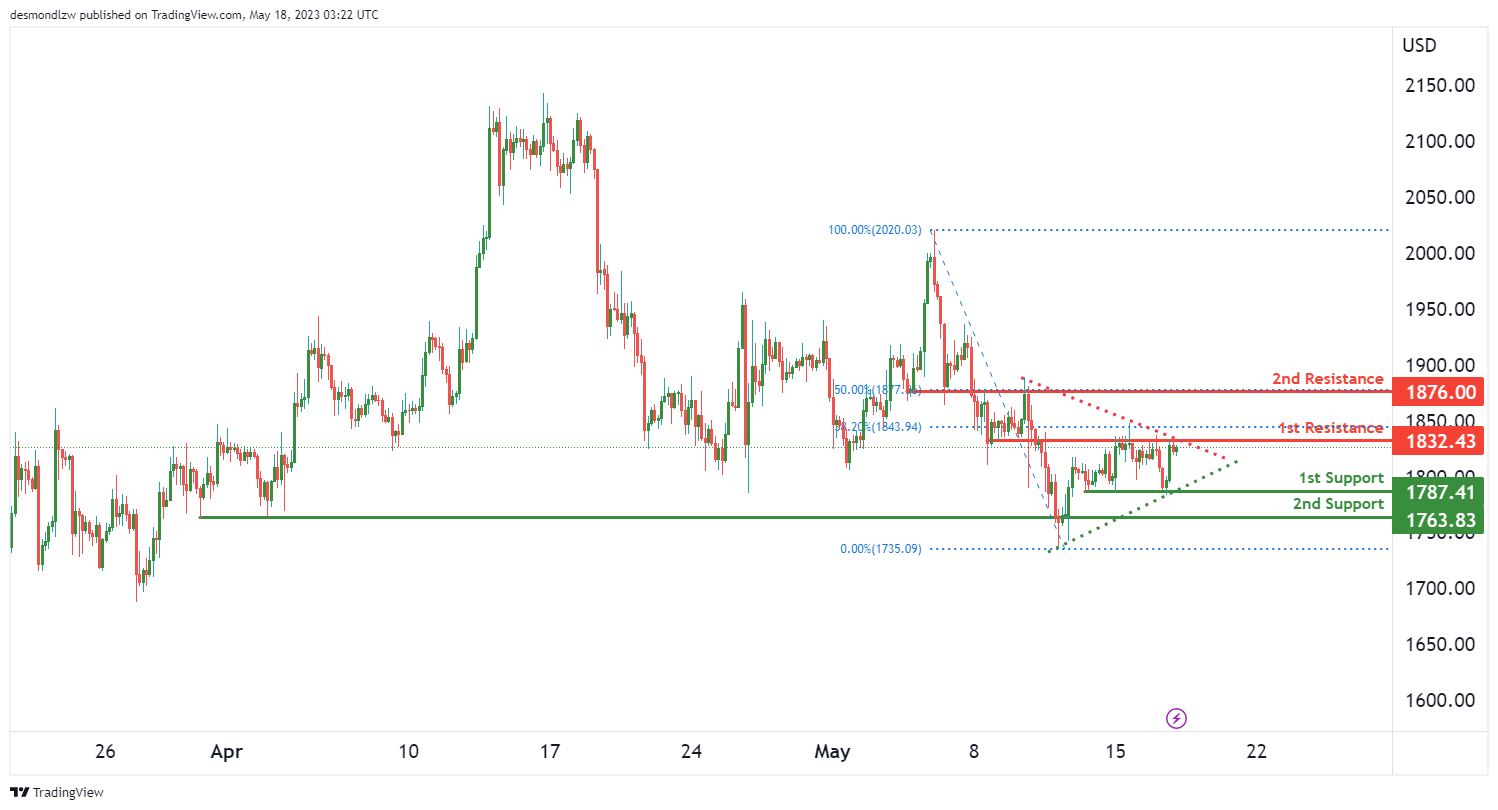
The EUR/USD chart is currently showing neutral momentum, indicating a lack of clear directional bias.
There is a possibility of price fluctuating between the first resistance and first support levels. The first support level is at 1787.41, identified as a multi-swing low support. This level may provide a price floor if the price were to drop. The second support level is at 1763.83, another multi-swing low support, and it coincides with a 50% Fibonacci retracement, making it a significant level to monitor.
On the resistance side, the first resistance level is at 1832.43, identified as an overlap resistance. If the price were to rise, this level could potentially act as a price ceiling. The second resistance level is at 1876.00, another overlap resistance, and it coincides with a 50% Fibonacci retracement.
In addition, a symmetrical triangle chart pattern is observed, which represents a period of consolidation before the price is forced to break out or break down. A break above the upper trendline of the pattern could signal a bullish breakout, while a break below the lower trendline might indicate a bearish breakdown.
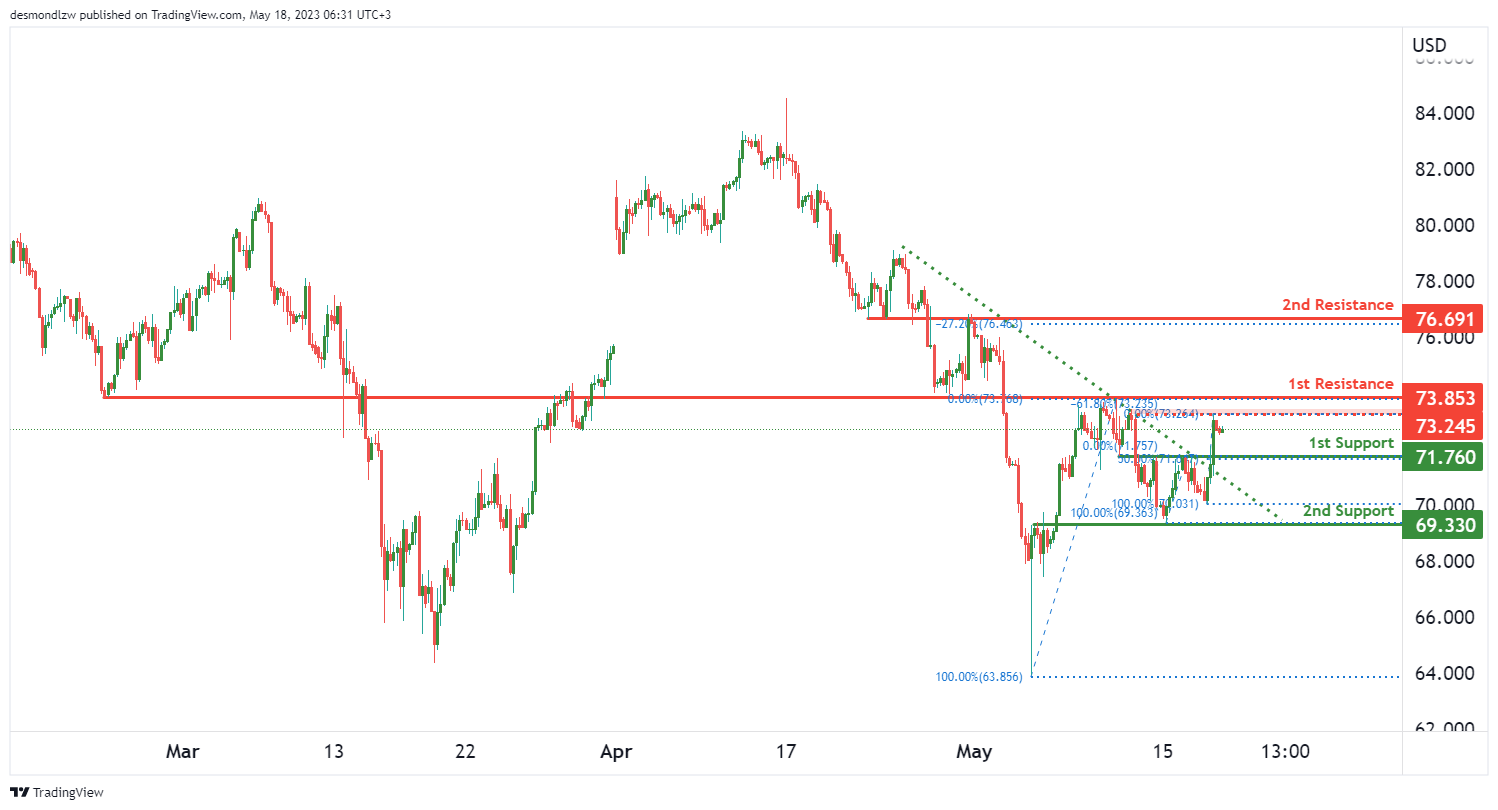
WTI/USD:
The WTI chart is currently demonstrating bullish momentum, supported by the fact that the price broke above a descending resistance line, triggering a potential bullish move.
In the short term, there is a possibility of the price dropping further towards the first support level at 71.76. This level is identified as a pullback support and coincides with a 50% Fibonacci retracement, making it a significant level to watch. If the price reaches this support level, it could potentially bounce from there.
The second support level is at 69.33, which is an overlap support. This level may also provide support if the price were to drop further.
On the resistance side, the first resistance level is at 73.85, identified as an overlap resistance. If the price were to rise, this level could potentially act as a price ceiling. The second resistance level is at 76.69, another overlap resistance, and it coincides with a -27% Fibonacci expansion.
There is also an intermediate resistance level at 73.24, which has been a significant multi-swing high resistance in the past.
Overall, the momentum of the WTI chart is bullish, and the price could potentially drop to the first support before bouncing and rising towards the identified resistance levels.
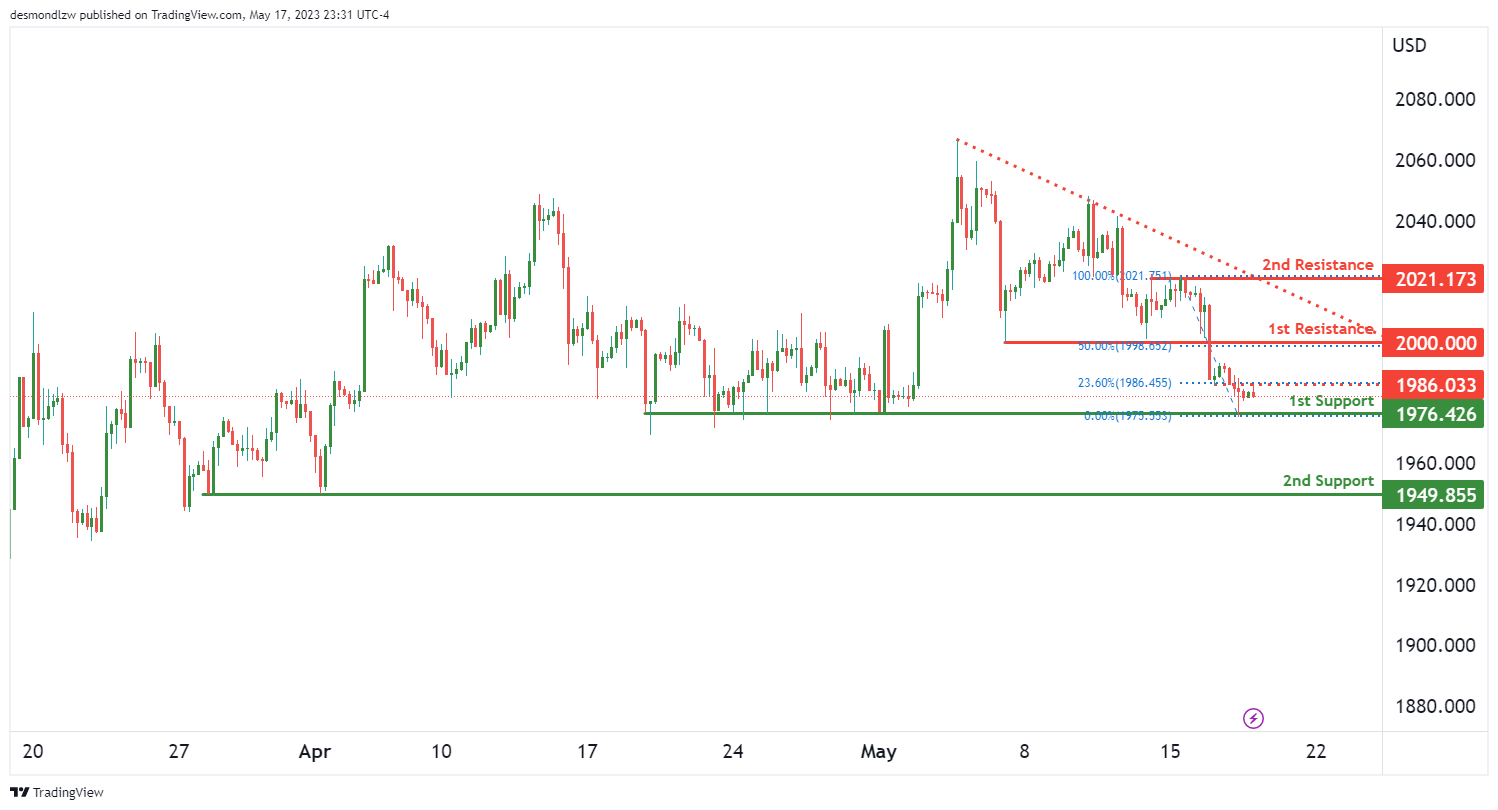
XAU/USD (GOLD):
The XAU/USD chart is currently showing bearish momentum, indicated by the fact that the price is below a major descending trend line, suggesting further potential for bearish movement.
In terms of potential price action, there is a possibility of a bearish continuation towards the first support level at 1976.42. This level is identified as a multi-swing low support, indicating its significance. If the price were to drop further, it could find additional support at the second support level at 1949.85, which is another multi-swing low support.
On the resistance side, the first resistance level is at 2000.00, which is a pullback resistance and coincides with a 50% Fibonacci retracement. If the price were to rise, this level may present a significant hurdle. The second resistance level is at 2021.17, identified as a multi-swing high resistance.
Additionally, there is an intermediate resistance level at 1986.00, which is an overlap resistance and coincides with a 23.60% Fibonacci retracement. This level may provide additional resistance if the price attempts to move higher.


