
DXY:
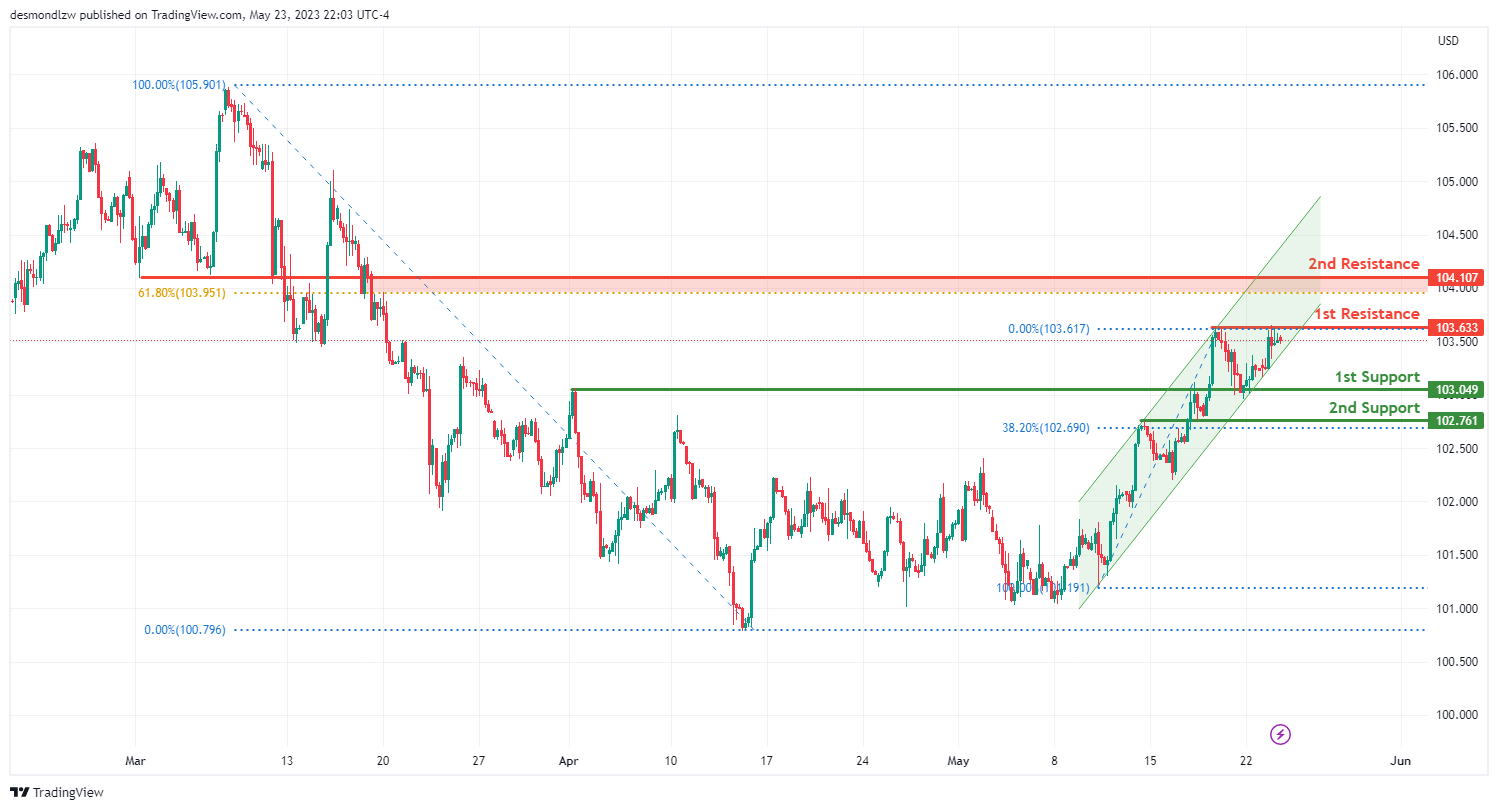
The DXY instrument is currently exhibiting a bullish trend, with the price moving in a bullish ascending channel. This indicates that the momentum is upwards and the price could potentially continue towards the first resistance level.
The first support level is located at 103.04, which acts as an overlap support and corresponds to the 38.20% Fibonacci retracement level. Overlap supports are levels that have historically acted as both support and resistance, and in conjunction with a significant Fibonacci level, this could provide a solid base for the price.
The second support level is at 102.76 and is also considered an overlap support. This could act as another potential floor for the price in the event of a retracement.
On the other hand, if the bullish momentum continues, the price could encounter resistance at 103.63, which represents a multi-swing high resistance level. This means that the price has peaked and reversed at this level on multiple occasions in the past, making it a significant barrier.
The second resistance level is at 104.10 and is characterized as a pullback resistance. This level is significant as it aligns with the 61.80% Fibonacci retracement level, which could act as a critical barrier to price increases. If the price retraces but fails to break through this level, it could signal a continuation of the bullish trend.
EUR/USD:
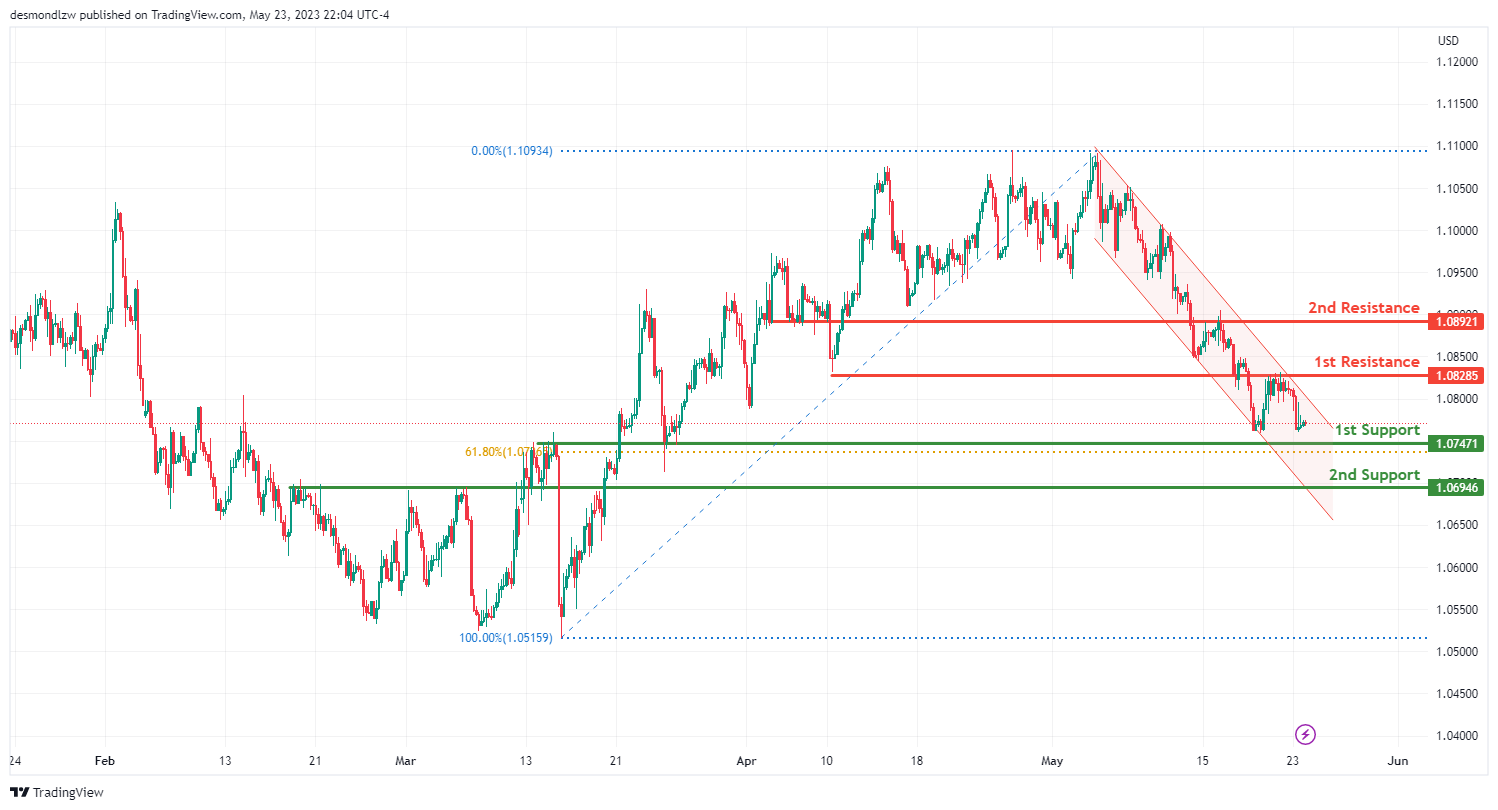
The EUR/USD pair is currently showing a bearish trend, with the price in a bearish descending channel. This suggests that there is potential for a bearish reaction off the first resistance level and a drop towards the first support level.
The first support level is set at 1.0747 and is an overlap support, which means it has historically served as both support and resistance. This could potentially provide a solid base to stop or reverse any further price decline.
The second support level is at 1.0649, which also acts as an overlap support, providing another potential floor for the price in the event of a downward movement.
On the other hand, should the price attempt to reverse its bearish trend, it could face resistance at 1.0828, which acts as an overlap resistance. This level could potentially halt an upward price movement.
The second resistance level is found at 1.0892, serving as another overlap resistance. If the price reaches this level, it might find it challenging to continue its upward trajectory and may instead reverse back towards its support levels.
GBP/USD:
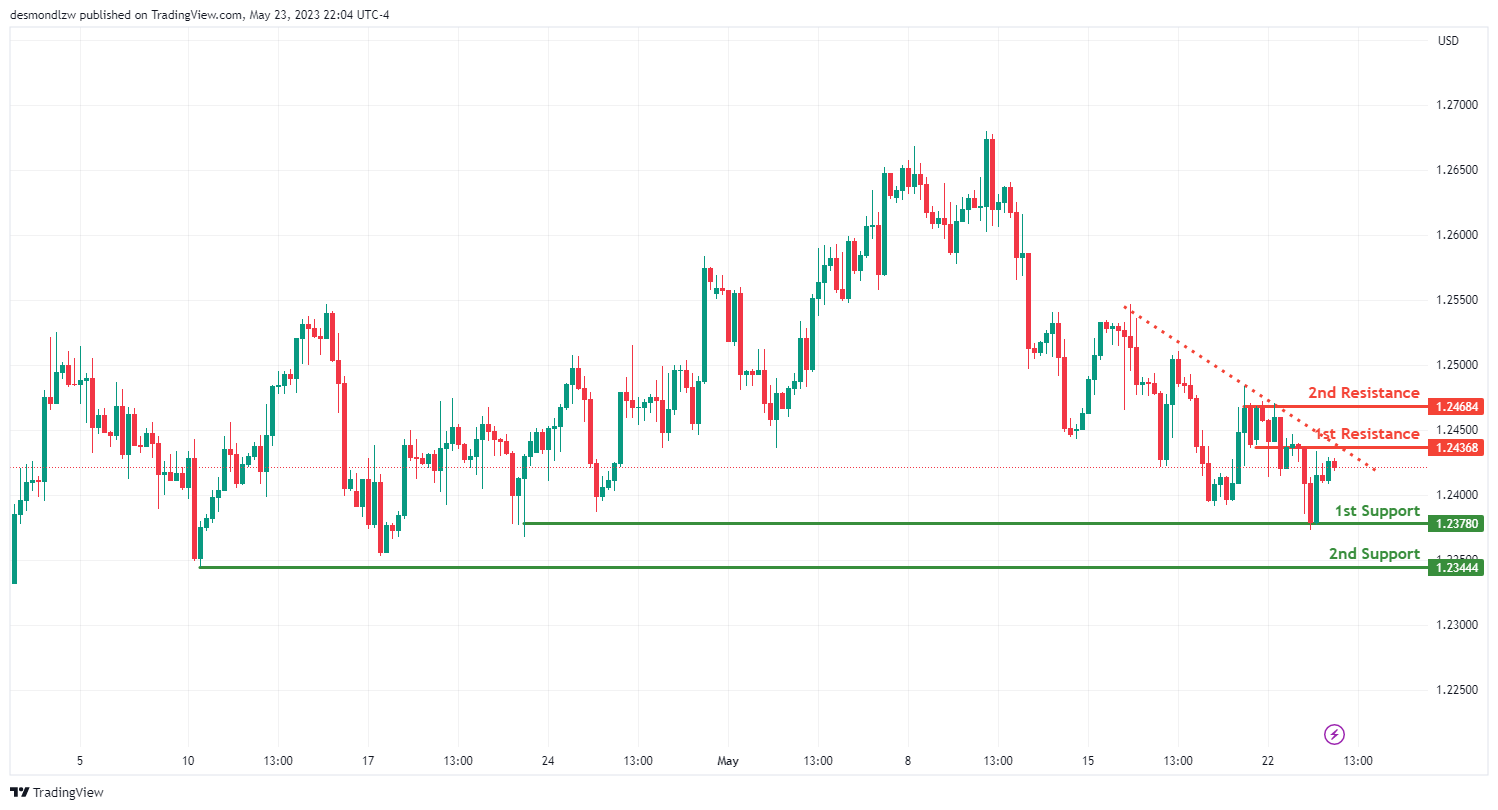
The GBP/USD pair is currently in a bearish trend, suggesting that bearish momentum is on the cards due to the price being below a major descending trend line.
The first level of support is at 1.2378, which is a multi-swing low support, indicating it is a point where the price has bottomed out multiple times in the past. This makes it a potentially strong level to halt further price drops.
The second support level is at 1.2344, acting as a swing low support, which is a point where the price has previously bottomed out, indicating its potential as a floor to prevent further declines.
On the other hand, should the price attempt to reverse its current trend, it will face resistance at 1.2436, an overlap resistance level that may potentially halt an upward price movement.
The second resistance level is at 1.2468 and is recognized as a multi-swing high resistance, meaning it has capped price increases multiple times in the past and could potentially do so again in the future.
USD/CHF:
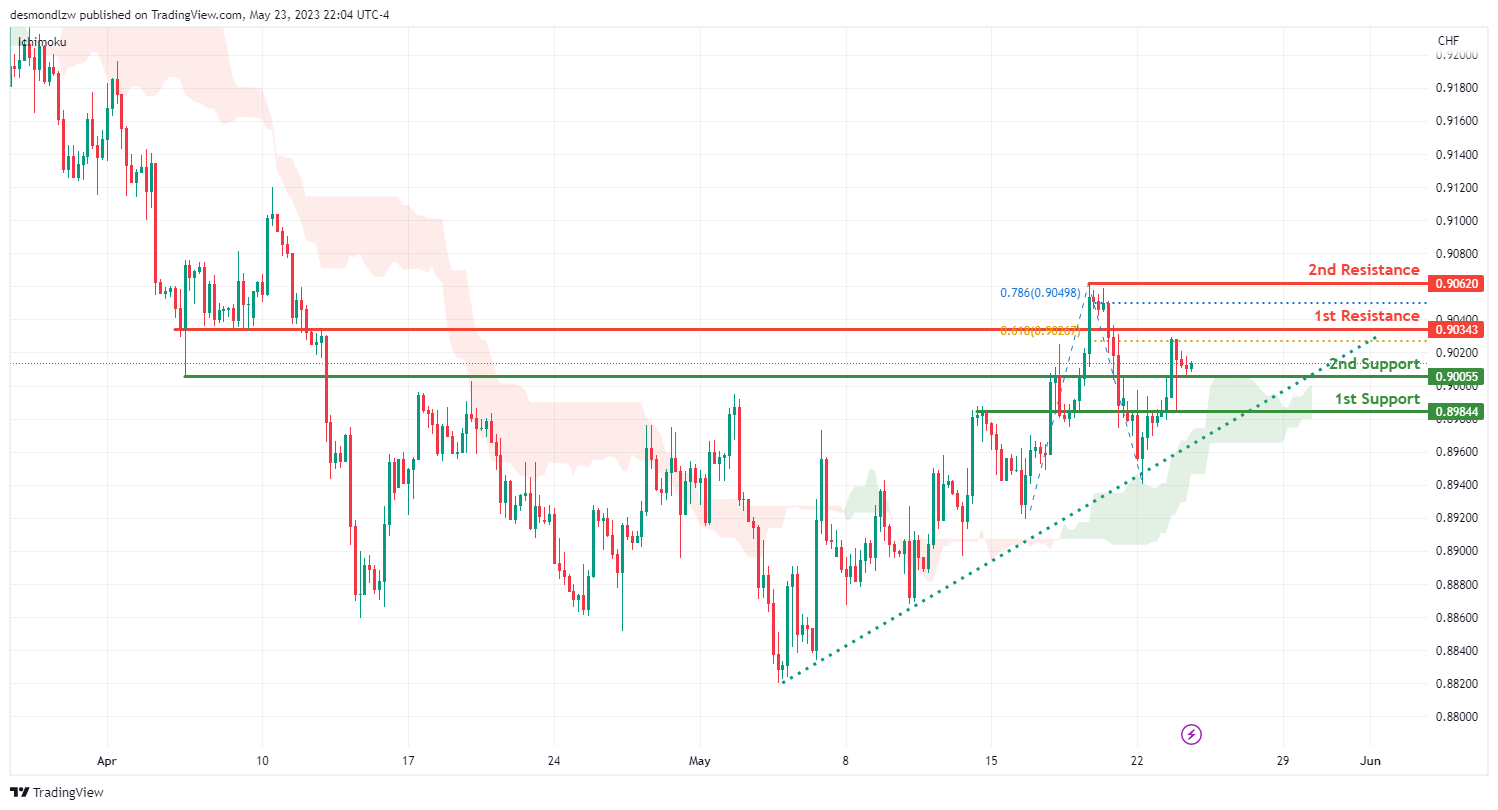
The USD/CHF pair is presently in a bullish trend, suggesting potential further bullish momentum. This is supported by the price being above a major ascending trend line and above the bullish Ichimoku cloud
The first level of support is at 0.9005, identified as an overlap support. This means the level has historically functioned as both support and resistance, potentially stopping any price decline.
The second support level is at 0.8984, also an overlap support, reinforcing its potential as a floor level to halt further drops.
On the upside, the first resistance level stands at 0.9034. This is an overlap resistance and aligns with the 61.8% Fibonacci retracement level, potentially acting as a significant barrier to any price increases.
The second resistance level is at 0.9062, which functions as a multi-swing high resistance. This means the level has historically halted price increases multiple times, potentially indicating a reversal in the future.
USD/JPY:
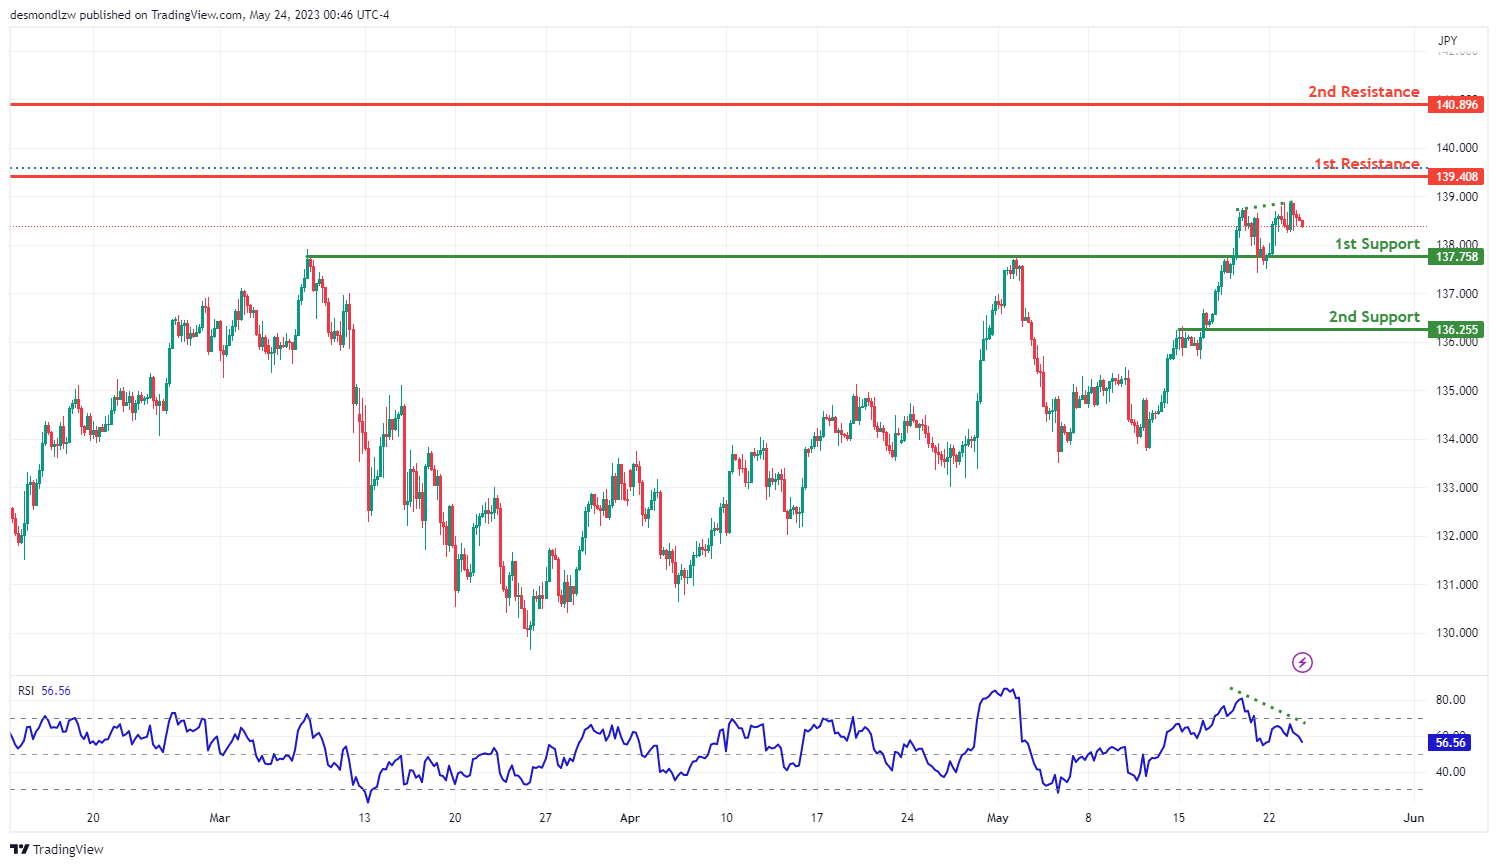
The USD/JPY pair currently shows a bearish trend, suggesting a potential continuation of price decline towards the first support level.
The first level of support is at 137.75, serving as a pullback support. Pullback supports typically signal levels where the price has previously rebounded after a short-term retracement, making it a potential stopping point for further price declines.
The second support level is at 136.25, known as an overlap support. Overlap supports have historically acted as both resistance and support, indicating it could halt or reverse any further downward movement in the pair.
On the other hand, if the price reverses direction, the first resistance level is at 139.40. This level is seen as a swing high resistance, a point at which the price has previously reversed after increasing.
The second resistance level is at 140.89, also a swing high resistance. These levels are significant as they have historically capped price increases.
Furthermore, the Relative Strength Index (RSI) is showing bearish divergence compared to the price, which often suggests a forthcoming rapid decline in price
AUD/USD:
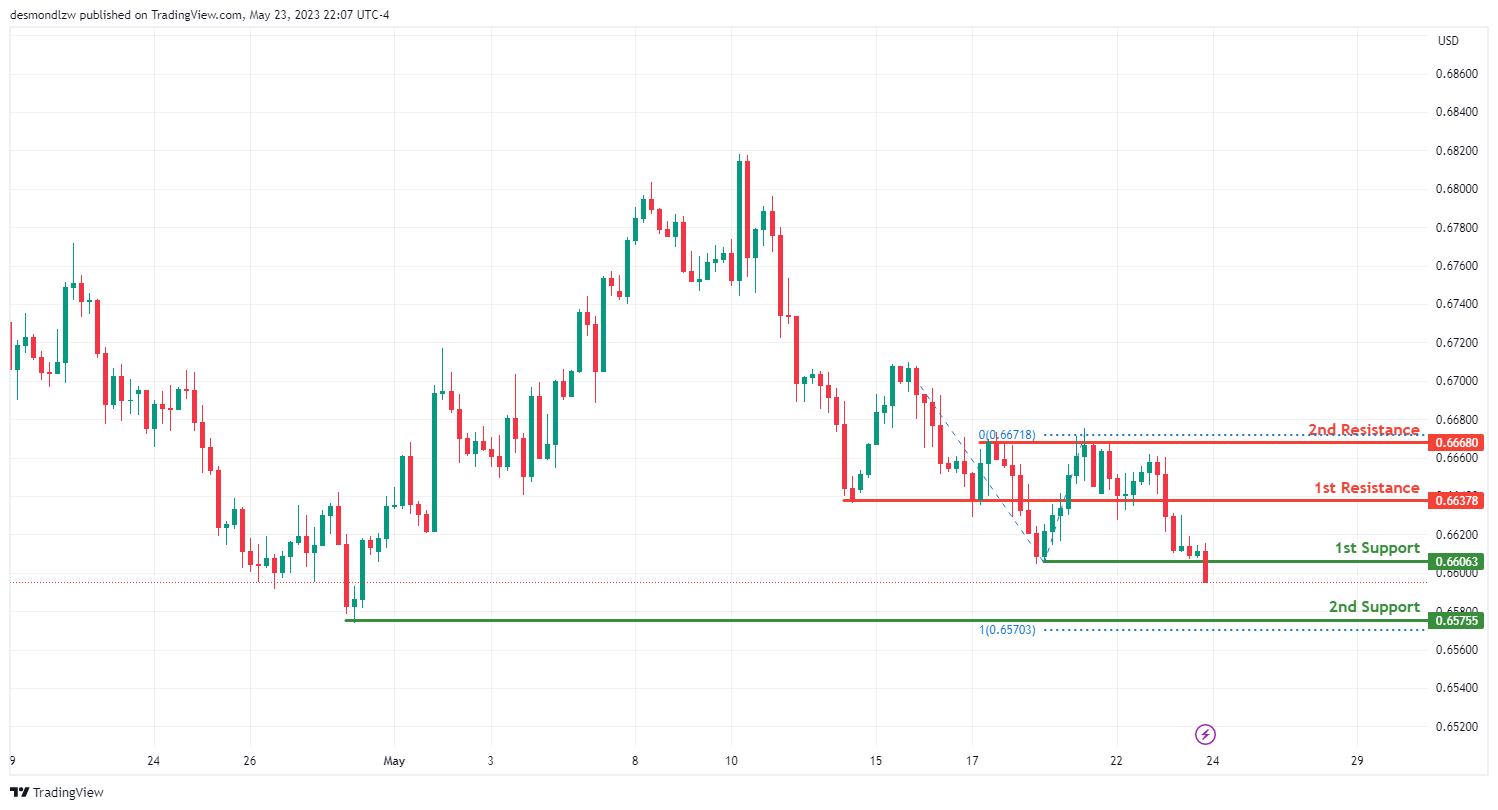
The AUD/USD pair is currently demonstrating a bearish trend, suggesting a potential bearish break off the first support level and a drop towards the second support level.
The first level of support is at 0.6606, representing a multi-swing low support. This suggests that this level has acted as a floor multiple times in the past, making it a strong potential support level.
The second support level is at 0.6575 and is identified as a swing low support. This is a price point where the value has historically bottomed out, making it a potential floor for further price declines.
On the other hand, if the price were to reverse, the first resistance level is at 0.6637, acting as a pullback resistance. This level represents a point where the price has previously stopped and reversed after a retracement.
The second resistance level is located at 0.6668, acting as a multi-swing high resistance and aligning with the 100% Fibonacci projection level. This suggests that it could be a significant barrier to price increases.
NZD/USD
The NZD/USD pair is currently on a bearish trend, suggesting a potential bearish break from the first support level and a drop towards the second support level.
The first support level is at 0.6166, and it’s considered an overlap support. Overlap supports have historically acted as both resistance and support, indicating that this level could potentially halt a price decline.
The second support level is at 0.6124, characterized as a multi-swing low support. This suggests that this level has acted as a floor multiple times in the past, reinforcing its potential as a crucial support level.
On the upside, if the price reverses its trend, the first resistance level is at 0.6265. This level is recognized as an overlap resistance, which could act as a significant barrier to price increases.
The second resistance level is at 0.6302, functioning as a swing high resistance, and it’s also at the 100% Fibonacci projection level. This suggests that it could be a significant point of price reversal.

USD/CAD:
The USD/CAD chart currently exhibits bullish momentum, suggesting the potential for further upward movement.
In the short term, there is a possibility of a bullish continuation towards the first resistance level at 1.3529. This resistance level is identified as an overlap resistance, indicating its significance as a potential price ceiling.
Additionally, there is a second resistance level at 1.3581, recognized as an overlap resistance and coinciding with a 78.60% Fibonacci retracement. This level further reinforces the potential for resistance in case of a price increase.
On the support side, the first support level at 1.3421 is an overlap support, which may provide a price floor and support any potential pullbacks.
Furthermore, there is a second support level at 1.3335, identified as an overlap support, further contributing to the potential for support in case of a price decline.

DJ30:
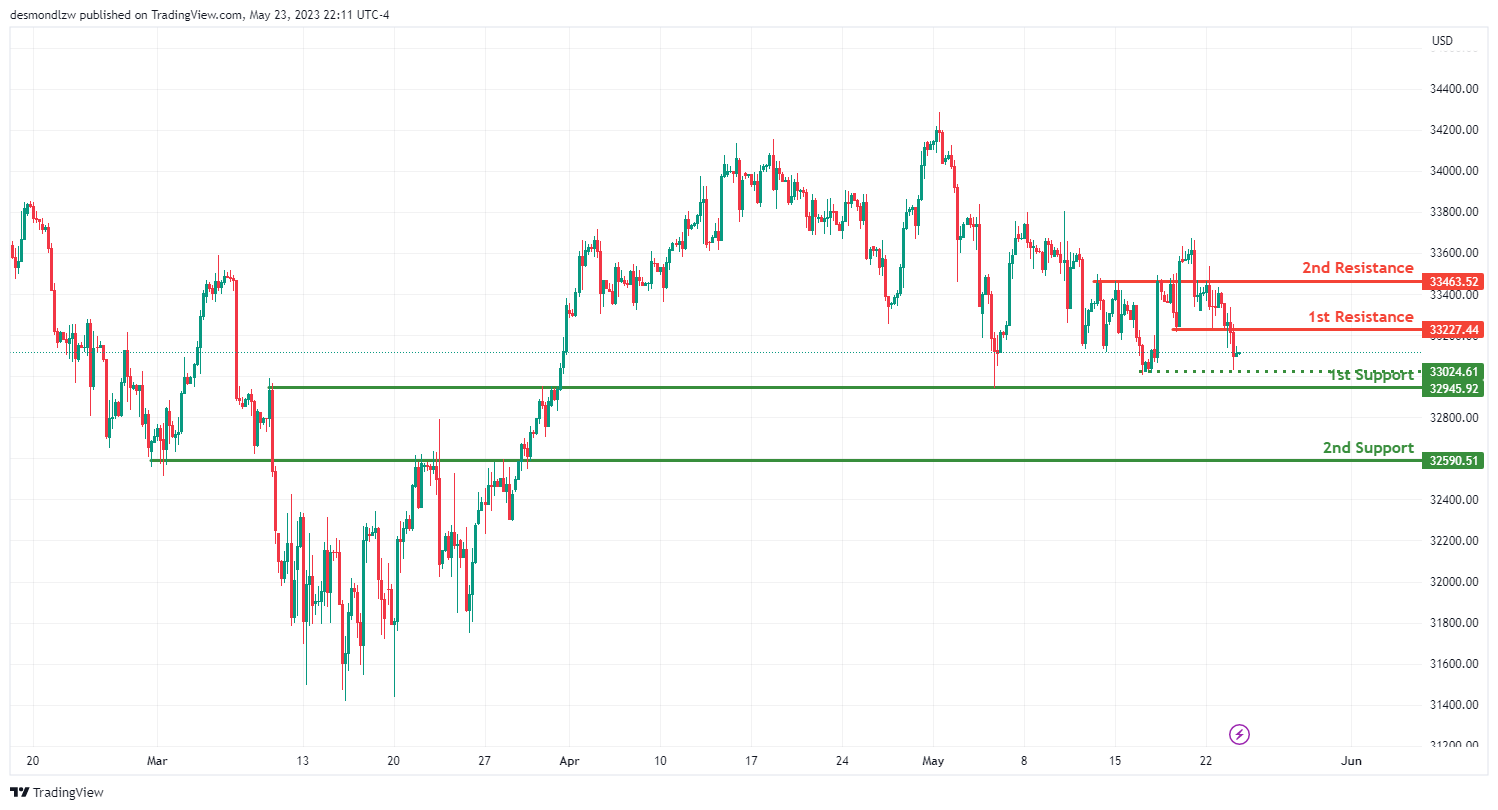
The DJ30 chart currently demonstrates a bearish momentum, indicating the potential for further downward movement.
In the short term, there is a possibility of a bearish continuation towards the first support level at 32945.92.
The first support level at 32945.92 is identified as an overlap support, suggesting it could act as a price floor if the price were to decline.
Additionally, there is a second support level at 32590.51, recognized as an overlap support, providing further support in case of a price decline.
In between, there is an intermediate support level at 33024.61, recognized as an overlap support, which contributes to the potential for providing a price floor.
On the resistance side, the first resistance level at 33227.44 is an overlap resistance, which could pose a barrier if the price attempts to rise.
There is also a second resistance level at 33463.52, identified as an overlap resistance, which adds to its significance in potentially restraining the price’s upward movement.
GER30:
The GER30 chart currently demonstrates a bearish momentum, indicating the potential for further downward movement.
In the short term, there is a possibility of a bearish continuation towards the first support level at 16034.64. This support level is identified as an overlap support and coincides with a 61.80% Fibonacci retracement, adding to its significance as a potential price floor.
Additionally, there is a second support level at 15847.26, recognized as an overlap support, which further reinforces the potential for support in case of a price decline.
On the resistance side, there is an intermediate resistance level at 16199.70, identified as an overlap resistance, which may pose a barrier to any potential upward movement.
Furthermore, the first resistance level at 16293.56 is an overlap resistance, further contributing to its potential significance in restraining the price’s upward movement.

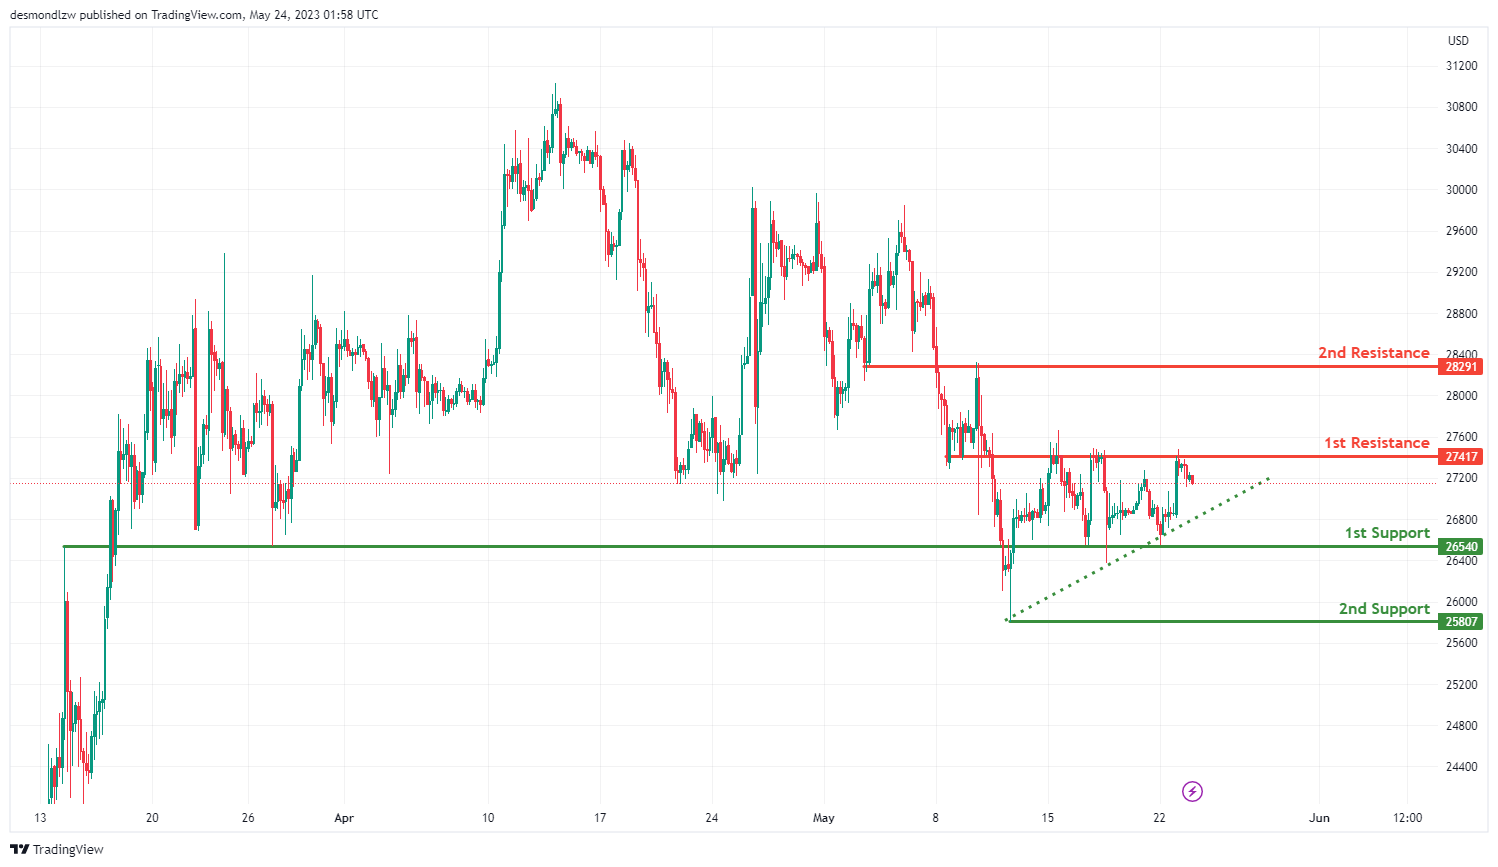
BTC/USD:
The BTC/USD pair is currently on a bullish trend, largely contributed by the price being above a major ascending trend line, suggesting that further bullish momentum is likely.
In the short term, the price might drop further to the first support level at 26450, which is recognized as an overlap support. Overlap supports have historically acted as both resistance and support, and it could potentially halt a price decline.
The second support level stands at 25807 and is identified as a swing low support. Swing low support levels are areas where the price has historically bottomed out, reinforcing its significance as a potential floor for the price.
On the upside, once the price bounces from the first support level, it might rise to the first resistance level at 27417. This level is seen as an overlap resistance and could act as a significant barrier to price increases.
The second resistance level is at 28291, also recognized as an overlap resistance, which could potentially cap price increases, indicating a possible price reversal at this level.
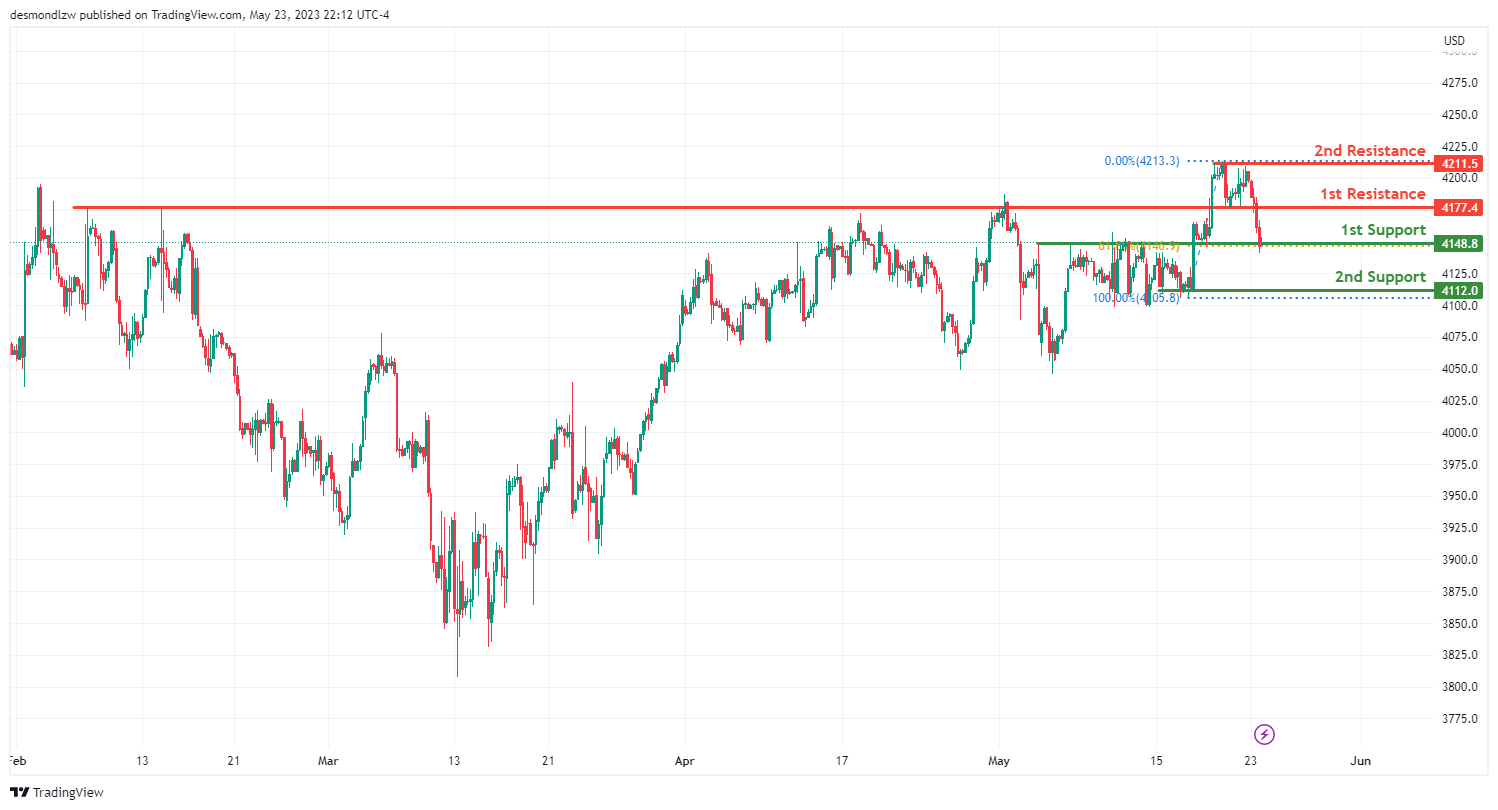
US500
The US500 chart currently exhibits a weak bullish momentum with low confidence, suggesting the potential for limited upward movement.
In the short term, there is a possibility of a bullish bounce off the first support level at 4148.80. This support level is identified as an overlap support and coincides with a 61.80% Fibonacci retracement, indicating its significance as a potential price floor.
Additionally, there is a second support level at 4112.00, recognized as an overlap support, further contributing to the potential for support in case of a price decline.
On the resistance side, the first resistance level at 4177.40 is an overlap resistance, which may pose a barrier to any potential upward movement.
Furthermore, the second resistance level at 4211.50 is identified as an overlap resistance, reinforcing its potential significance in restraining the price’s upward movement.
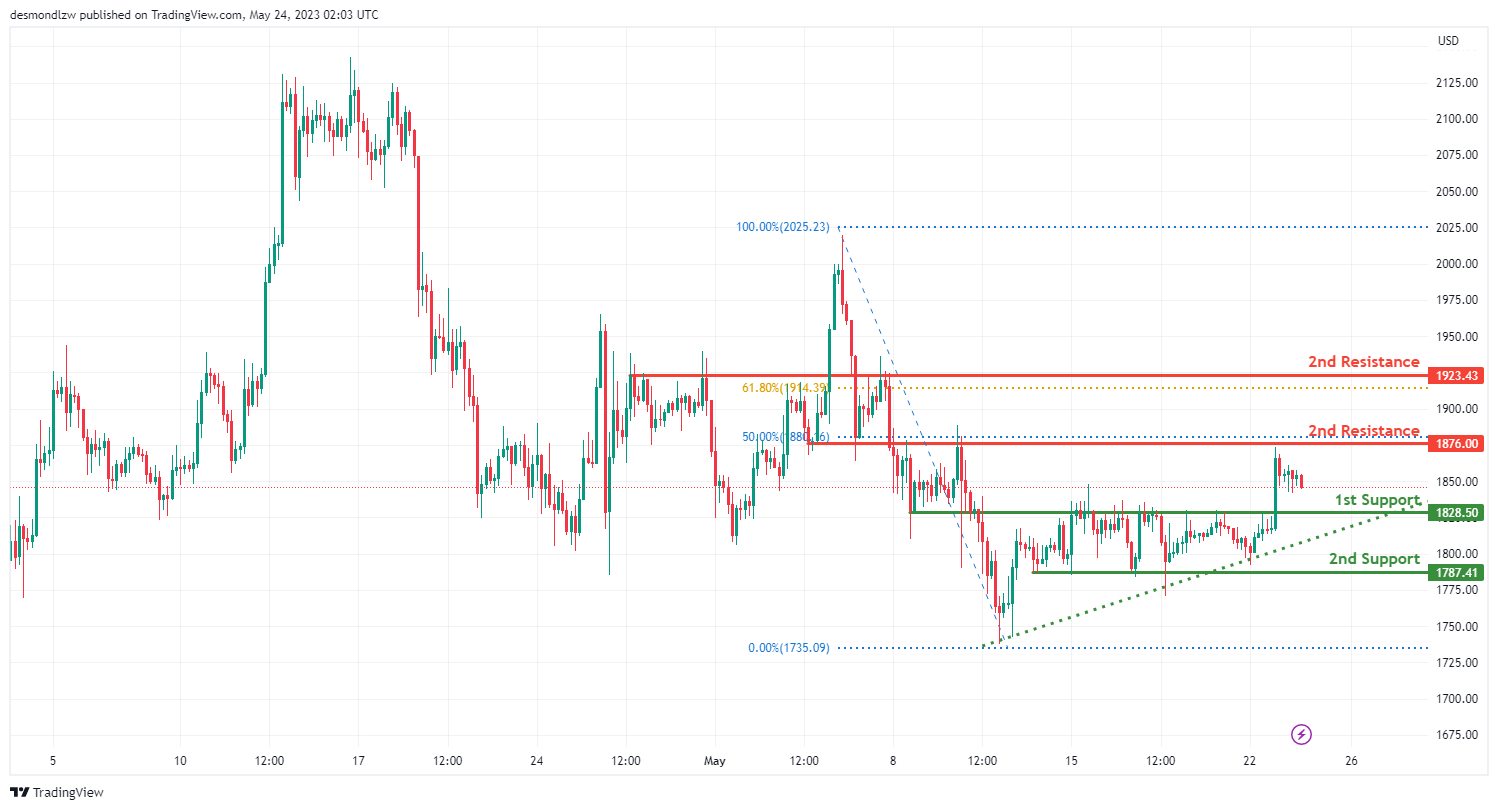
ETH/USD:
The ETH/USD pair is exhibiting a bullish trend, largely due to the price being above a major ascending trend line. This suggests that further bullish momentum is likely.
In the short term, the price may drop to the first support level at 1828.50, which acts as a pullback support. Pullback support levels are often seen as strong support zones as they have previously halted a downward trend and triggered a price rebound.
The second support level stands at 1787.41, recognized as a multi-swing low support. Multi-swing low support levels have historically acted as a strong floor, where the price has repeatedly bottomed out, increasing their significance as a potential support level.
On the upside, once the price bounces from the first support, it might rise to the first resistance level at 1876.00. This level acts as an overlap resistance and aligns with the 50% Fibonacci retracement level, potentially offering a significant barrier to price increases.
WTI/USD:
The WTI crude oil is currently showing a bullish trend, with the price above a major ascending trend line, suggesting that further bullish momentum could be on the horizon.
In the short term, the price might drop further to the first support level at 70.95, which is considered a swing low support. Swing low support levels have historically acted as a reliable floor, where the price has previously bottomed out.
The second support level is at 69.33, serving as an overlap support. Overlap supports have historically functioned as both resistance and support, suggesting this level could halt a price decline.
If the price bounces off the first support level, it could potentially rise to the first resistance level at 73.85. This level is identified as an overlap resistance, potentially offering a substantial obstacle to price increases.
The second resistance level stands at 76.69, also recognized as an overlap resistance. Overlap resistance levels have often capped price increases in the past, potentially indicating a reversal.

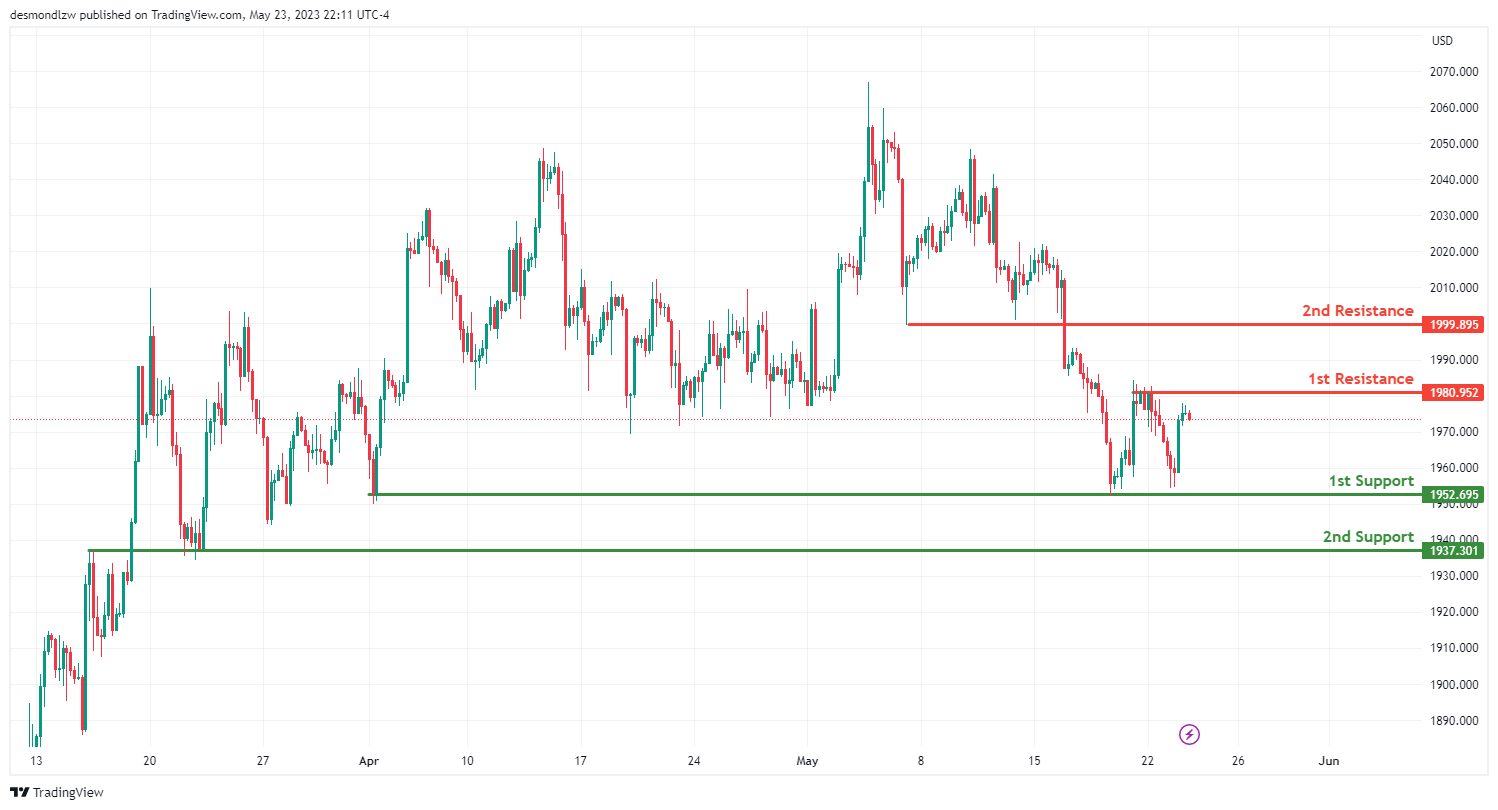
XAU/USD (GOLD):
The XAU/USD pair currently exhibits a bearish trend, suggesting potential continuation towards the first support level.
The first support level is at 1952.69 and serves as a multi-swing low support, a level at which the price has bottomed out multiple times historically, potentially halting further price decline.
The second support level, at 1937.30, is an overlap support. Overlap supports have historically acted as both resistance and support, suggesting that this level could also prevent further price drops.
Conversely, should the price reverse direction, the first resistance level is found at 1980.95. This level acts as a multi-swing high resistance, indicating that it has been a point at which price increases have stopped and reversed historically.
The second resistance level is at 1999.59, serving as a pullback resistance. Pullback resistances are levels where the price has previously experienced a reversal following a brief retracement. This level could potentially cap further price increases.


