
The possibility of a US recession has ignited intense debates, especially as the labor market and consumer spending continue to demonstrate resilience despite aggressive interest rate hikes. However, hold on to your hats because Deutsche Bank is bringing a bold statement. They see a 100% probability of a US recession unfolding. The fed funds rate is currently at its highest level since 2006, but inflation still persists above the Fed’s desired goal. Fed Chair Jerome Powell warned that more rate hikes may be necessary to tackle this stubborn inflation. However, here’s where it gets interesting: David Folkerts-Landau, Deutsche Bank’s chief economist, believes that while further rate increases may bring inflation down, the price we might have to pay is a full-blown recession. In fact, he suggests that the US is on the verge of experiencing its first policy-induced boom-bust cycle in decades, with the inflationary effects of expansive fiscal and monetary policies finally catching up. Buckle up, folks, because it would truly be a historical anomaly if we manage to avoid a hard landing. Stay vigilant, forex traders, as these dynamics unfold before our eyes.
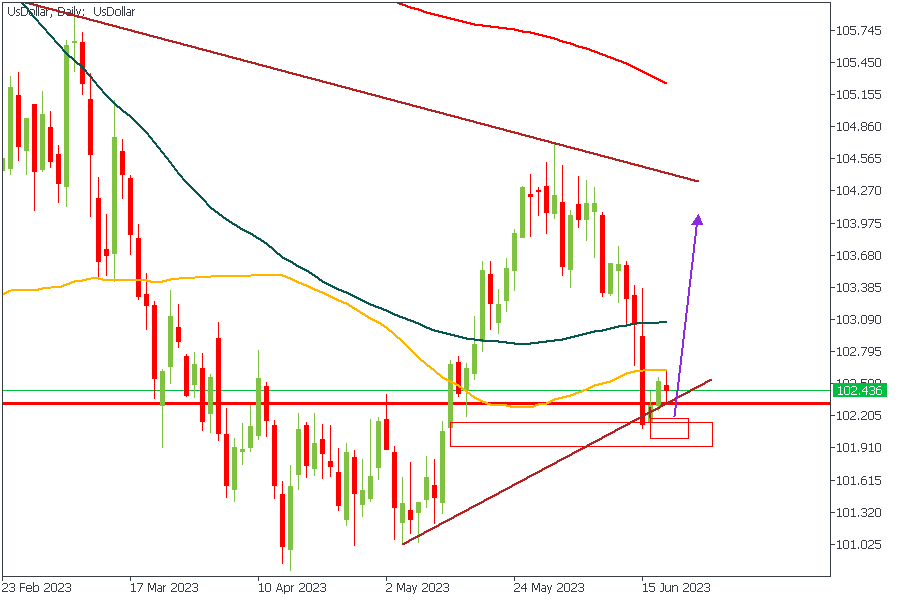
US DOLLAR – Daily Timeframe
At the moment, we’re seeing the likely onset of bullish price action from the US Dollar based on the candlestick formation within the demand zone. The confluences I have for this trade include;
Pivot zone from the weekly timeframe
Rally-base-rally demand zone, and
Trendline support
Analyst’s Expectations:
- Direction: Bullish
- Target: 102.218
- Invalidation: 103.0
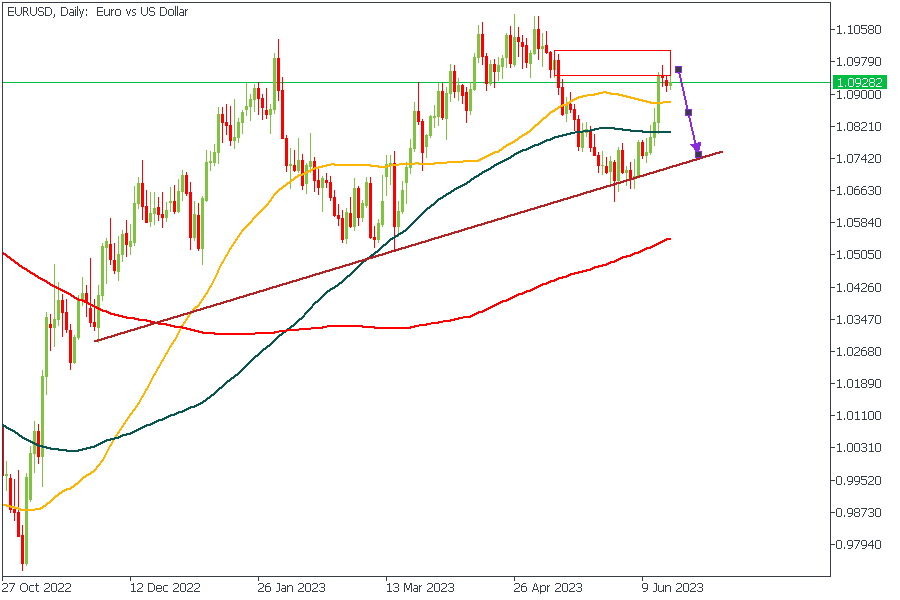
EURUSD – Daily Timeframe
The bullish impulse is weakening, as we can see from the price action at the supply zone. Correlating this EURUSD price action with what we saw earlier on the US Dollar chart indicates, to a large degree, the likelihood of a bearish retracement. On this note, I expect to see the bearish movement slide toward the trendline support before we get to see a bullish continuation.
Analyst’s Expectations:
- Direction: Bearish
- Target: 1.08238
- Invalidation: 1.10092
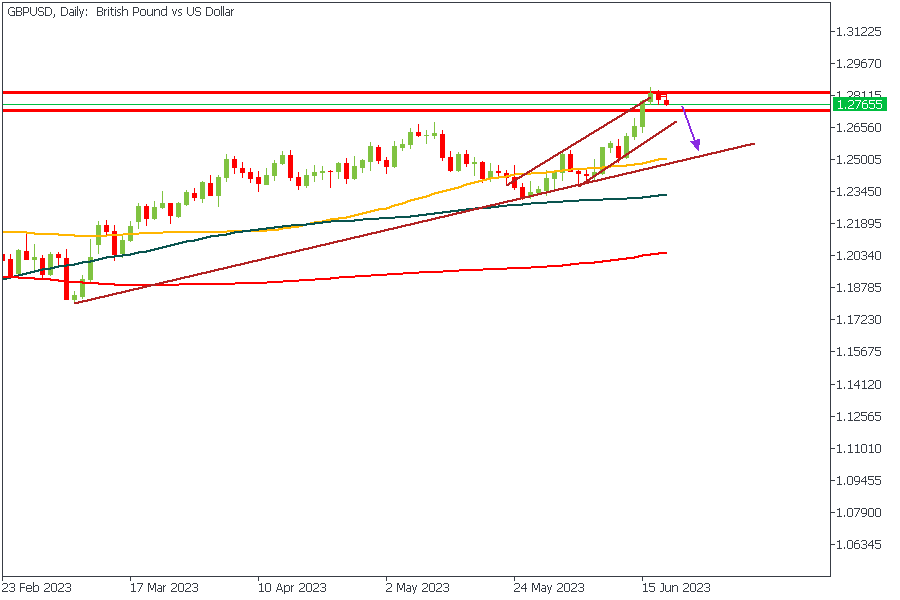
GBPUSD – Daily Timeframe
GBPUSD has reached a crucial resistance level after commencing a solid rally from the 100-Day moving average, which on a regular day would imply a possibility of a bearish movement. The current price action indicates an attenuation that often symbolizes a rejection from a support or resistance area. The correlation of this price action with that on the daily timeframe of the US Dollar chart reinforces my bias.
Analyst’s Expectations:
- Direction: Bearish
- Target: 1.26657
- Invalidation: 1.28523
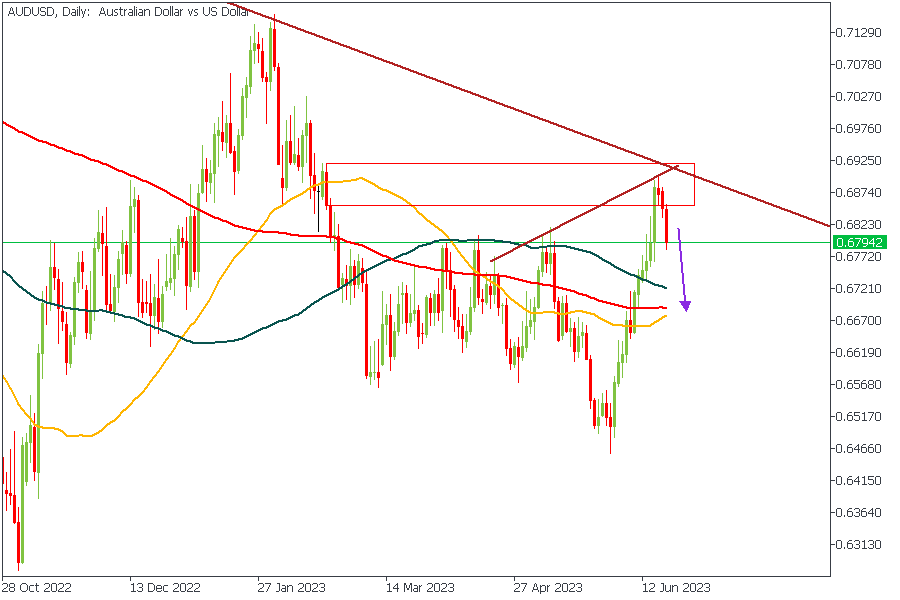
AUDUSD – Daily Timeframe
AUDUSD made a solid rejection from the convergence point of the two resistance trend lines and could be heading toward the 100-Day moving average for support.
The confluences for this position include;
The resistance trendline convergence
The rally-base-drop supply zone, and
The previous rejection from the supply zone
Analyst’s Expectations:
- Direction: Bearish
- Target: 0.67323
- Invalidation: 0.68483
CONCLUSION
The trading of CFDs comes at a risk. Thus, to succeed, you have to manage risks properly. To avoid costly mistakes while you look to trade these opportunities, be sure to do your due diligence and manage your risk appropriately.


