
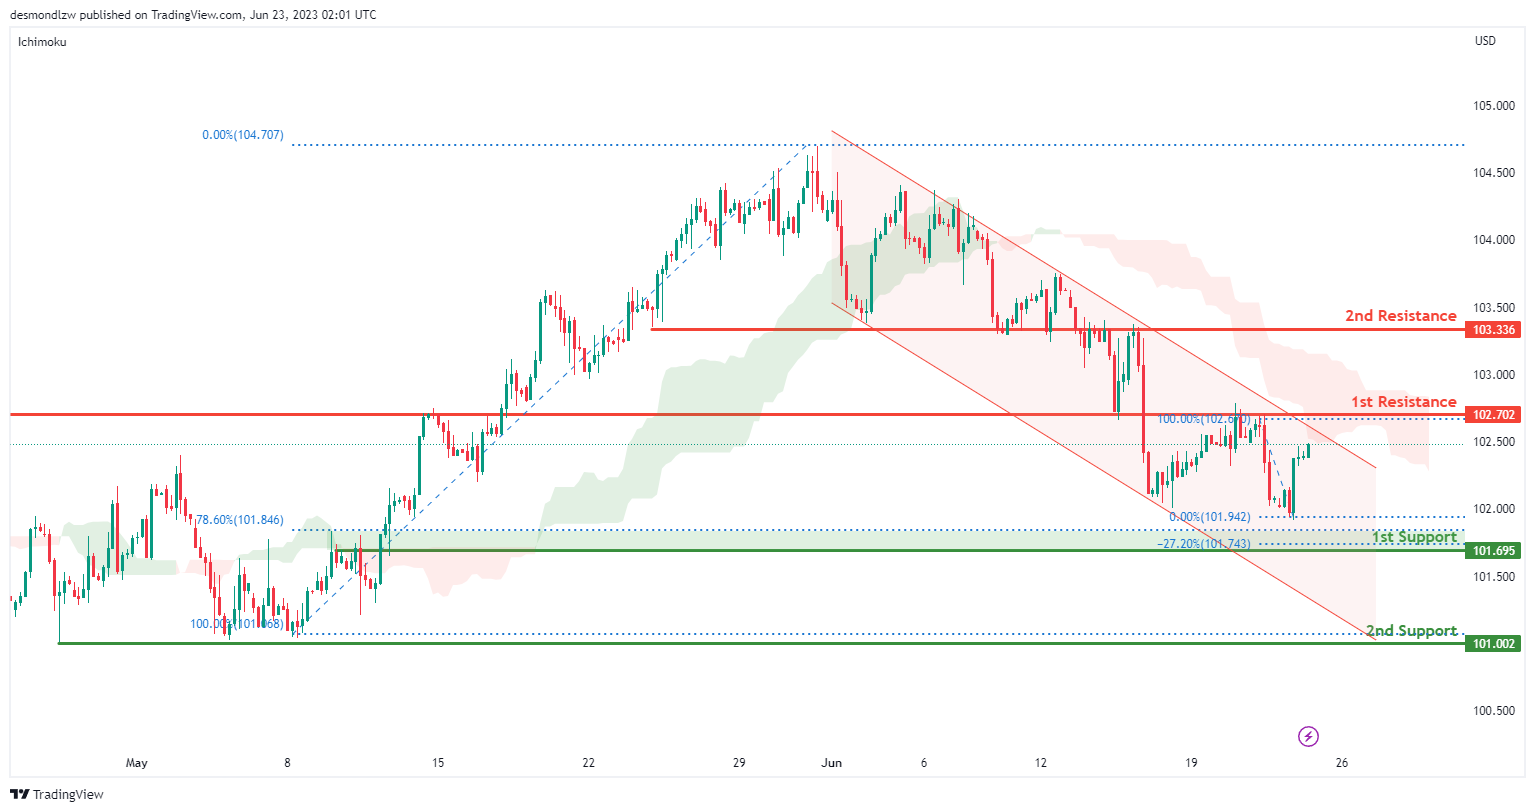
DXY:
The DXY (US Dollar Index) chart exhibits a bearish momentum as indicated by two factors. Firstly, the price is currently positioned below the bearish Ichimoku cloud, reflecting a prevailing bearish sentiment in the market. Secondly, the price movement is confined within a bearish channel, suggesting a continued downward trajectory driven by the existing bearish momentum.
In terms of potential price action, there is a likelihood of a bearish reaction off the first resistance level at 102.70, which is characterized as an overlap resistance. This resistance level has the potential to trigger a bearish response in the market. Subsequently, the price could experience a decline towards the first support level at 101.69.
The first support level at 101.69 holds significance as it is identified as an overlap support, reinforced by the presence of the -27% Fibonacci Expansion and the 78.60% Fibonacci Retracement. This confluence of factors enhances the reliability of this support level. Additionally, the second support level at 101.00 acts as a multi-swing low support, further fortifying the support zone.
Conversely, the first resistance level at 102.70 represents an overlap resistance that could potentially impede upward movement and trigger a bearish response in the market. Similarly, the second resistance level at 103.33 serves as another overlap resistance, reinforcing its importance in hindering further upward price advancement.
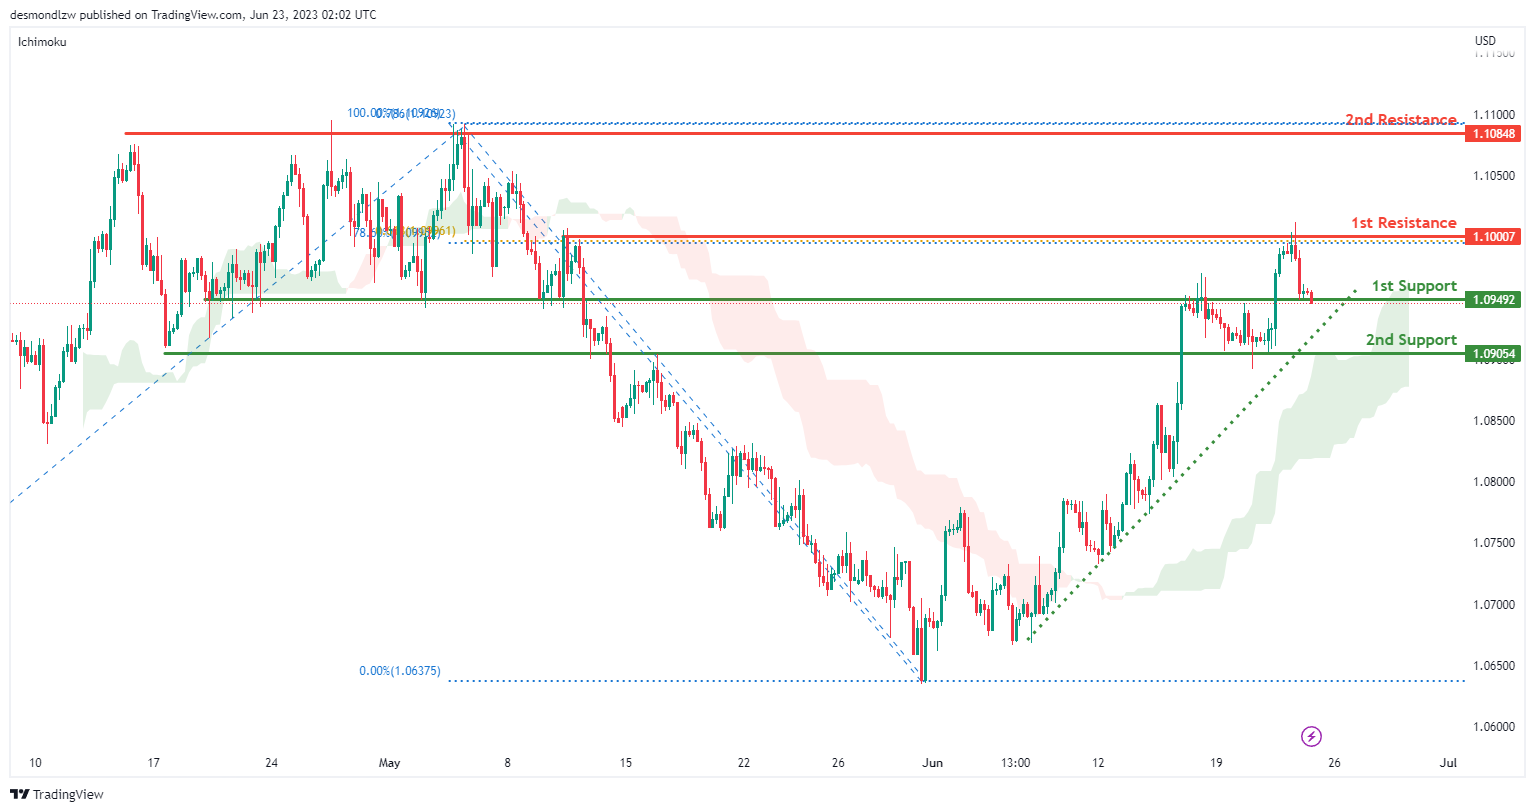
EUR/USD:
The EUR/USD chart demonstrates a bullish momentum as the price remains above the bullish Ichimoku cloud and a major ascending trend line, indicating further potential for upward movement. There is a possibility of a break off the 1st support at 1.0949 followed by a bounce off the 2nd support at 1.0905 to continue the bullish momentum. The 1st resistance at 1.1000, characterised by a multi-swing high resistance and Fibonacci confluence with the 78.60% Fibonacci Retracement and 61.80% Fibonacci Projection, and the 2nd resistance at 1.1084, acting as another multi-swing high resistance, further reinforce the potential bullish scenario.
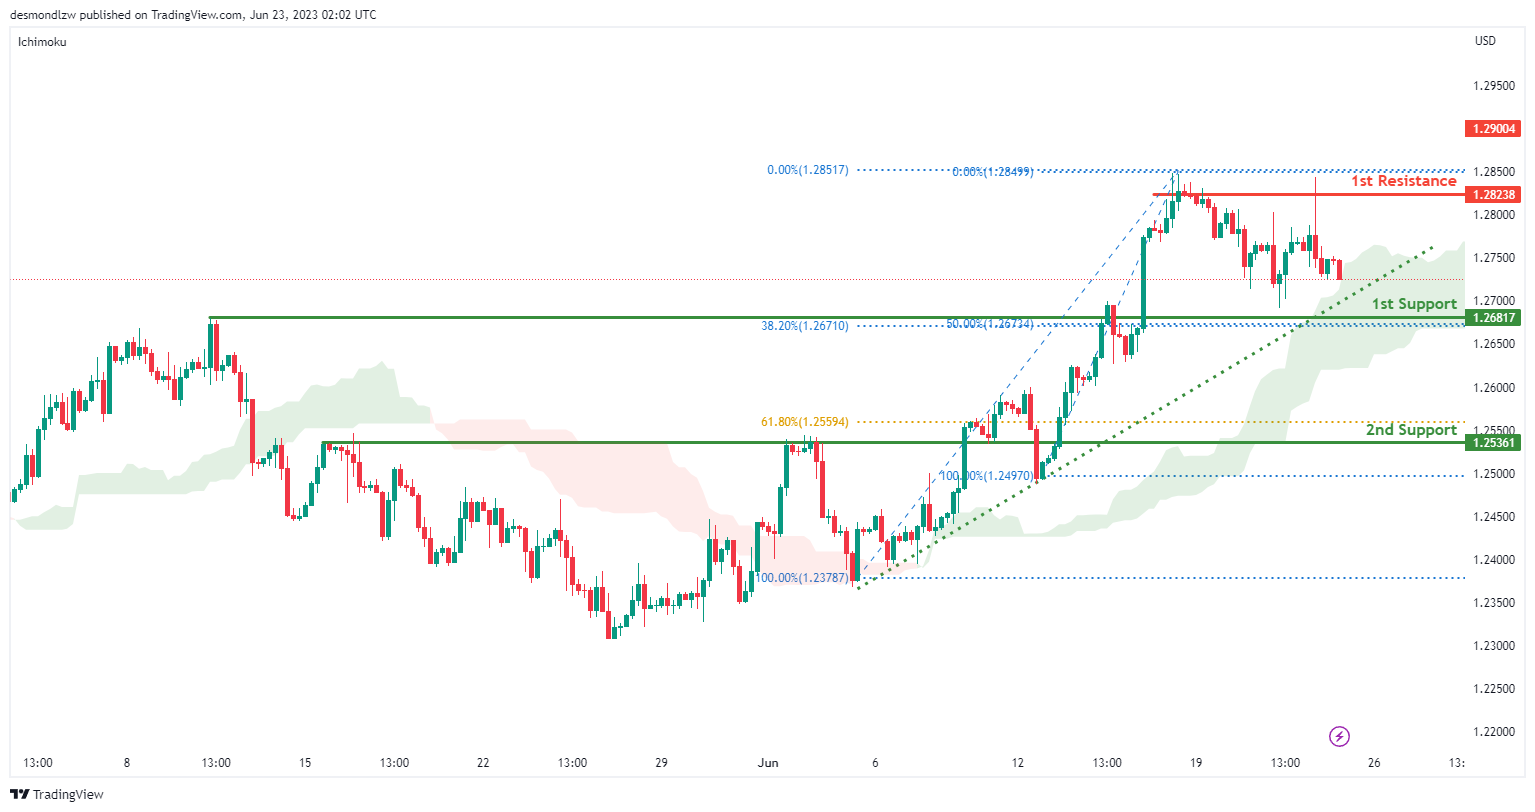
GBP/USD:
The GBP/USD chart demonstrates a bullish momentum as the price remains above the bullish Ichimoku cloud and a major ascending trend line, indicating further potential for upward movement. There is a possibility of a bullish bounce off the 1st support at 1.2681, accompanied by the presence of an overlap support, a 38.20% Fibonacci Retracement, and a 50% Fibonacci Retracement, indicating Fibonacci confluence. This combination of factors suggests a potential bullish scenario, with the price potentially heading towards the 1st resistance at 1.2823, which is characterised by its significance as a multi-swing high resistance.
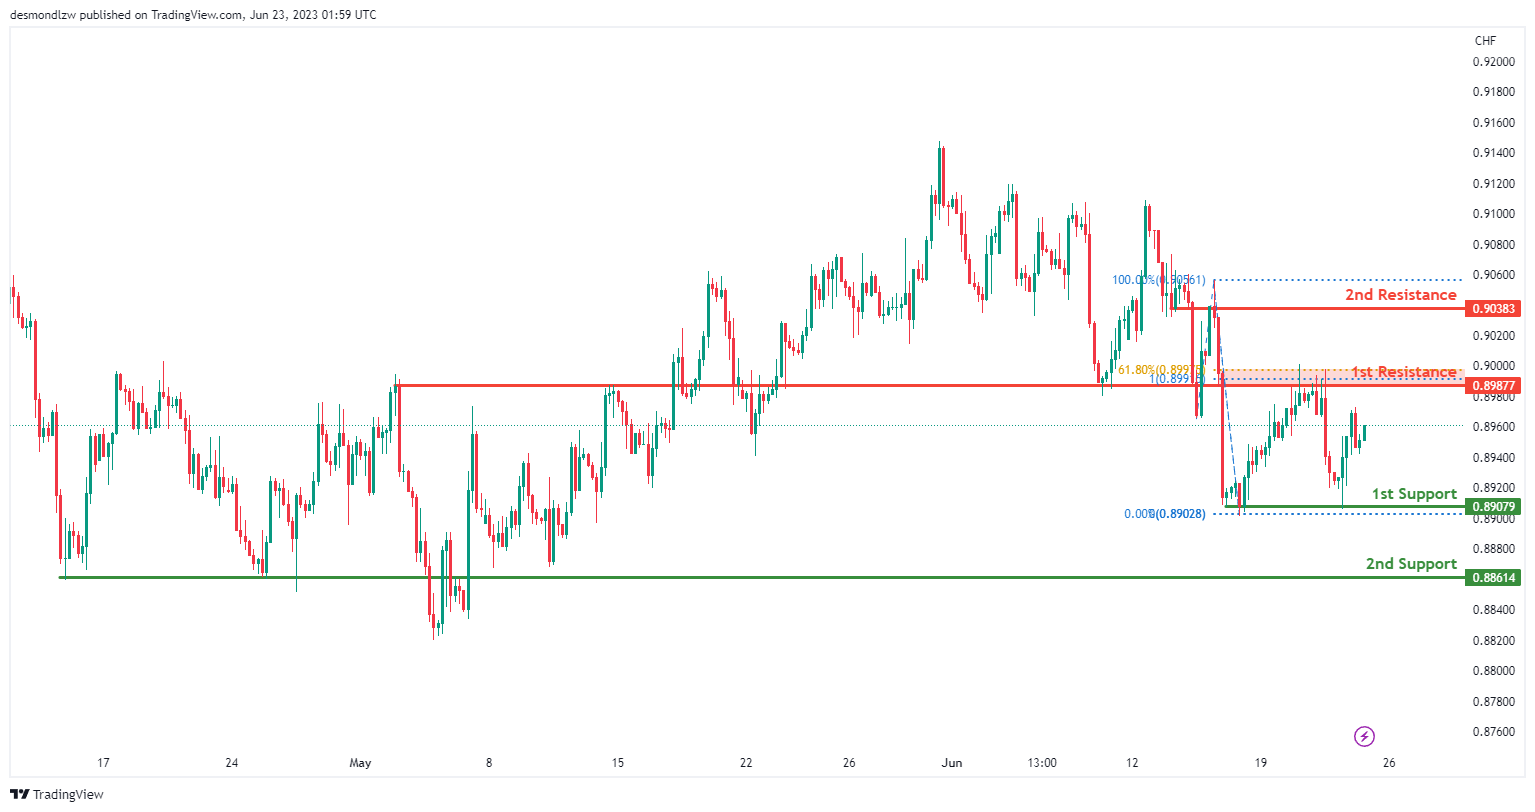
USD/CHF:
The USD/CHF chart exhibits a neutral momentum, suggesting a lack of clear direction in the market. As a result, the price could potentially fluctuate between the 1st resistance at 0.8987, which is characterised by its significance as an overlap resistance and Fibonacci confluence with the 61.80% Fibonacci Retracement and 100% Fibonacci Projection, and the 1st support at 0.8907, which acts as a multi-swing low support.
Additionally, the 2nd support at 0.8861 provides further strength as a pullback support, while the 2nd resistance at 0.9038 acts as a pullback resistance.
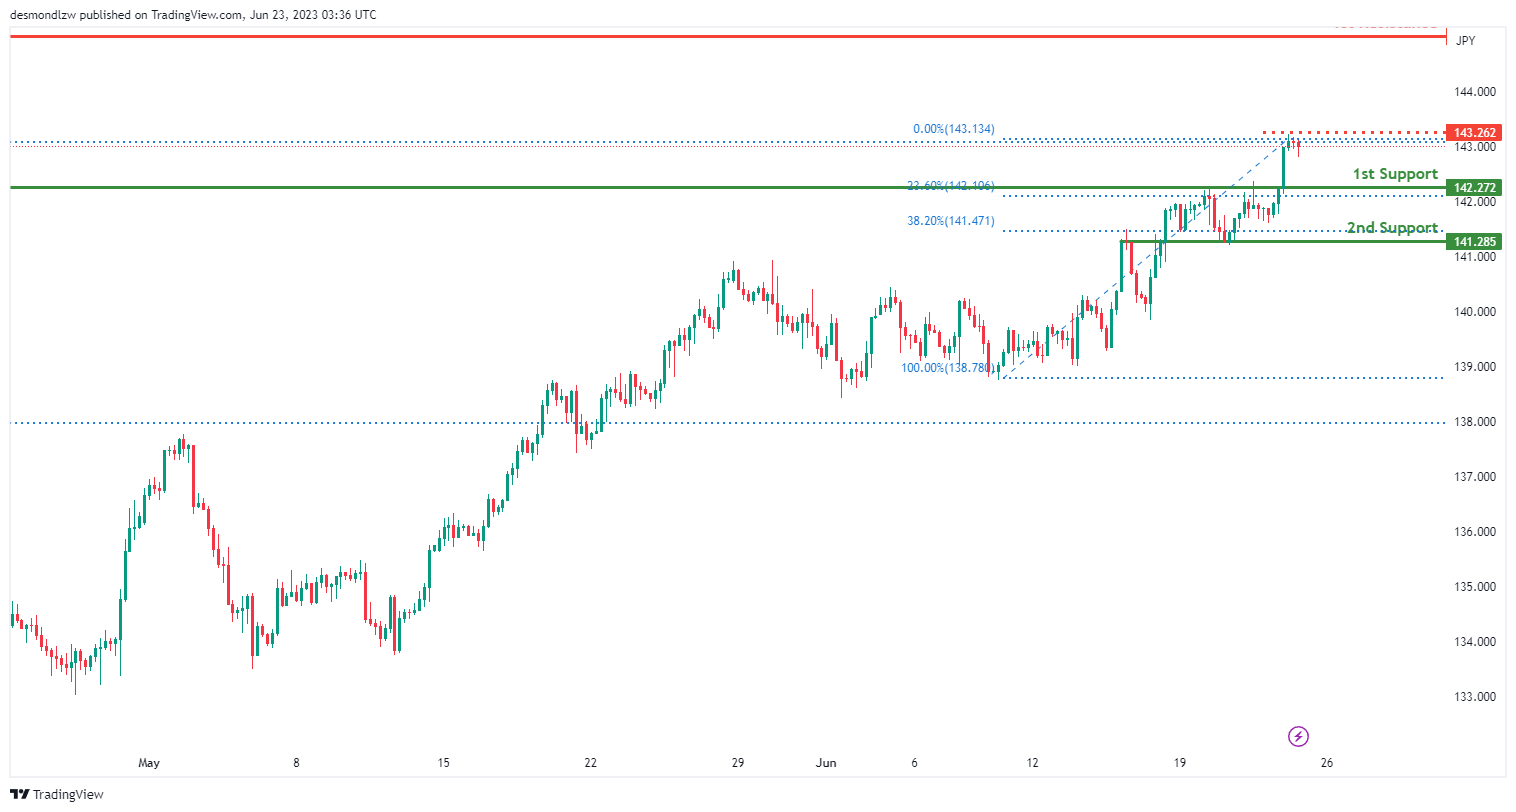
USD/JPY:
The USD/JPY chart displays a bullish momentum, suggesting the price could potentially drop further to the 1st support level in the short term before bouncing from there and rising towards the 1st resistance. The 1st support at 142.27 is considered good as it acts as pullback support and coincides with a 23.60% Fibonacci Retracement. The 2nd support at 141.28 is also favourable as it represents swing low support and aligns with a 38.20% Fibonacci Retracement, resulting in Fibonacci confluence.
On the resistance side, the 1st resistance level at 145.06 is significant as it represents an overlap resistance. Additionally, there is an intermediate resistance at 143.26, which is notable for its association with a 161.80% Fibonacci Extension on the Daily timeframe.
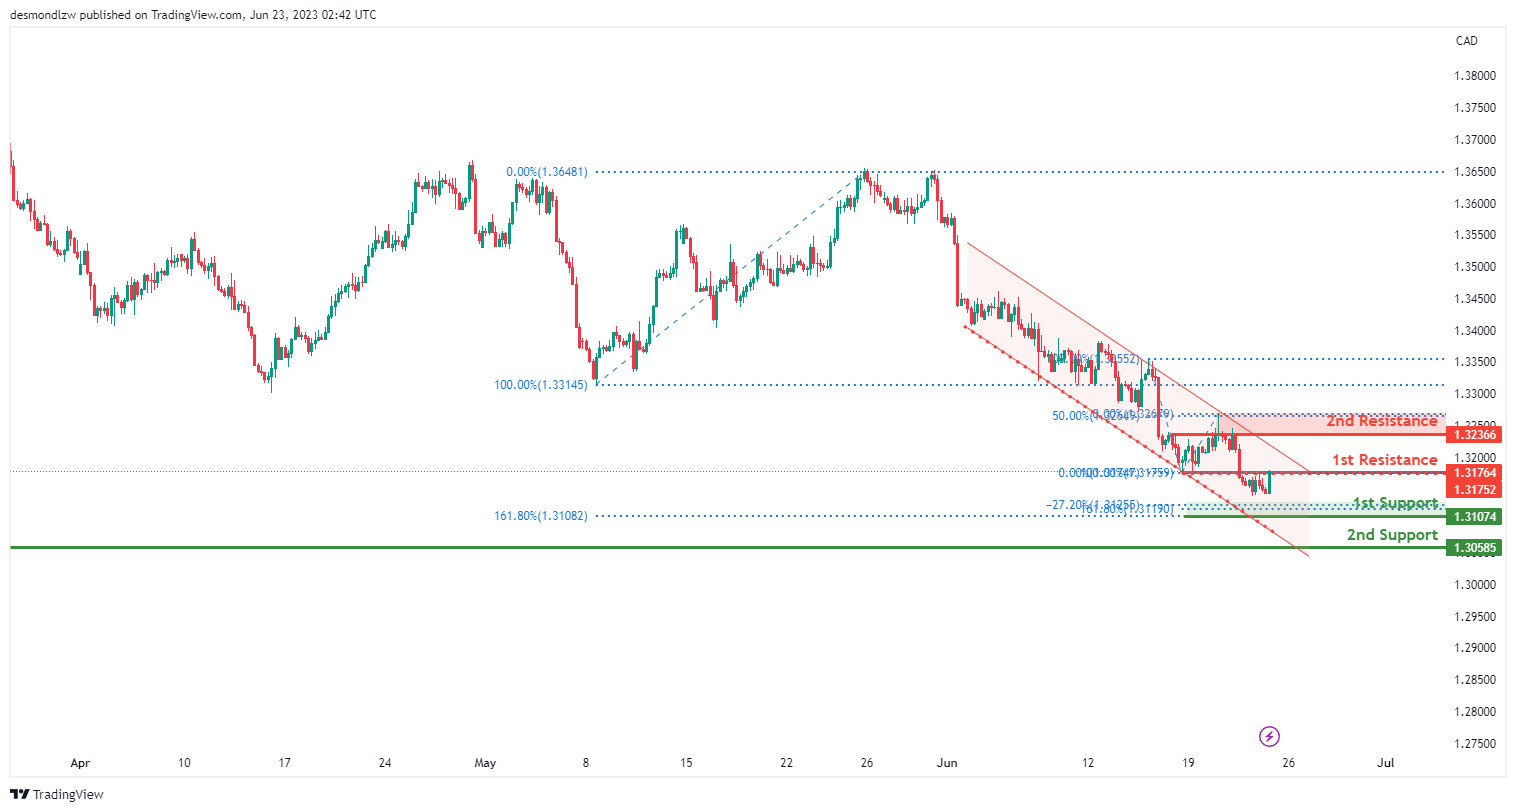
USD/CAD:
The USD/CAD chart indicates a bearish momentum as the price remains below the bearish Ichimoku cloud and within a bearish channel, suggesting a potential continuation of the downward movement. There is a possibility of a bearish reaction off the 1st resistance at 1.3176, followed by a drop towards the 1st support at 1.3107. The 1st support level is significant as it aligns with the -27% Fibonacci Expansion and the 161.80% Fibonacci Extension, providing additional strength to the support zone.
The 2nd support at 1.3058 acts as a pullback support. On the upside, the 1st resistance at 1.3176 represents an overlap resistance, while the 2nd resistance at 1.3236 is characterised as a swing high resistance and coincides with the 50% Fibonacci Retracement. These factors contribute to the overall bearish scenario of the chart.
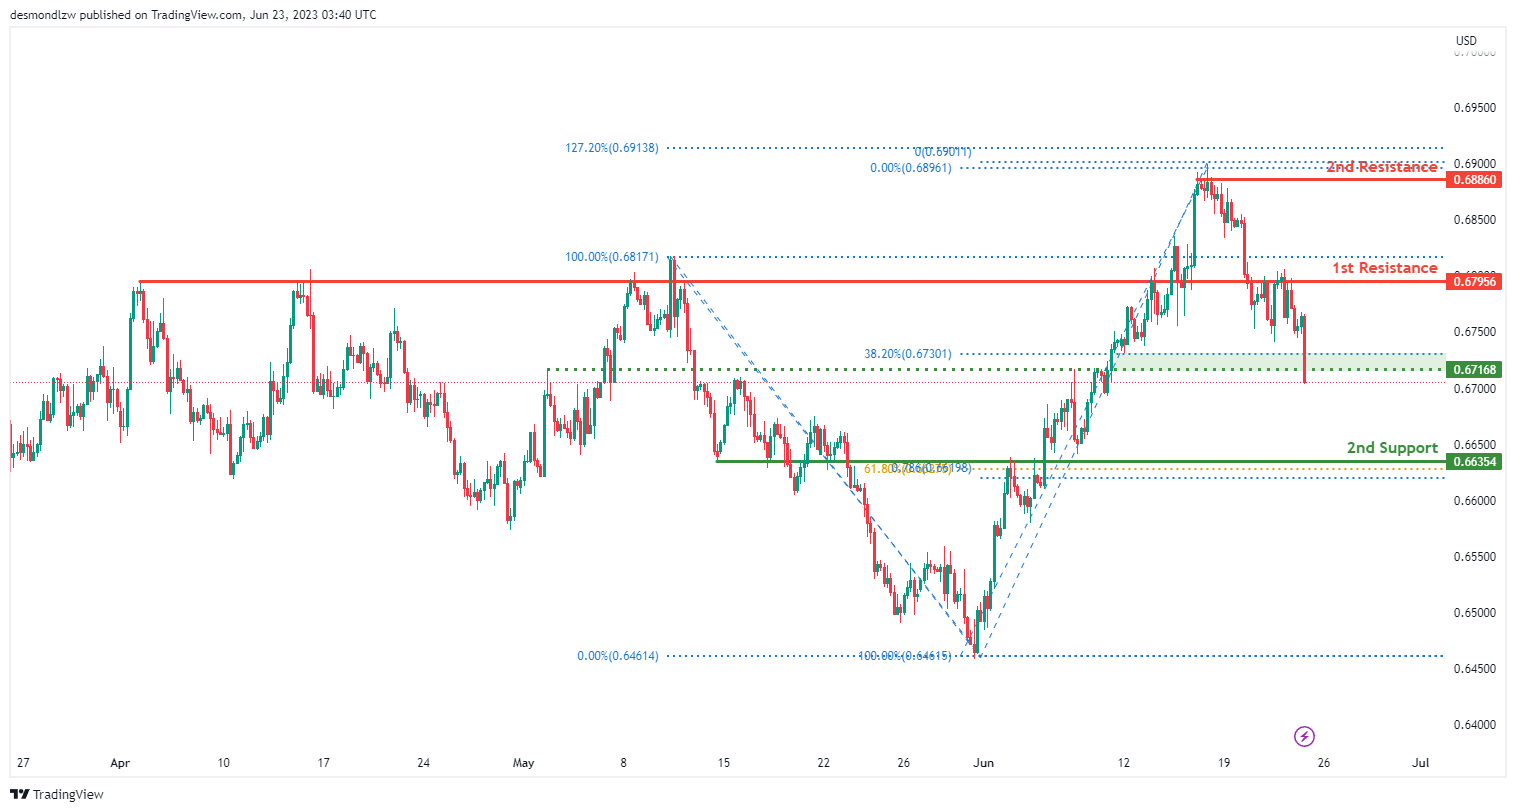
AUD/USD:
The AUD/USD chart exhibits a bearish momentum, suggesting a potential bearish continuation towards the first support level at 0.6635. This support level is favorable due to its characteristics as an overlap support and the presence of a 61.80% Fibonacci Retracement and a 78.60% Fibonacci Projection, which is known as Fibonacci confluence.
Conversely, the first resistance level at 0.6795 is notable for being an overlap resistance. Furthermore, the second resistance level at 0.6886 is significant as it acts as a swing high resistance and coincides with a 127.20% Fibonacci Extension.
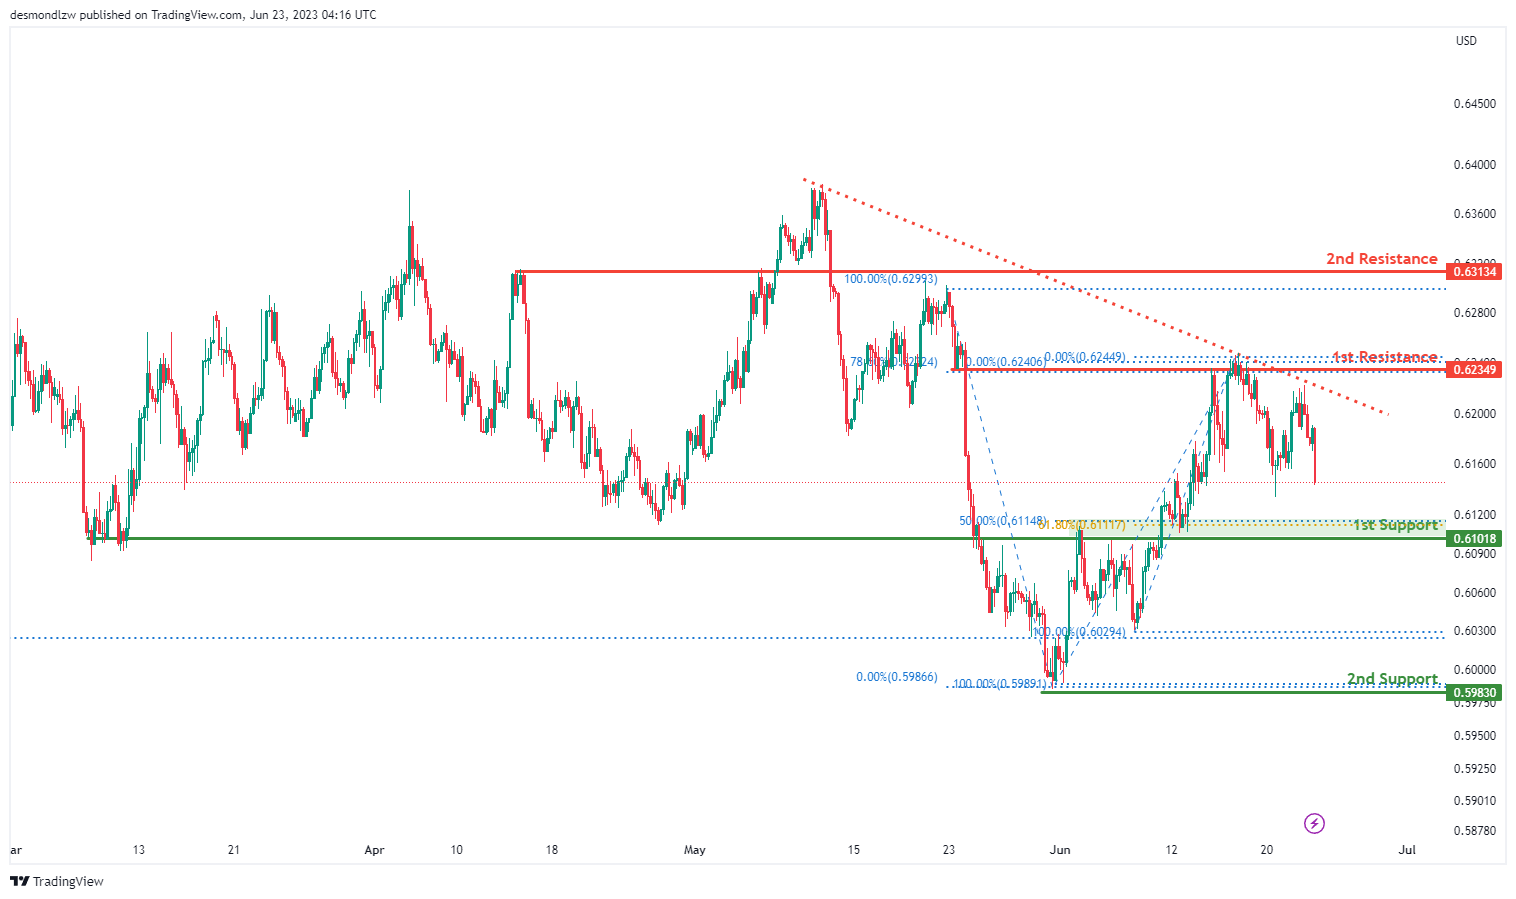
NZD/USD
The NZU/USD chart demonstrates a bearish momentum, indicating a potential bearish continuation towards the first support level at 0.6101. This support level is considered favourable due to its characteristics as an overlap support and the presence of a 61.80% Fibonacci Retracement and a 50% Fibonacci Retracement, resulting in Fibonacci confluence. Additionally, the second support level at 0.5983 is noteworthy as it represents a swing low support.
On the resistance side, the first resistance level at 0.6234 is significant as it acts as an overlap resistance and is accompanied by a 78.60% Fibonacci Retracement. Furthermore, it is testing a descending trend line that serves as resistance. As for the second resistance level at 0.6313, it is characterised as an overlap resistance.
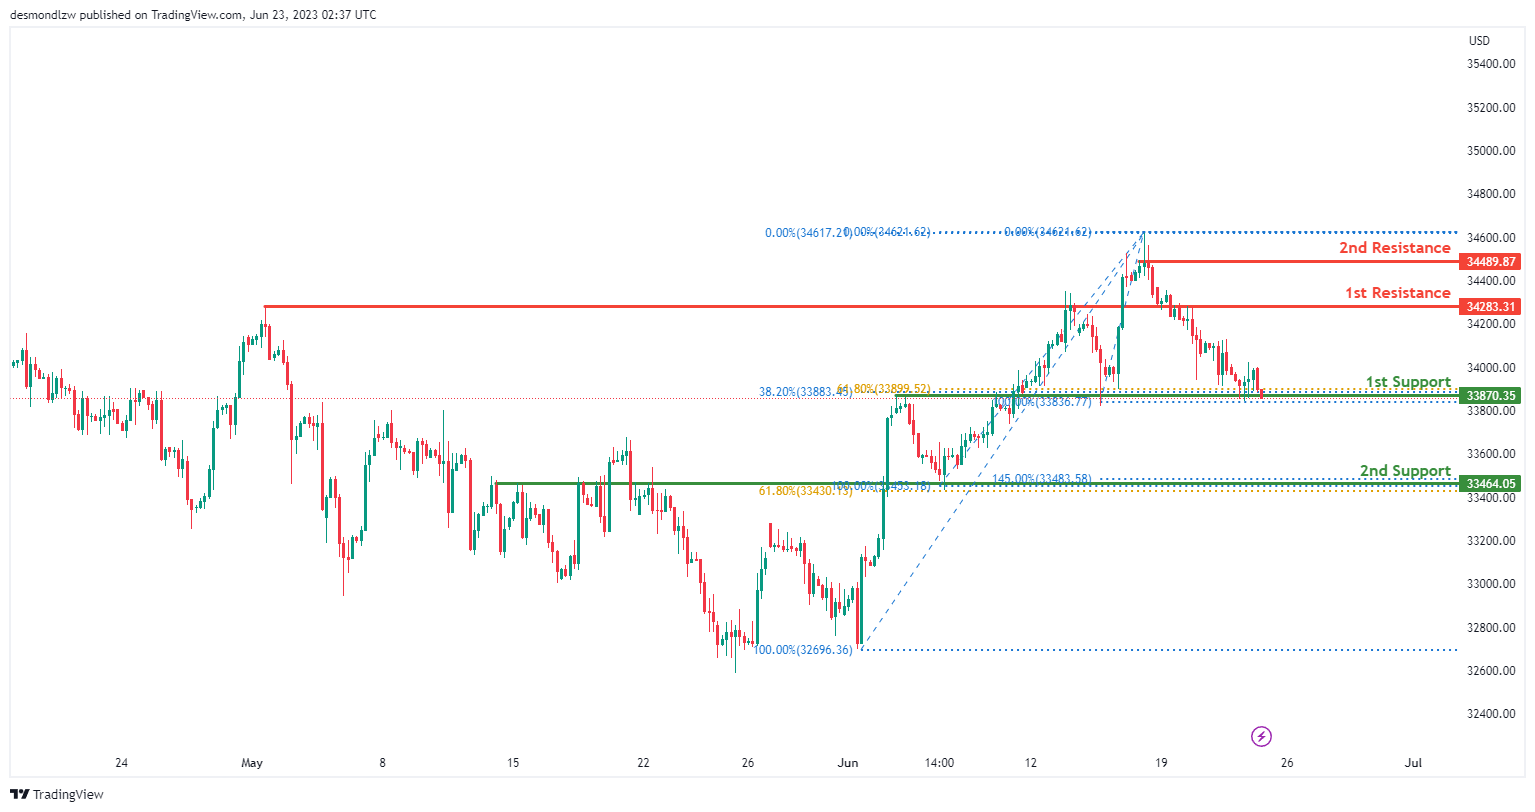
DJ30:
The DJ30 chart exhibits a weak bullish momentum with low confidence. There is a possibility of a bullish bounce off the 1st support level at 33870.35, followed by a potential move towards the 1st resistance at 34283.31. The 1st support level is significant as it represents an overlap support, reinforced by the 38.20% and 61.80% Fibonacci Retracement levels. The 2nd support at 33464.05 acts as a pullback support and is reinforced by the 61.80% Fibonacci Retracement and 145.00% Fibonacci Extension. On the upside, the 1st resistance at 34283.31 is characterized as an overlap resistance, while the 2nd resistance at 34489.87 represents a swing high resistance. These levels contribute to the overall analysis of the weak bullish momentum in the DJ30 chart.
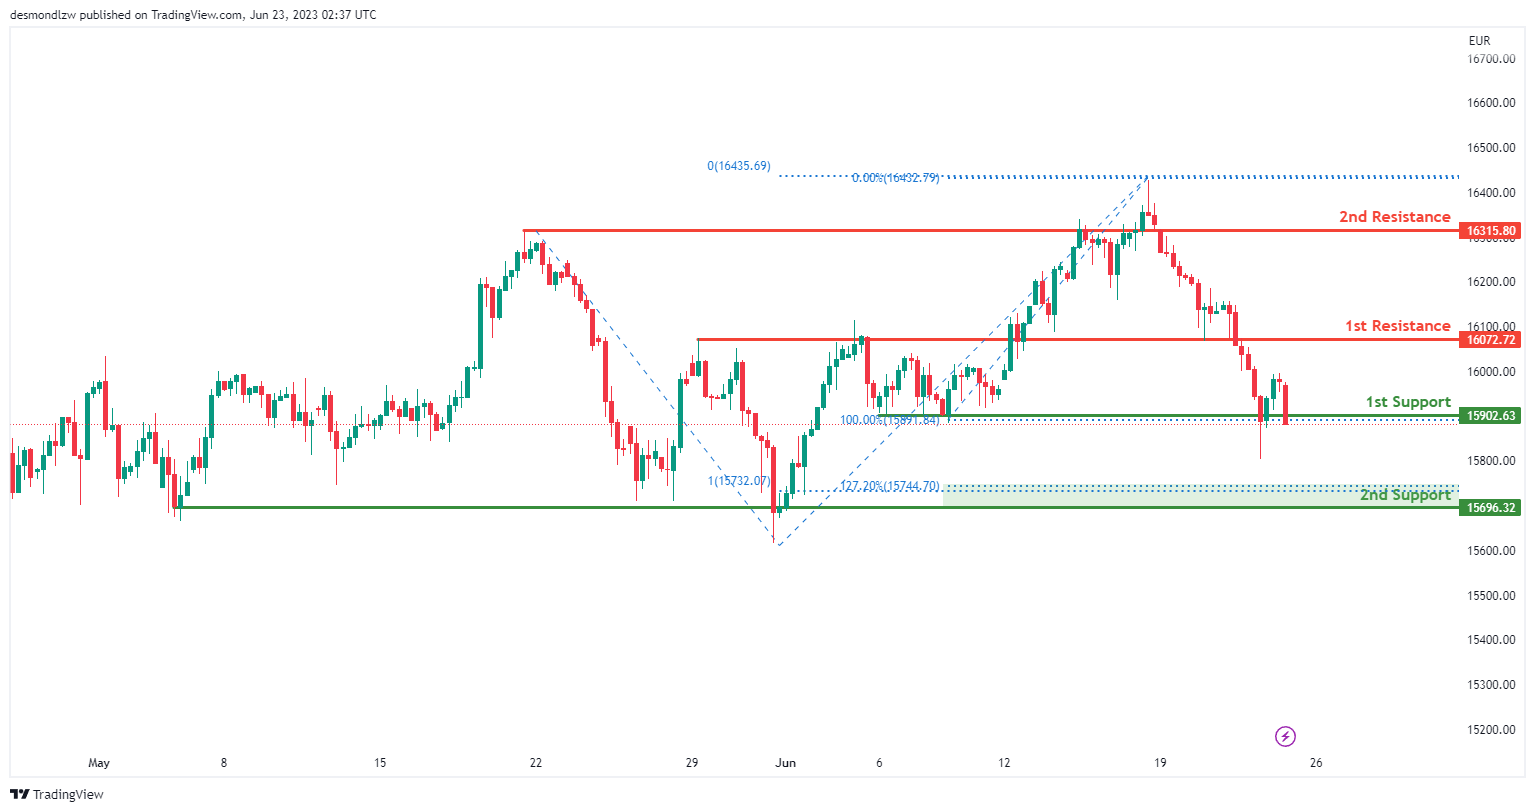
GER30:
The GER30 chart shows a bearish momentum, and there is a potential for a bearish break off the 1st support level at 15902.63, leading to a drop towards the 2nd support level at 15696.32. The 1st support level is significant as it represents a multi-swing low support. The 2nd support level is also a multi-swing low support and is reinforced by the 127.20% Fibonacci Extension. On the upside, the 1st resistance at 16072.72 acts as a pullback resistance, while the 2nd resistance at 16315.80 also functions as a pullback resistance. These levels contribute to the overall bearish analysis of the GER30 chart.
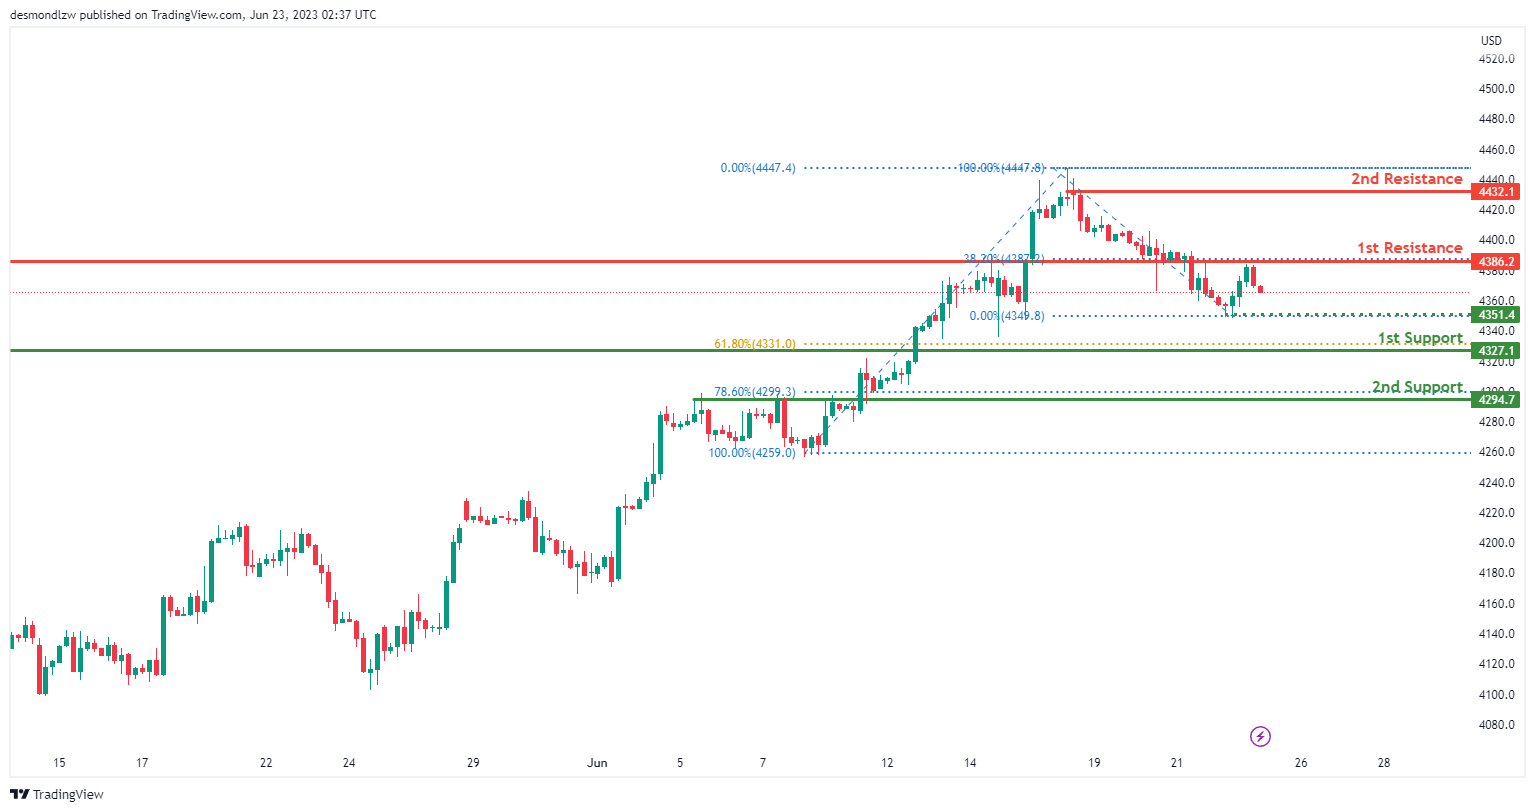
US500
The US500 chart currently exhibits a bearish momentum, and there is a potential for a bearish continuation towards the 1st support level at 4327.1. This support level is significant as it represents a pullback support and aligns with the 61.80% Fibonacci Retracement. The 2nd support level at 4294.7 acts as an overlap support and is reinforced by the 78.60% Fibonacci Retracement. On the upside, the 1st resistance at 4386.2 serves as an overlap resistance, while the 2nd resistance at 4432.1 acts as a swing high resistance.
Additionally, an intermediate support level at 4351.4 may provide temporary stability. These levels contribute to the overall bearish analysis of the US500 chart.
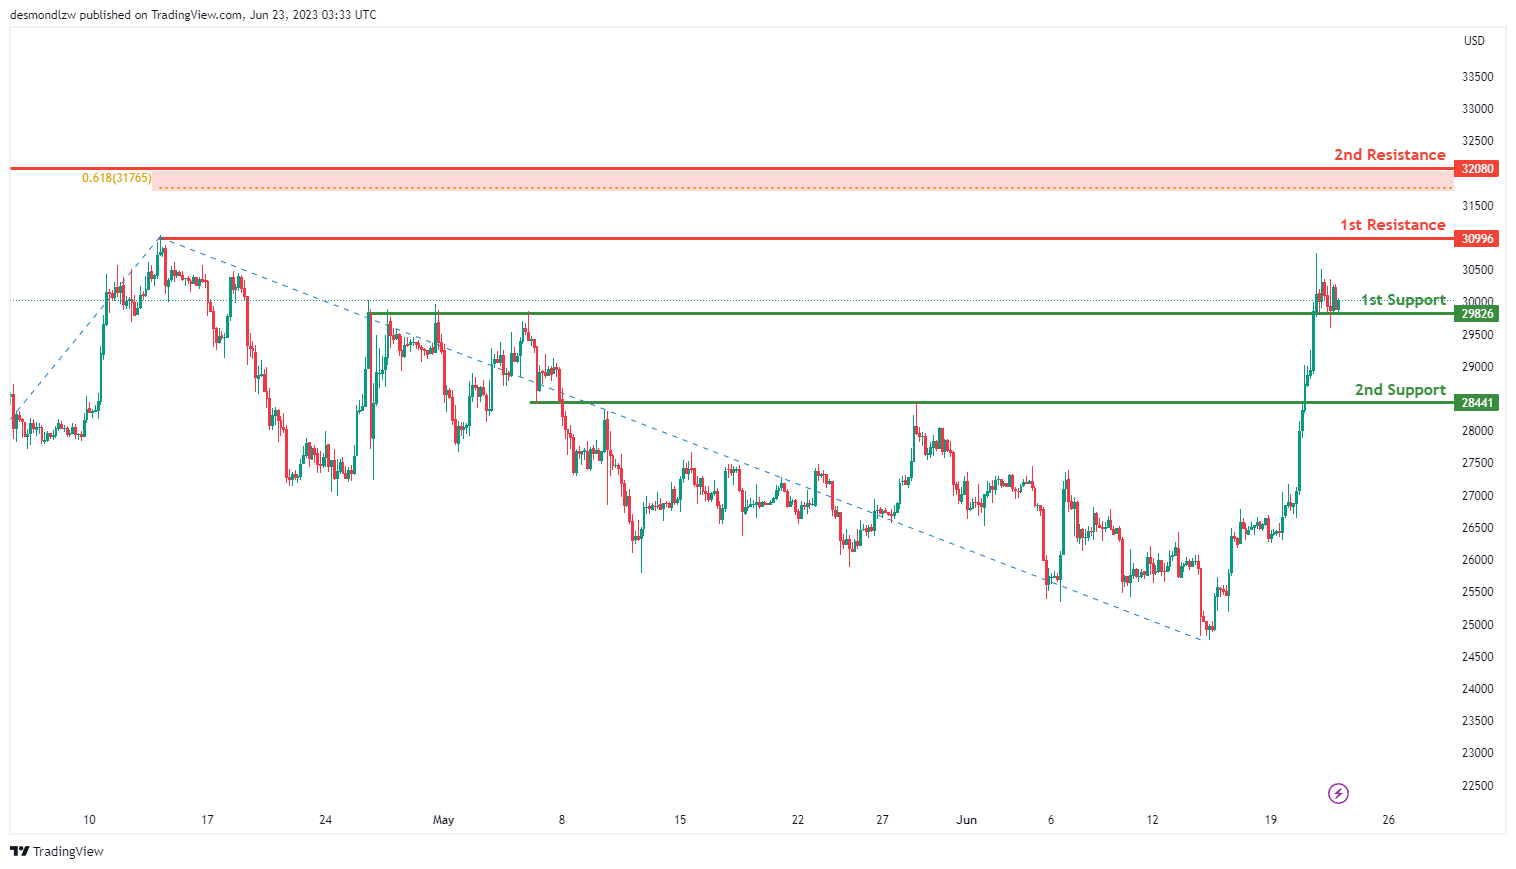
BTC/USD:
The BTC/USD chart demonstrates a bullish momentum, indicating that the price could potentially experience a bullish bounce off the 1st support level and move towards the 1st resistance. The 1st support level at 29826 is considered favorable as it acts as pullback support. Similarly, the 2nd support level at 28441 is also considered good as it represents pullback support.
On the resistance side, the 1st resistance at 30996 is significant as it represents a swing high resistance. Additionally, the 2nd resistance at 32080 is noteworthy as it acts as a swing high resistance and coincides with a 61.80% Fibonacci Projection.
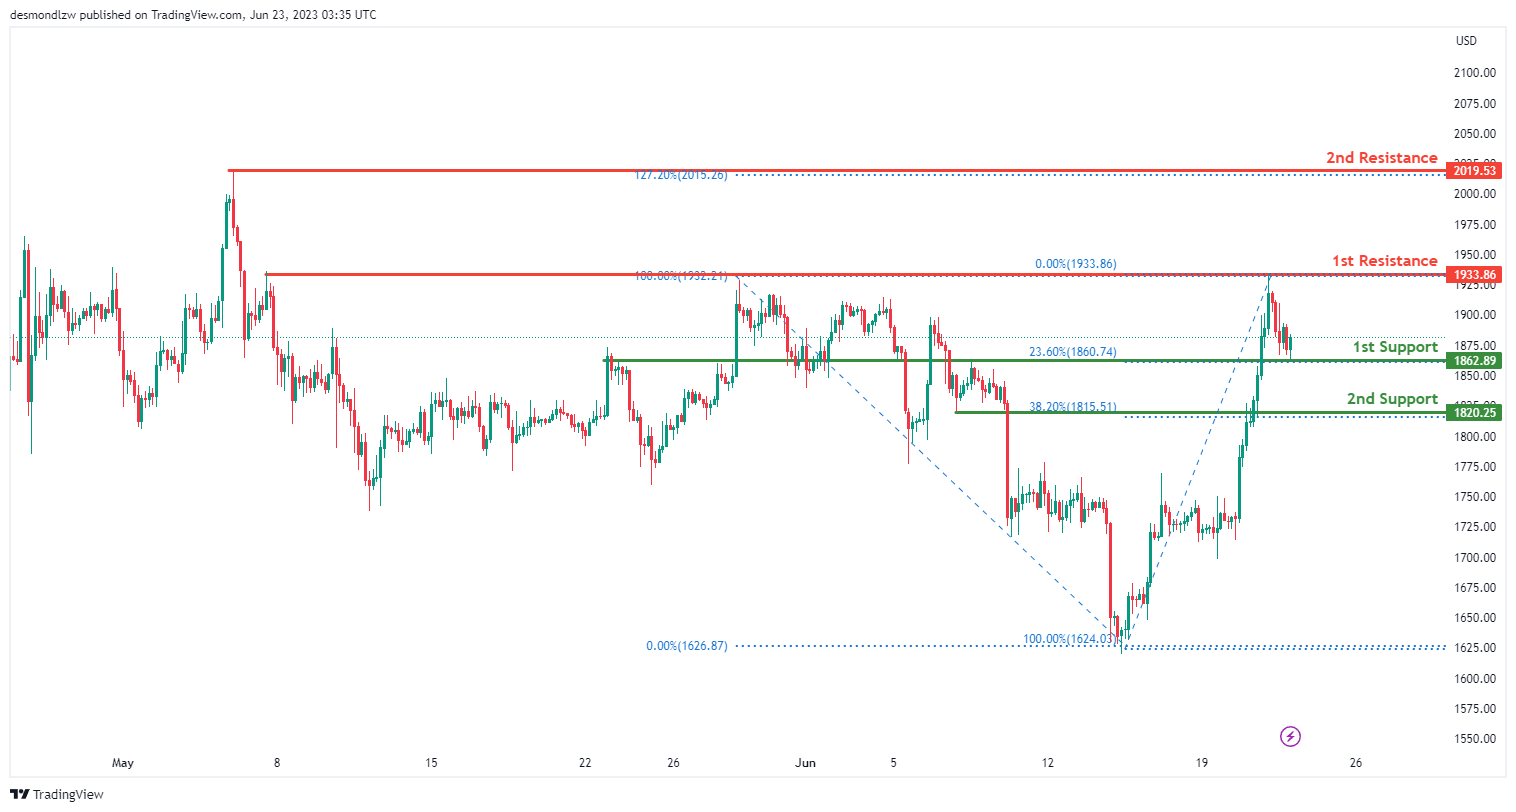
ETH/USD:
The ETH/USD chart exhibits a bullish momentum, suggesting that the price could potentially experience a bullish bounce off the 1st support level and move towards the 1st resistance. The 1st support level at 1862.89 is considered good as it acts as pullback support and coincides with a 23.60% Fibonacci Retracement. Similarly, the 2nd support level at 1820.25 is also favorable as it represents pullback support and aligns with a 38.20% Fibonacci Retracement.
On the resistance side, the 1st resistance at 1933.86 is significant as it represents multi-swing high resistance. Additionally, the 2nd resistance at 2019.53 is notable as it acts as a swing high resistance and coincides with a 127.20% Fibonacci Extension.
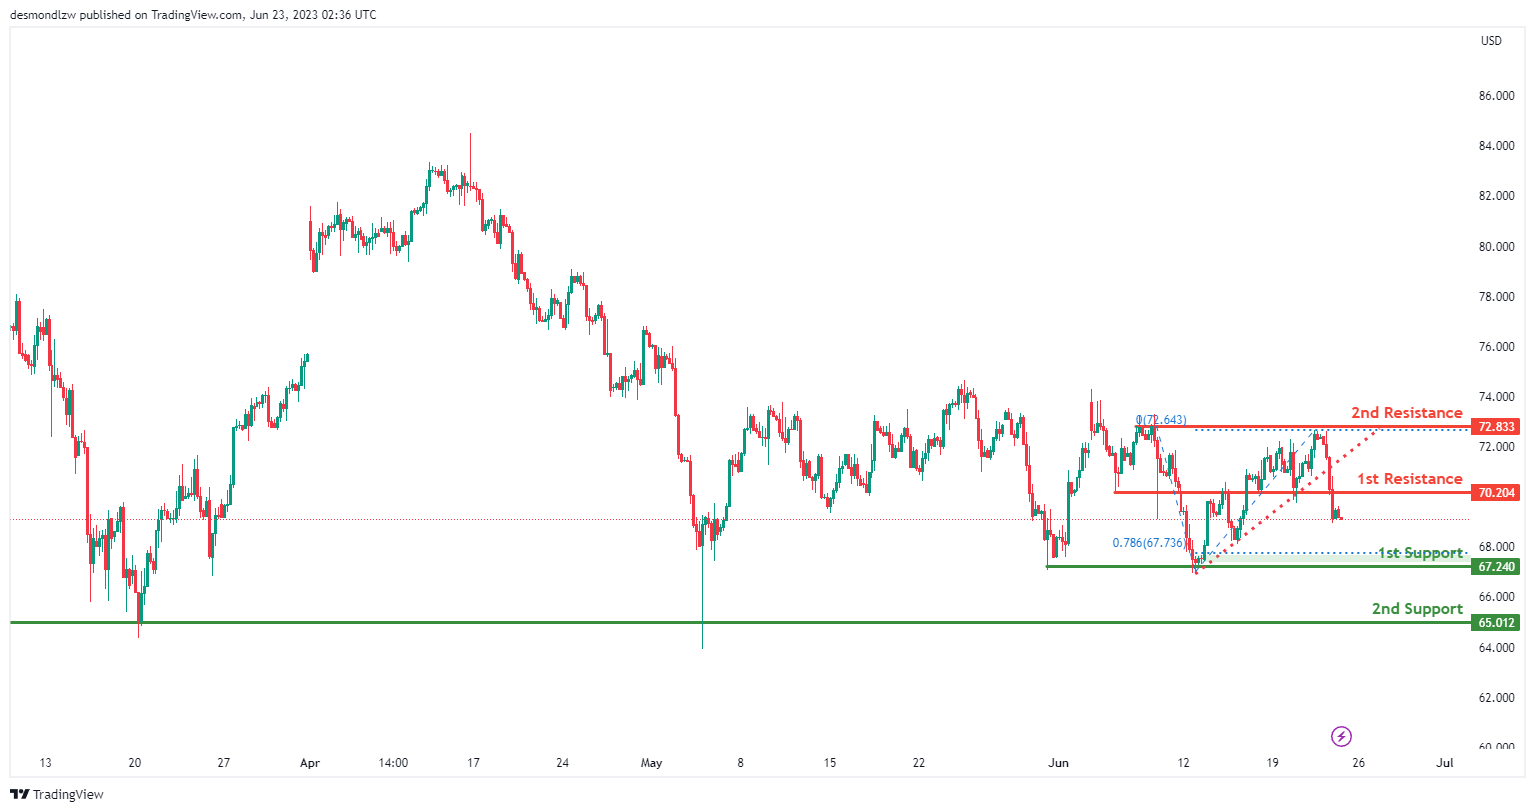
WTI/USD:
The WTI chart demonstrates a bearish momentum, supported by the fact that the price is below a major descending trend line, indicating the potential for further downward movement.
In terms of potential price action, there is a possibility of a bearish continuation towards 1st support level at 67.24. This support level is significant as it represents a multi-swing low support and coincides with the 78.60% Fibonacci Projection. Additionally, 2nd support level at 65.01 acts as another multi-swing low support, providing additional reinforcement to the support zone.
On the upside, 1stt resistance level at 70.20 serves as a pullback resistance, potentially impeding upward price movement. Similarly, 2nd resistance level at 72.83 is identified as a multi-swing high resistance, further adding to its significance in hindering further advancement.
These support and resistance levels, along with the bearish momentum, suggest a potential bearish continuation towards 1st support level.
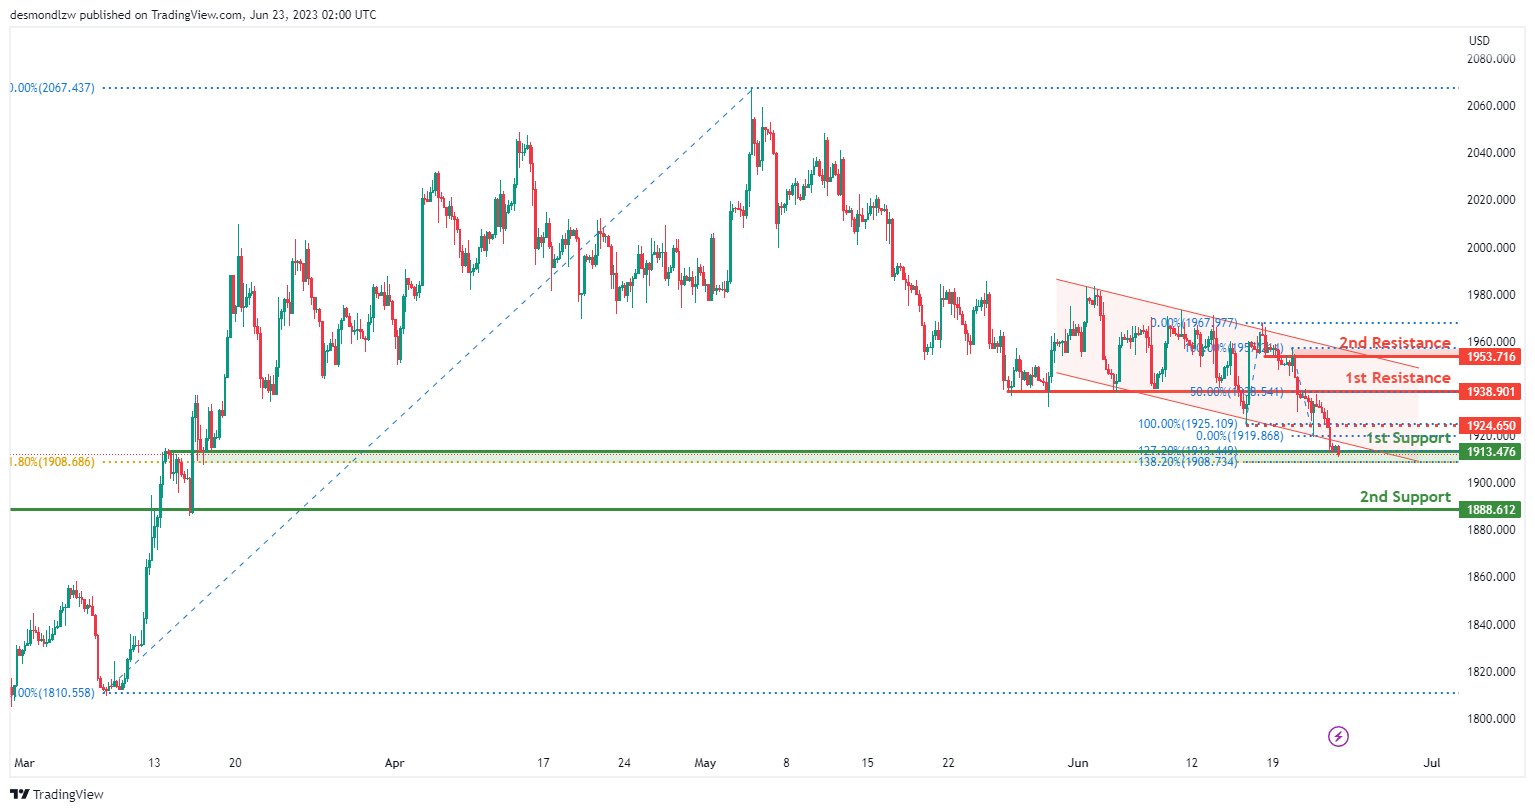
XAU/USD (GOLD):
The XAU/USD chart demonstrates a bearish momentum as the price breaks from the lower channel line, indicating a continuation of the prior bearish trend. In the short term, there is a potential for the price to rise towards the 1st resistance at 1938.90 before reversing off it and dropping towards the 1st support at 1913.47. This support level is considered significant as it represents an overlap support and coincides with the 61.80% Fibonacci Retracement. Additionally, the 2nd support at 1888.61 acts as another overlap support. On the upside, the 1st resistance at 1938.90 is an overlap resistance, reinforced by the 50% Fibonacci Retracement. The 2nd resistance at 1953.71 also acts as an overlap resistance. Furthermore, an intermediate resistance at 1924.65 may also influence price movements.


