
DXY:
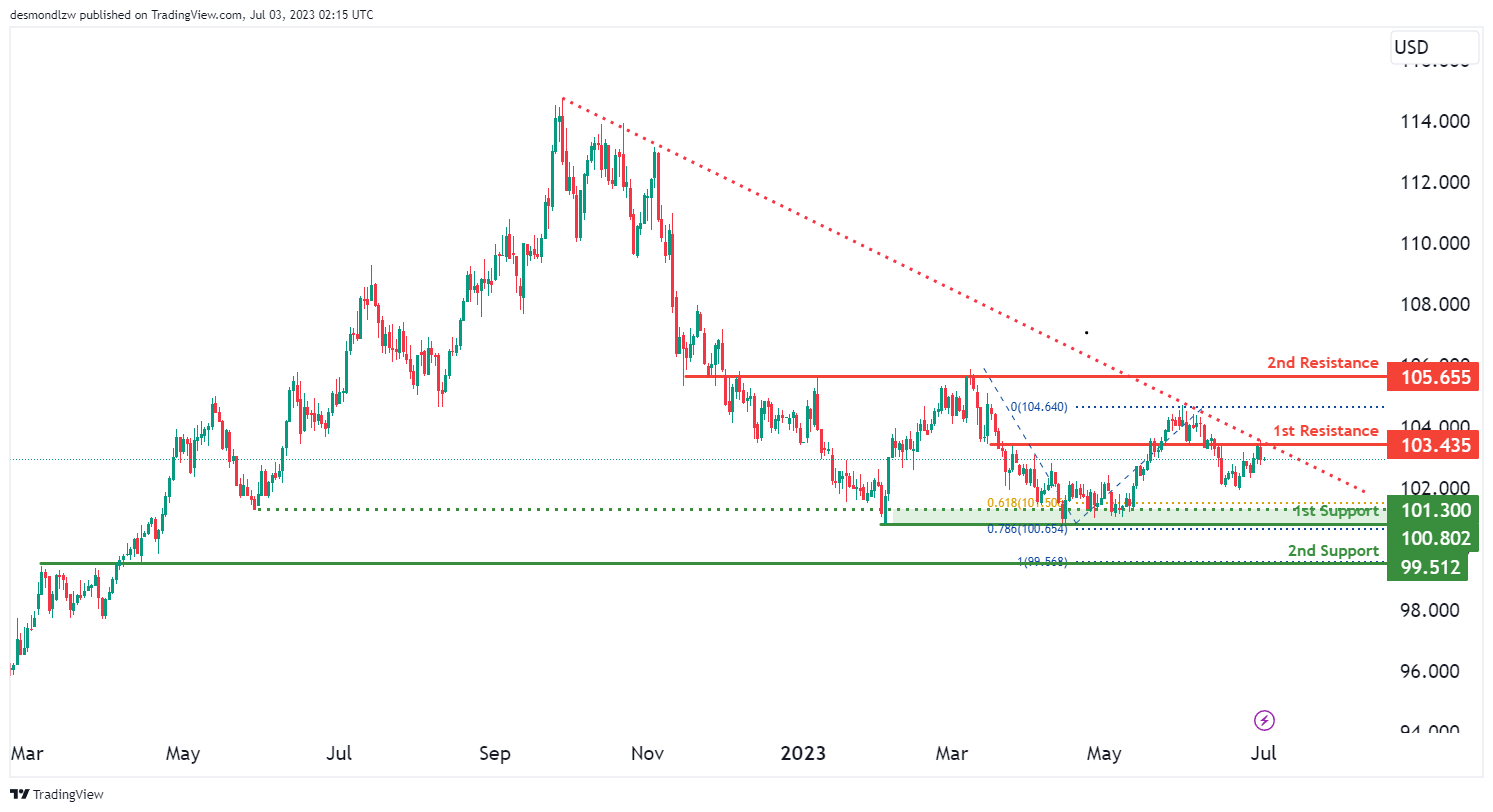
The DXY (US Dollar Index) chart exhibits a bearish momentum, indicated by the price being below a major descending trend line, suggesting the potential for further downward movement. The price is currently testing this descending trend line, which acts as a resistance.
There is a possibility for a bearish reaction off the 1st resistance level at 103.43, leading to a drop towards the 1st support level at 100.80. The 1st support level is considered a significant multi-swing low support, further reinforced by the presence of the 78.60% Fibonacci Projection. Additionally, the 2nd support level at 99.51 is identified as an overlap support and coincides with the 100% Fibonacci Projection.
On the upside, the 1st resistance level at 103.43 is an overlap resistance. Furthermore, the 2nd resistance level at 105.65 is also categorized as an overlap resistance, indicating its potential role in impeding upward price advancement. An intermediate support level at 101.30 adds further significance as a multi-swing low support, aligning with the 61.80% Fibonacci Projection.
EUR/USD:
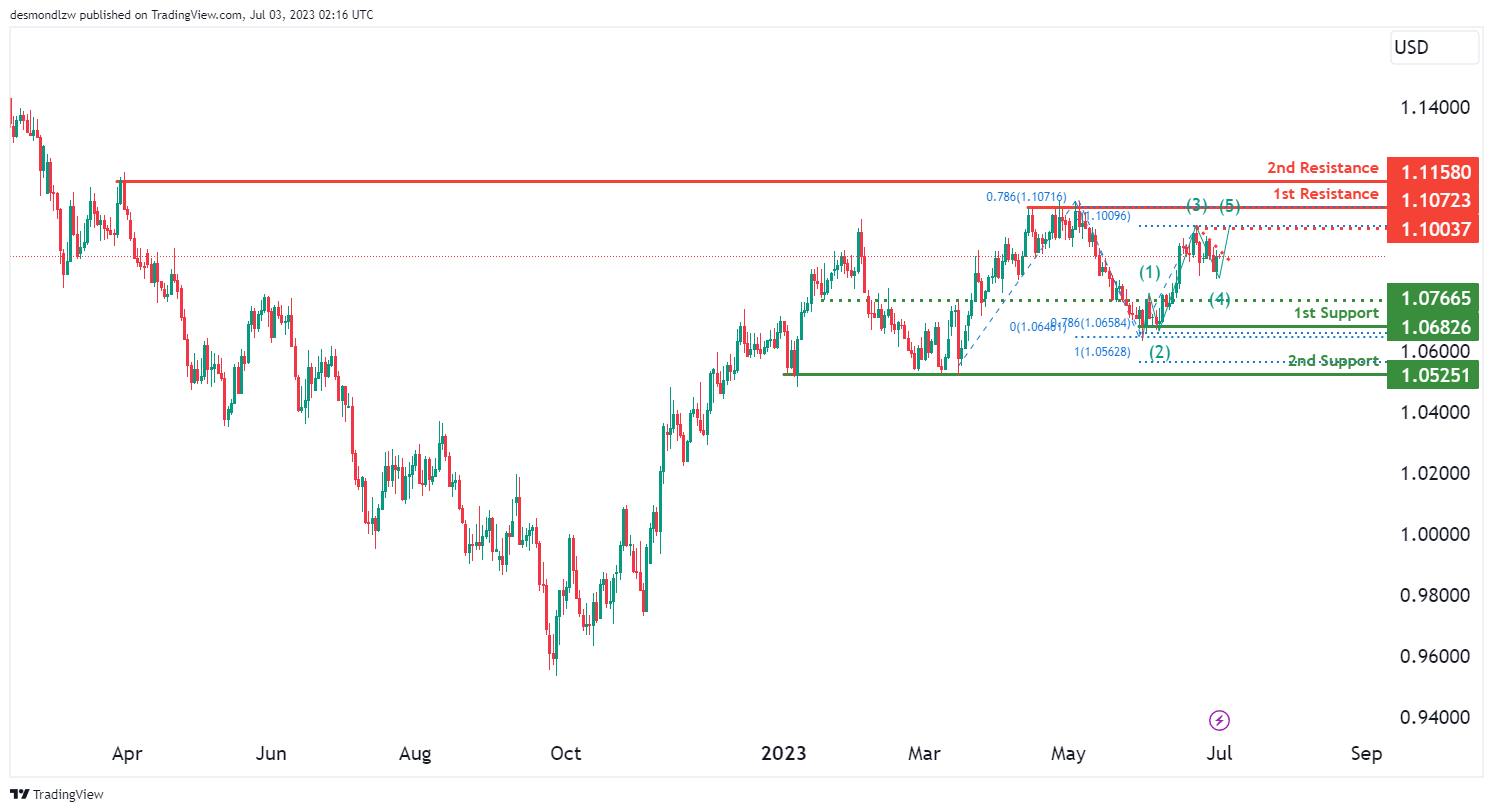
The EUR/USD chart currently exhibits a bullish momentum, suggesting an overall upward trend in the market.
There is a possibility for a bearish continuation towards the 1st support level at 1.0682. This support level is identified as a multi-swing low support and is further reinforced by the presence of the 78.60% Fibonacci Projection. Additionally, the 2nd support level at 1.0525 serves as another multi-swing low support and aligns with the 100% Fibonacci Projection.
On the upside, the 1st resistance level at 1.1072 represents a multi-swing high resistance, accompanied by the 78.60% Fibonacci Projection. Furthermore, the 2nd resistance level at 1.1158 is categorized as a swing high resistance.
An intermediate resistance level at 1.1003 adds further significance as a swing high resistance.
GBP/USD:
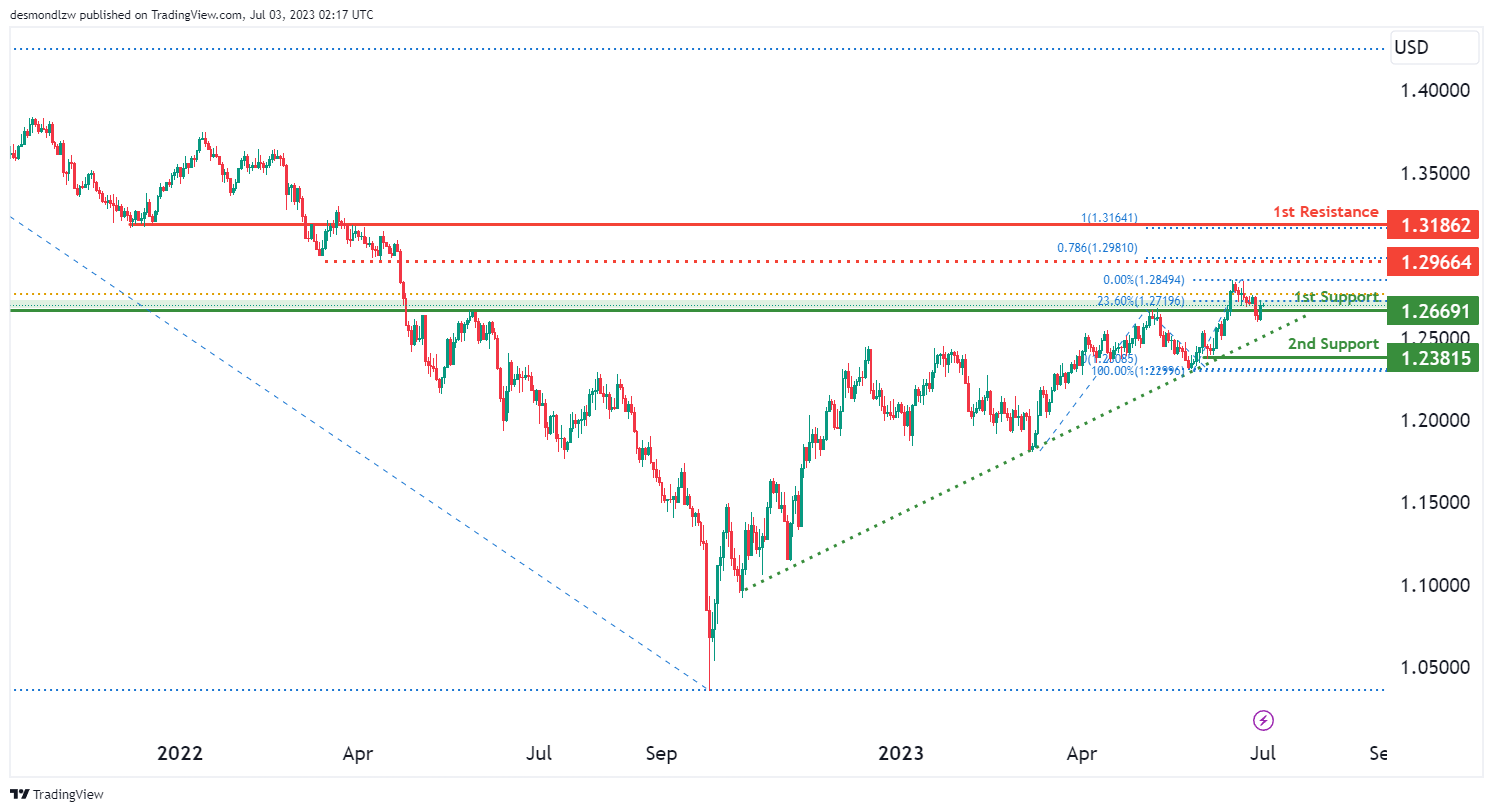
The GBP/USD chart currently demonstrates a bullish momentum, indicating a potential for further upward movement in the market. This bullish momentum is supported by the fact that the price is above a major ascending trend line, suggesting a continuation of the bullish trend.
There is a possibility for a bullish bounce off the 1st support level at 1.2669. This support level is identified as an overlap support and is further reinforced by the presence of the 23.60% Fibonacci Retracement. Additionally, the 2nd support level at 1.2381 represents a swing low support.
On the upside, the 1st resistance level at 1.3186 acts as an overlap resistance. Furthermore, an intermediate resistance level at 1.2966 serves as a pullback resistance.
USD/CHF:
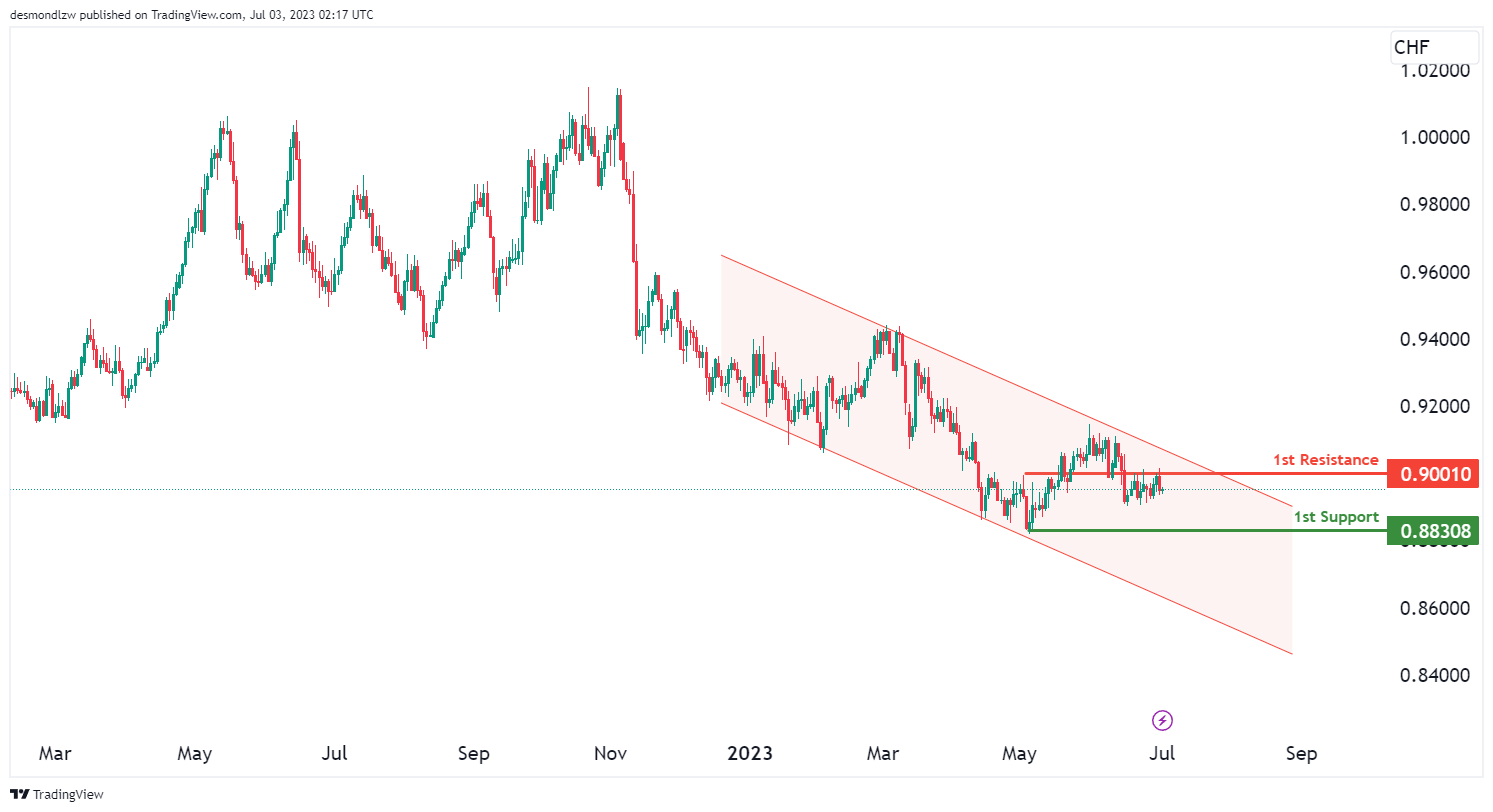
The USD/CHF chart currently demonstrates a bearish momentum, indicating a downward trend in the market. This is supported by the fact that the price is within a bearish descending channel, suggesting the potential for further downward movement.
There is a possibility for a bearish continuation towards the 1st support level at 0.8830. This support level is identified as a swing low support.
On the upside, the 1st resistance level at 0.9001 acts as an overlap resistance.
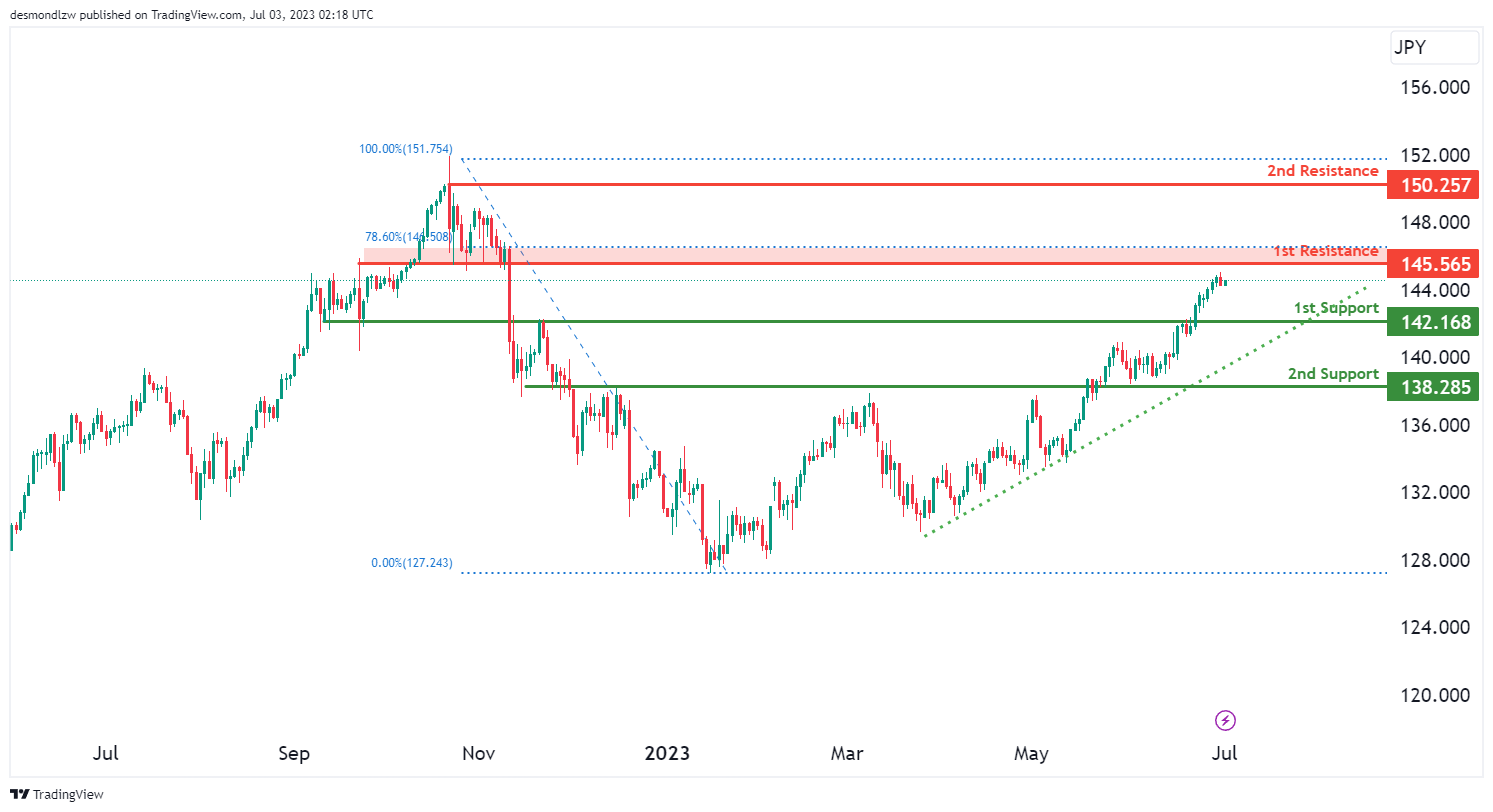
USD/JPY:
The USD/JPY chart currently demonstrates a bearish momentum, suggesting a downward trend in the market. This is supported by the fact that the price is above a major ascending trend line, which indicates potential bullish momentum, but in this case, it might lead to a bearish reaction.
There is a possibility for a bearish reaction off the 1st resistance level at 145.56, potentially causing a drop towards the 1st support level at 142.16. The 1st support level is identified as a pullback support, while the 2nd support level at 138.28 is an overlap support.
On the upside, the 1st resistance level at 145.56 acts as a pullback resistance, coinciding with the 78.60% Fibonacci Retracement. The 2nd resistance level at 150.25 represents a swing high resistance.
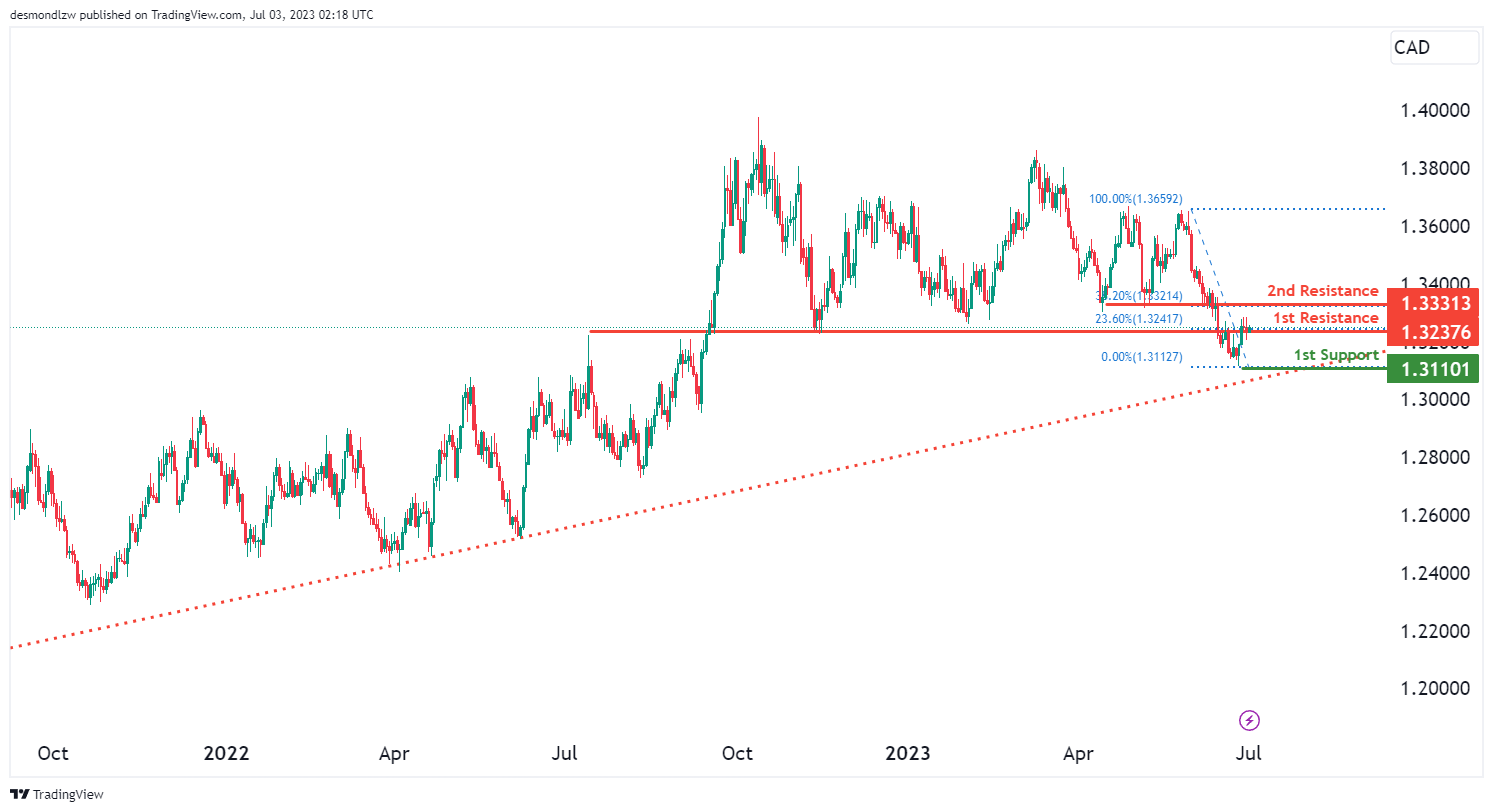
USD/CAD:
The instrument USD/CAD exhibits an overall bearish momentum. This momentum is attributed to the potential bearish reaction off the first resistance, potentially leading to a drop down to the first support. The first support stands at 1.3110, offering a robust level due to its positioning as a swing low support.
Moving higher, the first resistance is found at 1.3237, which acts as a pullback resistance and also signifies the 23.60% Fibonacci retracement.
Beyond that, the second resistance at 1.3331 serves as an overlap resistance as well as the 38.20% Fibonacci retracement point. Both resistances could contribute significantly to the bearish momentum of the USDCAD chart.
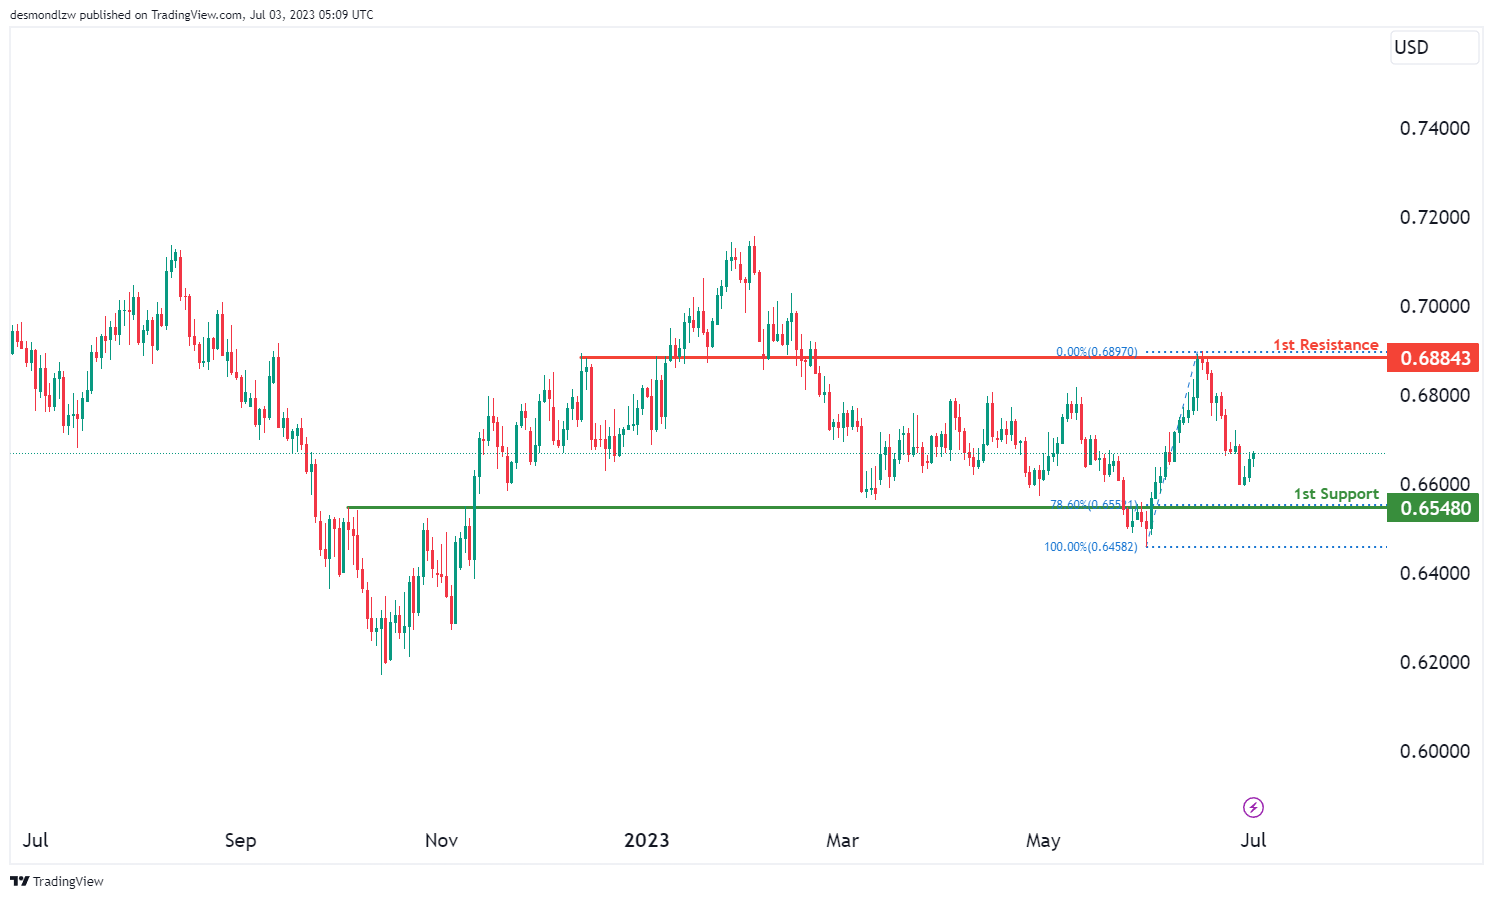
AUD/USD:
The AUD/USD chart currently exhibits a bullish momentum, suggesting an upward trend in the market.
There is a possibility for the price to continue its bullish movement towards the 1st resistance level at 0.6884. On the downside, the 1st support level at 0.6548 is identified as a pullback support, with additional significance provided by the presence of the 78.60% Fibonacci Retracement.
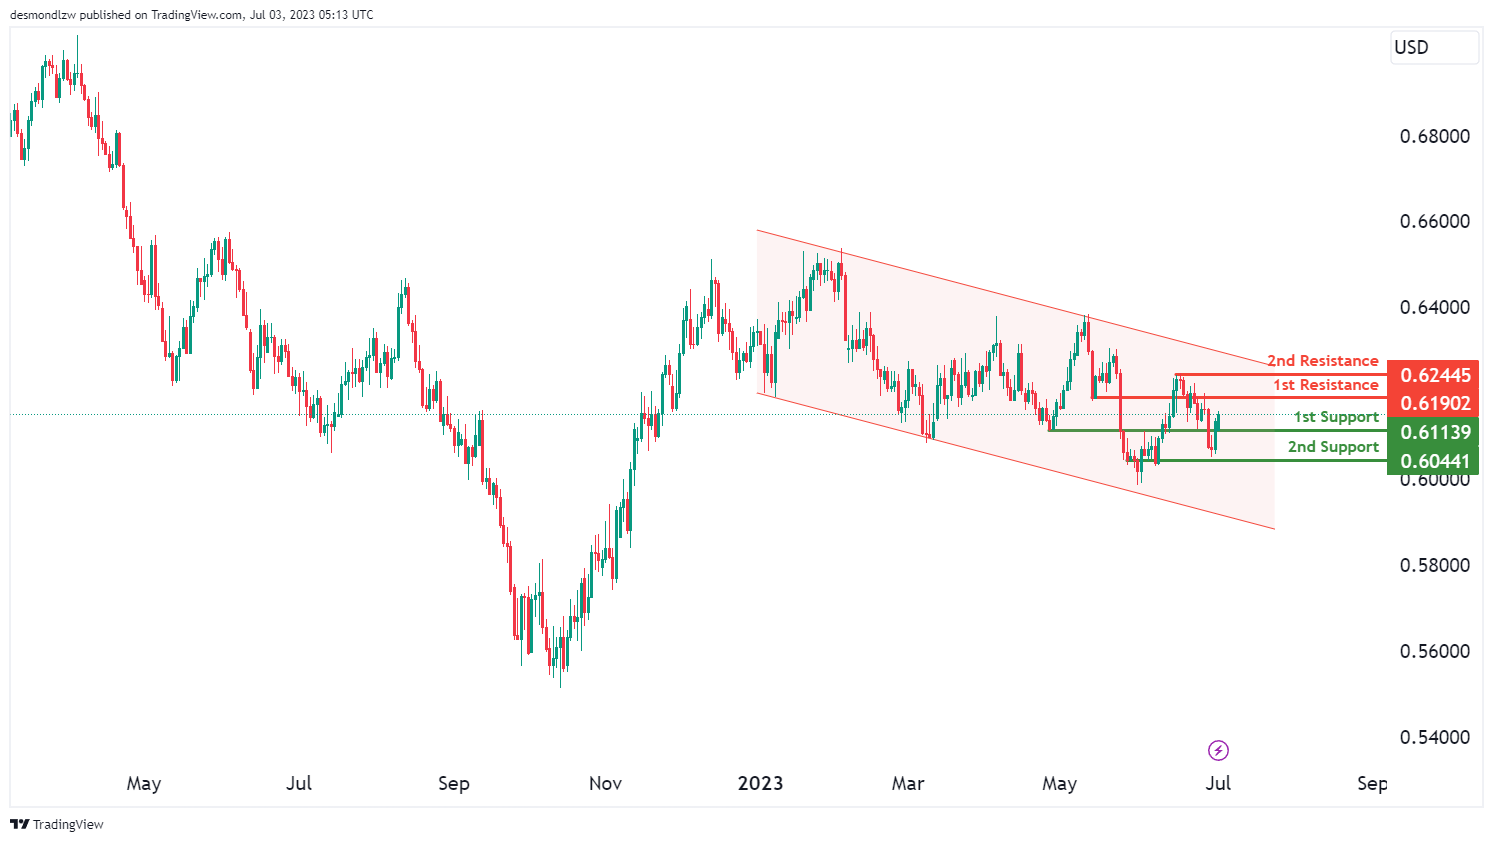
NZD/USD
The NZD/USD chart currently shows a bearish momentum, indicating a downward trend in the market. This is supported by the fact that the price is within a bearish descending channel, suggesting a continuation of the downward movement.
There is a possibility for the price to rise towards the 1st resistance level at 0.6190 in the short term before reversing off it and dropping towards the 1st support level at 0.6113. The 1st support level is identified as an overlap support, while the 2nd support level at 0.6044 represents a multi-swing low support.
On the upside, the 1st resistance level at 0.6190 acts as an overlap resistance, while the 2nd resistance level at 0.6244 represents a multi-swing high resistance.
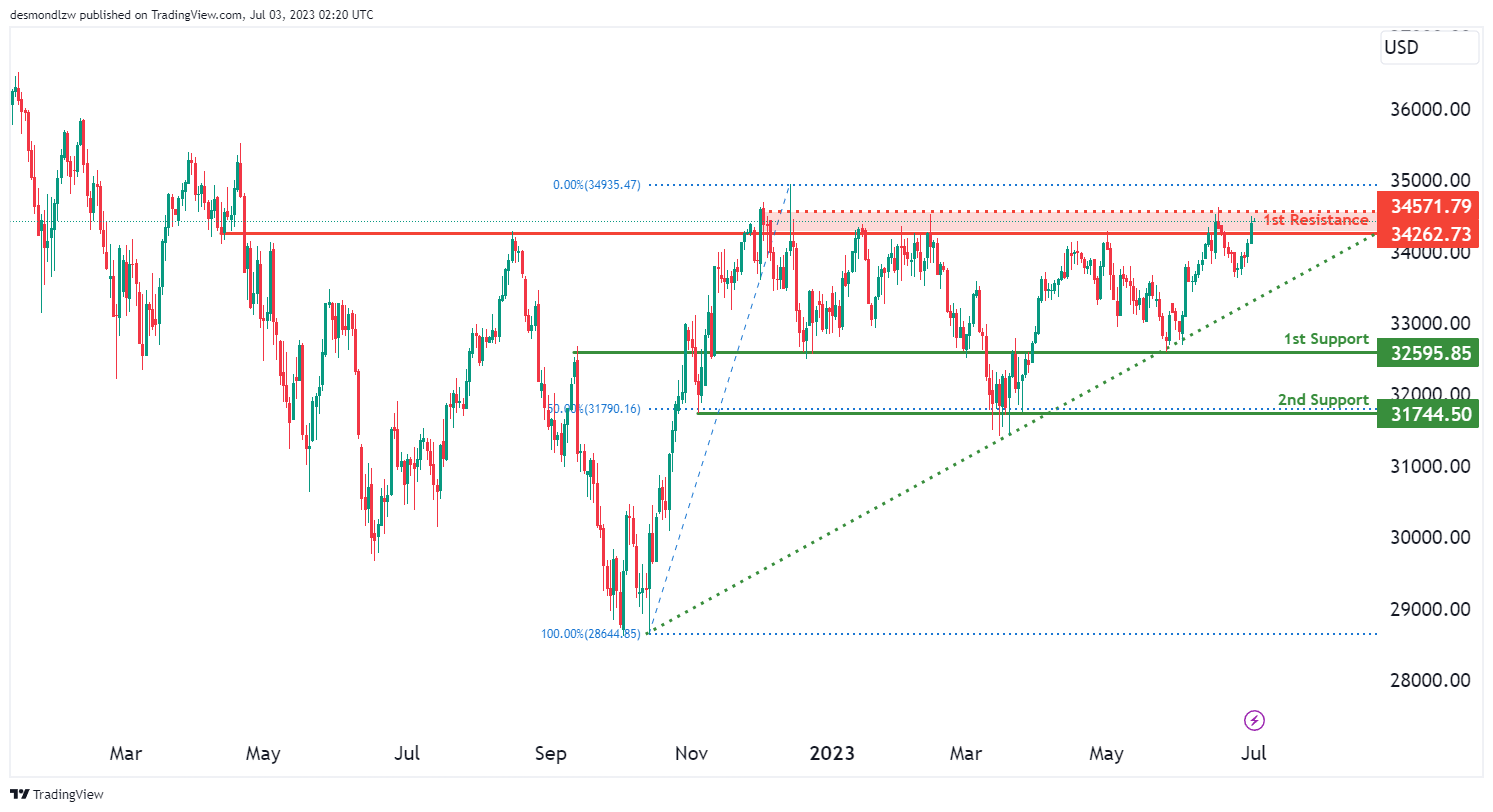
DJ30:
The DJ30 instrument is currently showcasing a bullish momentum. This uptrend is expected to continue with a potential bullish move towards the first resistance. The first support for this instrument is set at 32595.85, providing a strong base due to its overlap support. Further down, the second support at 31744.50 acts as a swing low support and represents a crucial 50% Fibonacci retracement point.
Looking upwards, the first resistance level is positioned at 34262.73, presenting an overlap resistance that could challenge the bullish continuation. Additionally, there is an intermediate resistance at 34571.79, which can serve as a significant barrier due to its multi-swing high resistance. These resistance levels may determine the extent of the bullish momentum for the DJ30 instrument.
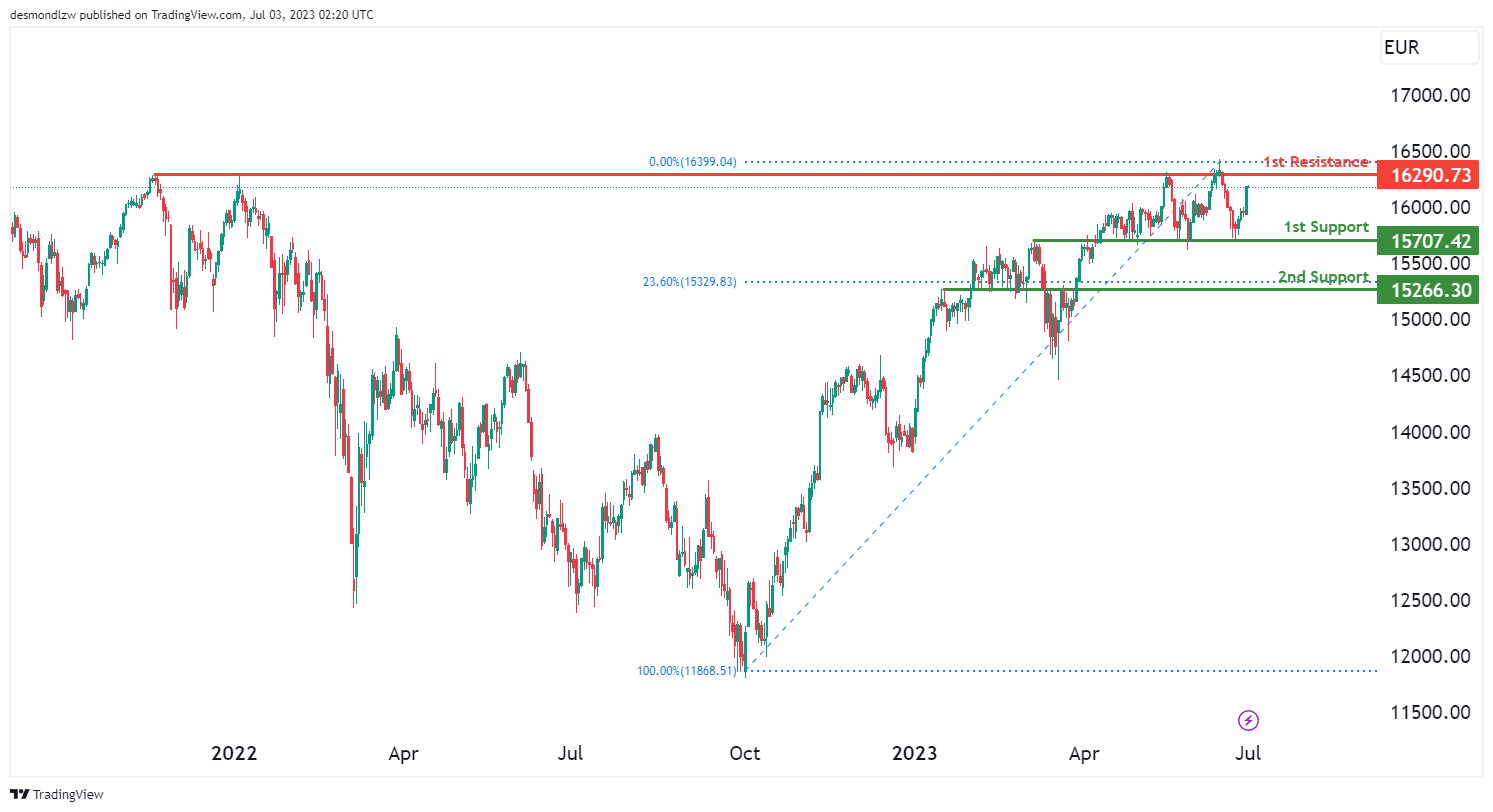
GER30:
The GER30 instrument is currently displaying a bullish momentum. This is expected to potentially lead to a bullish continuation towards the first resistance level. The first support level for this instrument is established at 15707.42, which is considered a strong base due to its nature as an overlap support. Further down, the second support level is positioned at 15266.30 and acts as another overlap support, coinciding with a significant 23.60% Fibonacci retracement level.
On the upper side, the first resistance is located at approximately 16290.73. This level presents a notable challenge to the bullish trend due to its position as a multi-swing high resistance. These levels of support and resistance will play a crucial role in determining the future trajectory of the GER30’s bullish momentum.
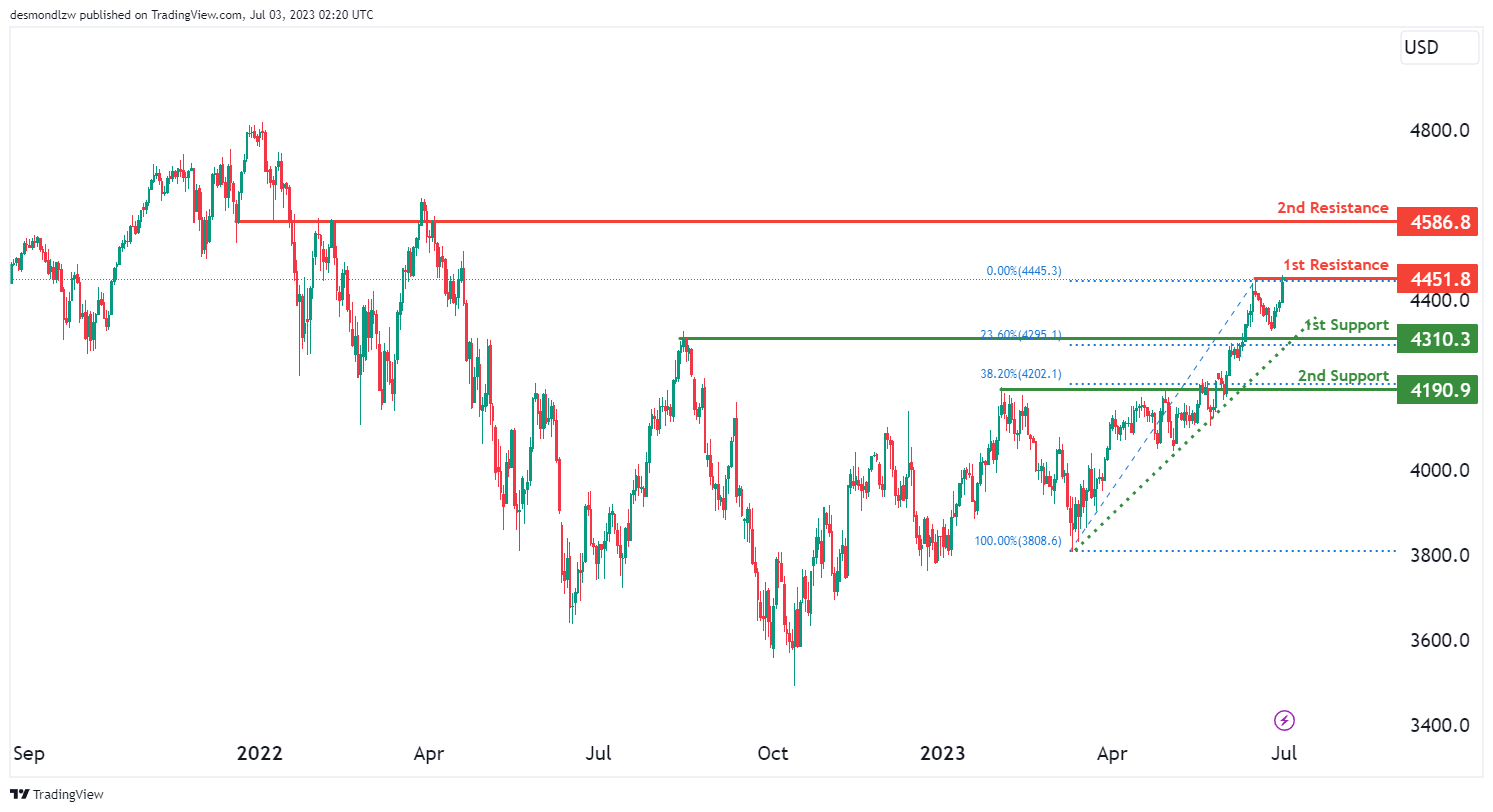
US500
The US500 instrument is currently exhibiting a weak bearish momentum with low confidence. This trend could potentially lead to a bearish reaction off the first resistance and a subsequent drop to the first support level.
The first support level is identified at 4310.3, providing a solid base due to its nature as an overlap support and its correlation with a 23.60% Fibonacci retracement level. Lower down, the second support at 4190.9 serves as another overlap support and coincides with the 38.20% Fibonacci retracement level, adding to its strength.
On the flip side, the first resistance level is found at 4451.8, acting as a swing high resistance that could potentially deflect the bearish trend. Further up, the second resistance at 4586.8 stands as an overlap resistance. These support and resistance levels could play significant roles in determining the continuation or potential reversal of the US500’s weak bearish momentum.
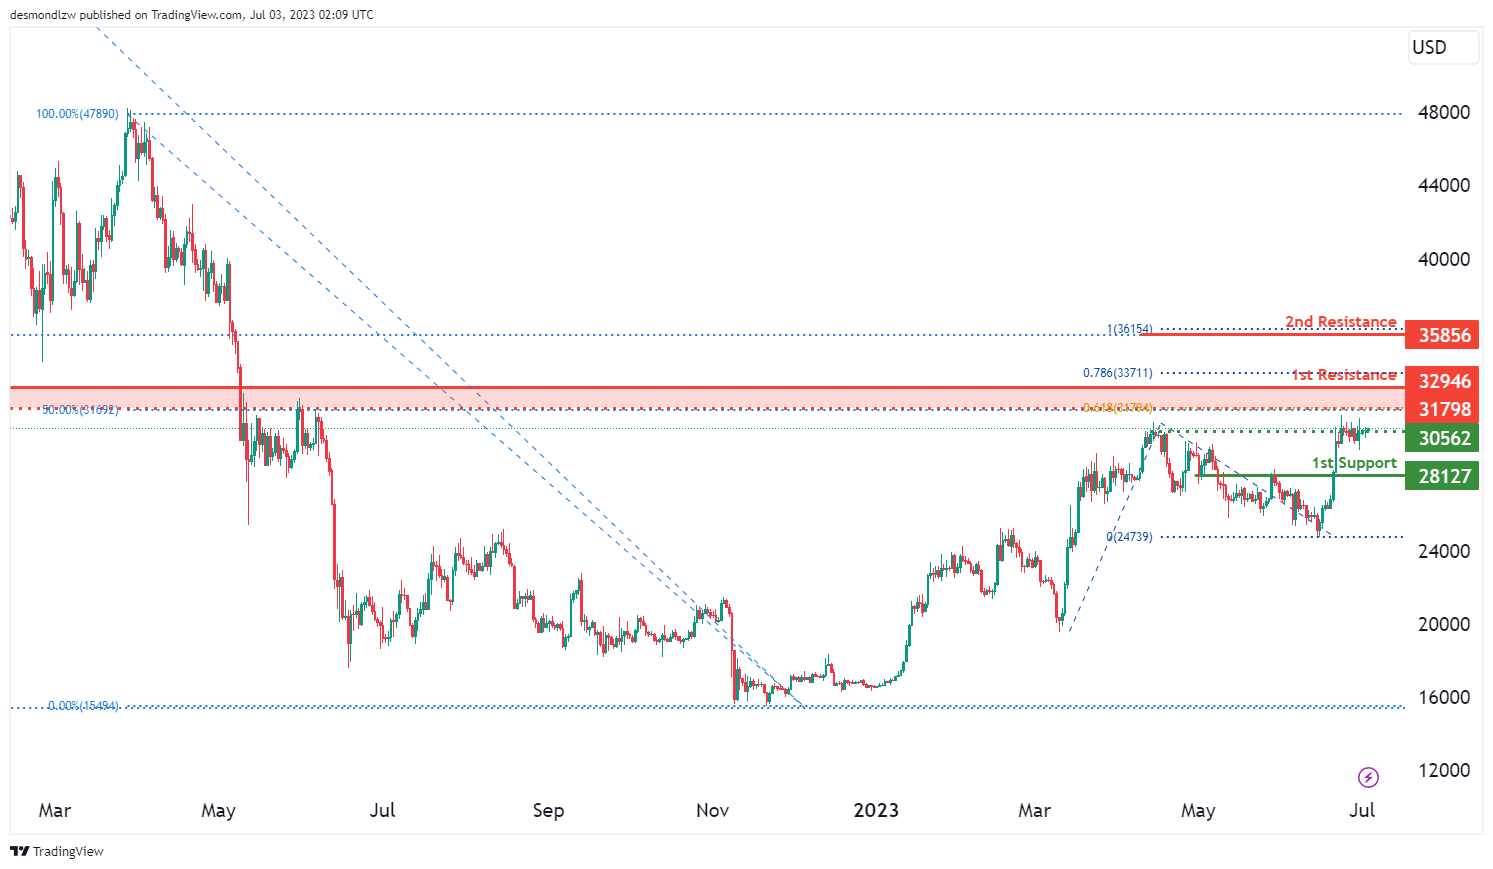
BTC/USD:
The BTC/USD instrument currently has a neutral overall momentum. This trend suggests that the price could potentially fluctuate between the first resistance and first support levels.
The first support level is found at 28127, which is considered robust due to its nature as an overlap support. On the upper side, the first resistance level is positioned at 32946 and is characterized as an overlap resistance, which may present a challenge to any bullish momentum. Beyond this, the second resistance is located at 35856, which also acts as an overlap resistance.
An intermediate resistance exists at 31798. It is notable due to its identification as an overlap resistance and its correlation with significant Fibonacci indicators. It lies at the 50% Fibonacci retracement level and the 61.80% Fibonacci projection level, indicating a Fibonacci confluence. This can serve as a crucial point in determining the future trajectory of BTC/USD’s neutral momentum.
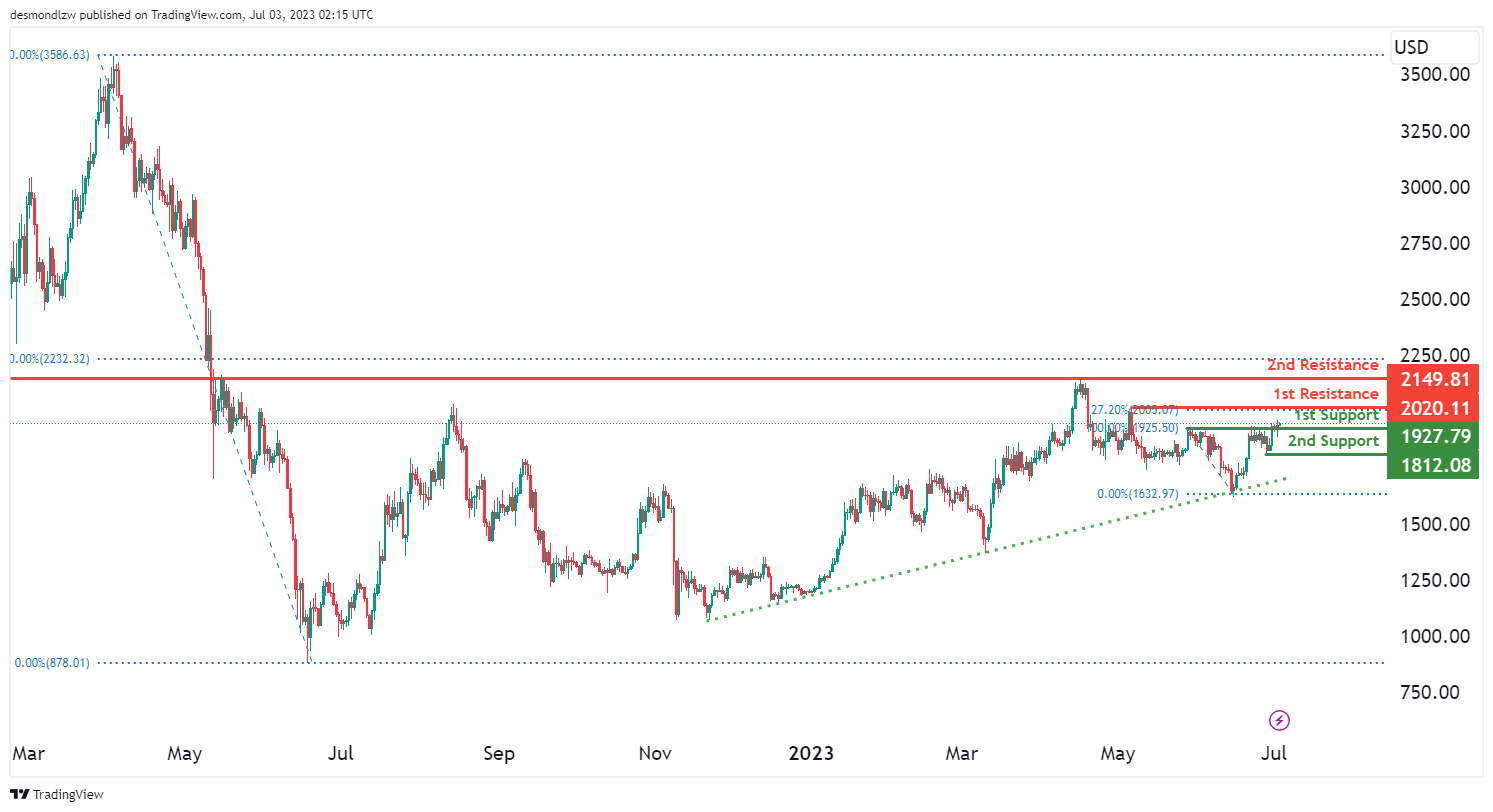
ETH/USD:
The ETH/USD instrument is currently displaying a bullish momentum. This trend suggests the possibility of a bullish continuation towards the first resistance level.
On the downside, the first support is found at 1927.79 and is considered strong due to its position as a pullback support. Further down, the second support is set at 1812.08 and offers robustness by virtue of its swing low support.
On the upside, the first resistance level is identified at 2020.11. This level presents a significant barrier due to its swing high resistance. Beyond that, the second resistance is at 2149.81, acting as an overlap resistance. These support and resistance levels will play key roles in determining the continuation or potential reversal of the bullish momentum in the ETH/USD chart.
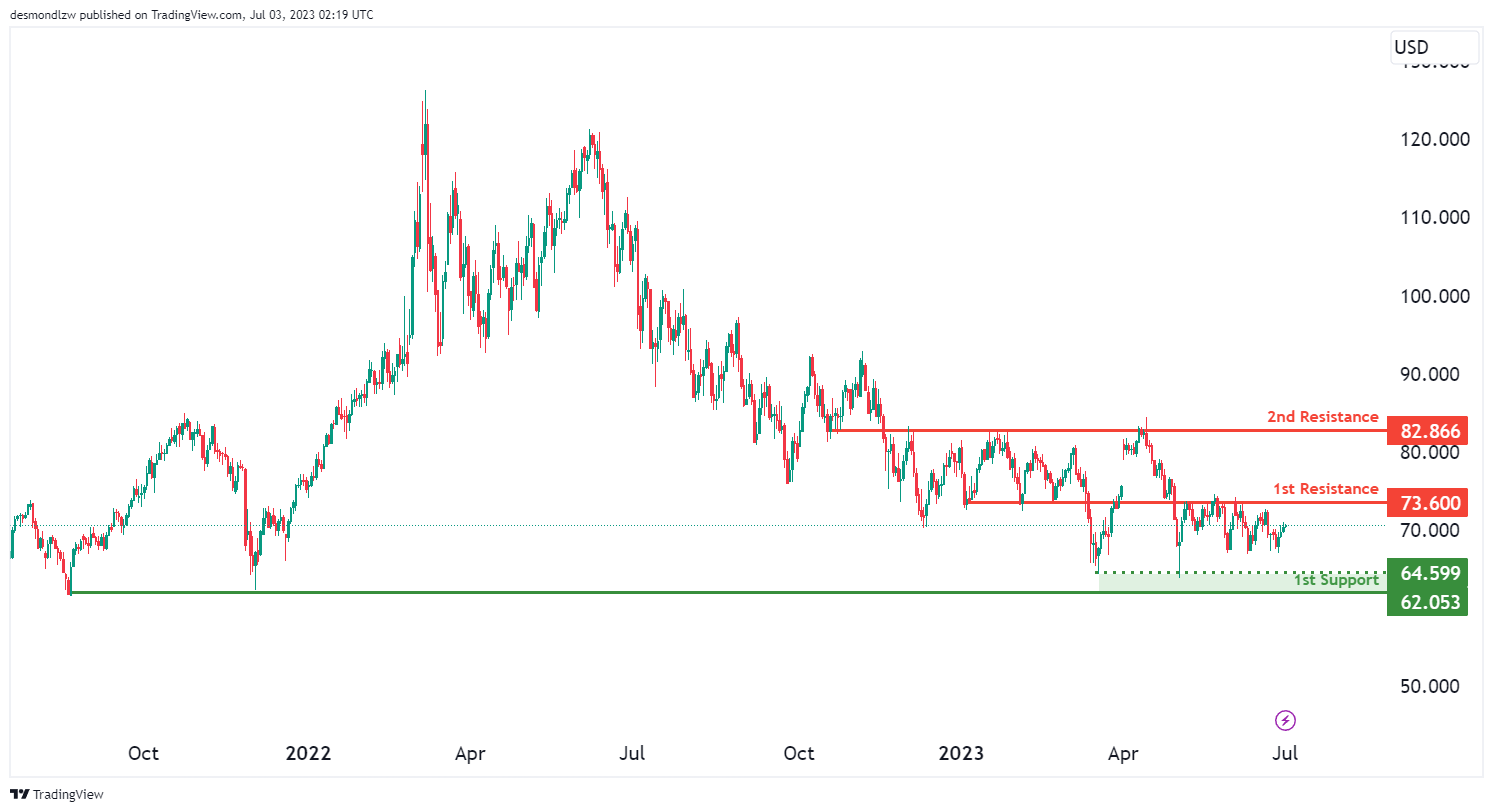
WTI/USD:
The WTI (West Texas Intermediate) instrument is currently exhibiting a bearish momentum. In the short term, the price could potentially rise towards the first resistance before reversing off it and dropping towards the first support.
The first support level for this instrument is positioned at 62.053, which is considered robust due to its role as a multi-swing low support. Meanwhile, there is an intermediate support at 64.599, also offering strength as a multi-swing low support.
On the upside, the first resistance level is identified at 73.600 and is marked as an overlap resistance. Beyond that, the second resistance level is located at 82.866, also serving as an overlap resistance. These levels of support and resistance will be key determinants in shaping the bearish momentum of the WTI instrument.
XAU/USD (GOLD):
The XAU/USD instrument is currently displaying a weak bullish momentum with low confidence. This suggests the potential for a bullish continuation towards the first resistance level.
On the downside, the first support level is found at 1906.282. This is considered robust due to its nature as an overlap support, as well as its position at the 38.20% Fibonacci retracement level and the 61.80% Fibonacci projection level, indicating a Fibonacci confluence. Further down, the second support is at 1861.599, providing a sturdy base as a pullback support and a significant 78.60% Fibonacci retracement level.
On the upside, the first resistance level is located at 1978.955, acting as an overlap resistance. Additionally, an intermediate resistance exists at 1934.373, also characterized as an overlap resistance. These support and resistance levels could play key roles in determining the future trajectory of XAU/USD’s weak bullish momentum.
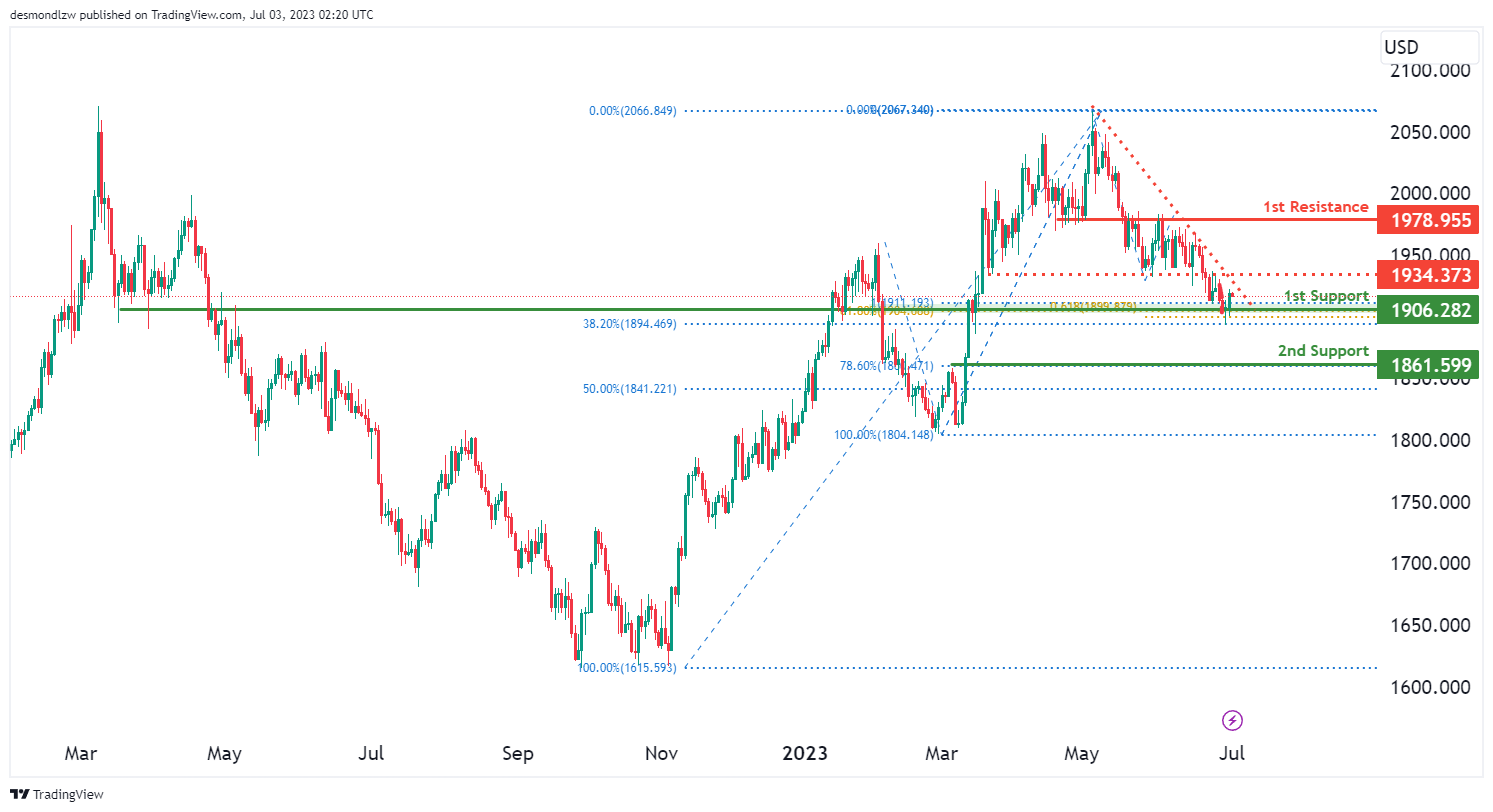


 chart exhibits a bearish momentum, indicated by the price being below a major descending trend line, suggesting the potential for further downward movement. The price is currently testing this descending trend line, which acts as a resistance.)