
DXY:
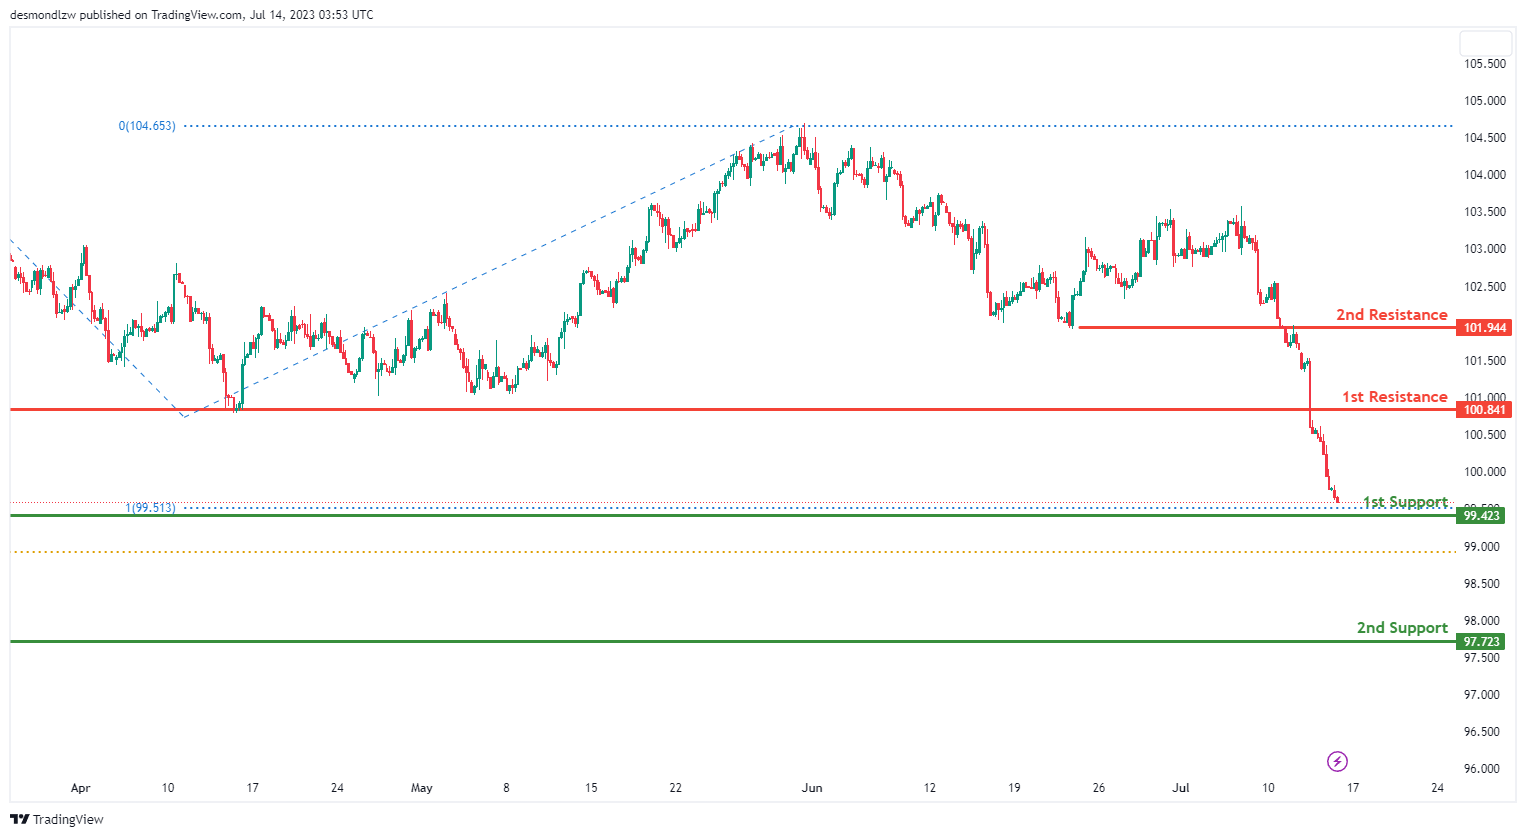
The DXY (US Dollar Index) chart is currently showing a bearish momentum. However, the market could potentially make a bullish bounce off the 1st support and move towards the 1st resistance.
The 1st support level is at 99.42. This is an overlap support and also a 100% Fibonacci Projection level. This suggests that the market has found buying interest at this price in the past, which could potentially cause a bounce upwards.
The 2nd support level is at 97.72. This is another overlap support, indicating a price level where historically buying interest has been strong. If the price drops further, this could be an area where buyers step in.
The 1st resistance level is at 100.84. This is known as a pullback resistance, meaning the price could face selling pressure and potentially reverse its direction when it reaches this level.
The 2nd resistance level is at 101.94. This is an overlap resistance level, signaling a price point where the market has previously encountered significant selling pressure. If the price rises to this level, it could attract sellers who may push prices down.
EUR/USD:
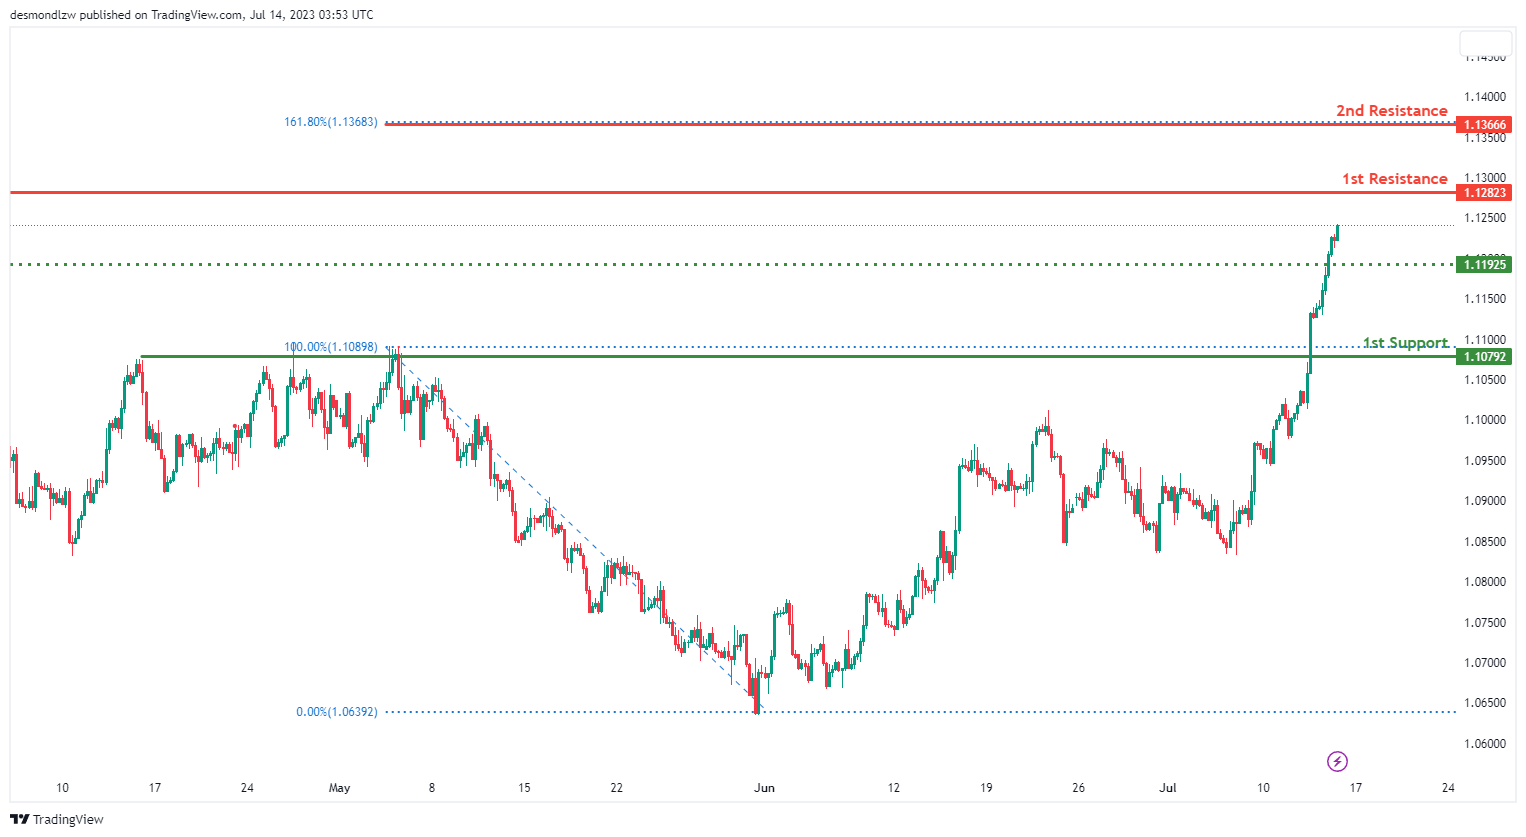
The EURUSD financial instrument currently presents a bullish overall trend on the chart, indicating the potential for a bullish continuation towards the primary resistance level. The 1st support level, positioned at 1.1079, represents a compelling pullback support, solidifying the lower bounds of the price. An intermediate support level is established at 1.1192, characterized by its role as an overlap support, further reinforcing the price floor. Regarding resistance, the 1st resistance level is set at 1.1367, defined by a 161.80% Fibonacci retracement, providing a significant upper boundary. Concurrently, the 2nd resistance level, at 1.1366, embodies a swing high resistance, underscoring its reliability as an upper limit.
EUR/JPY:
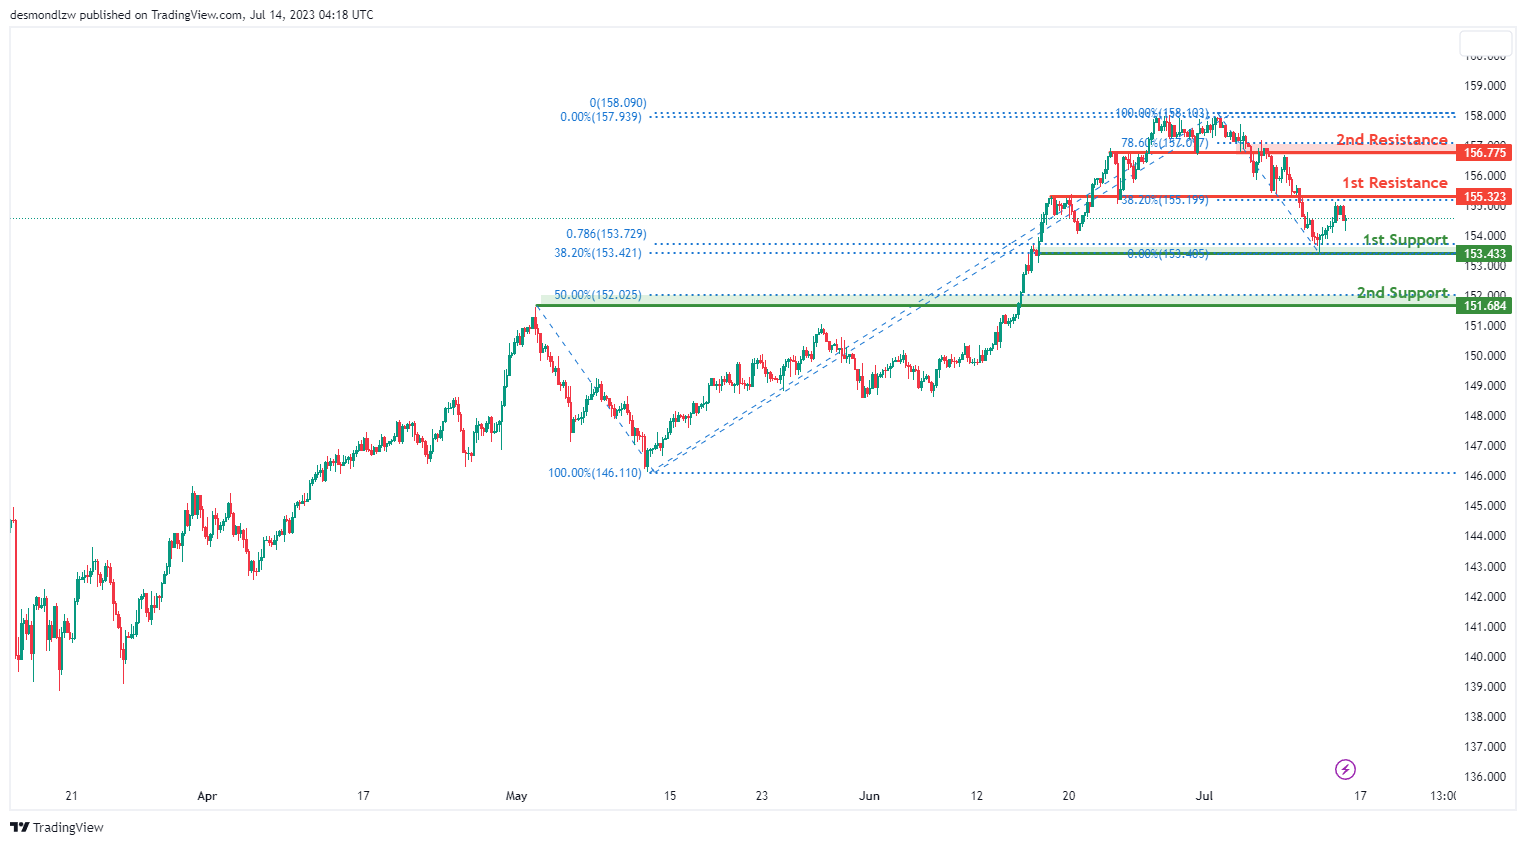
The EUR/JPY instrument is currently showing a bearish overall momentum. There is a possibility of a bearish continuation, indicating that the price could potentially move further downwards towards the first support level.
The 1st support level is located at 153.43 and is considered good due to its characteristics as a multi-swing low support. Additionally, it aligns with the 38.20% Fibonacci retracement and 78.60% Fibonacci projection, indicating Fibonacci confluence.
The 2nd support level is positioned at 151.68 and is recognized as an overlap support, further strengthening its significance. It corresponds to the 50% Fibonacci retracement level.
Moving on to the resistance levels, the 1st resistance is found at 155.32 and is considered good as it represents an overlap resistance. It also aligns with the 38.20% Fibonacci retracement level. The 2nd resistance level is located at 156.77 and is recognized as an overlap resistance. It corresponds to the 78.60% Fibonacci retracement level.
EUR/GBP:
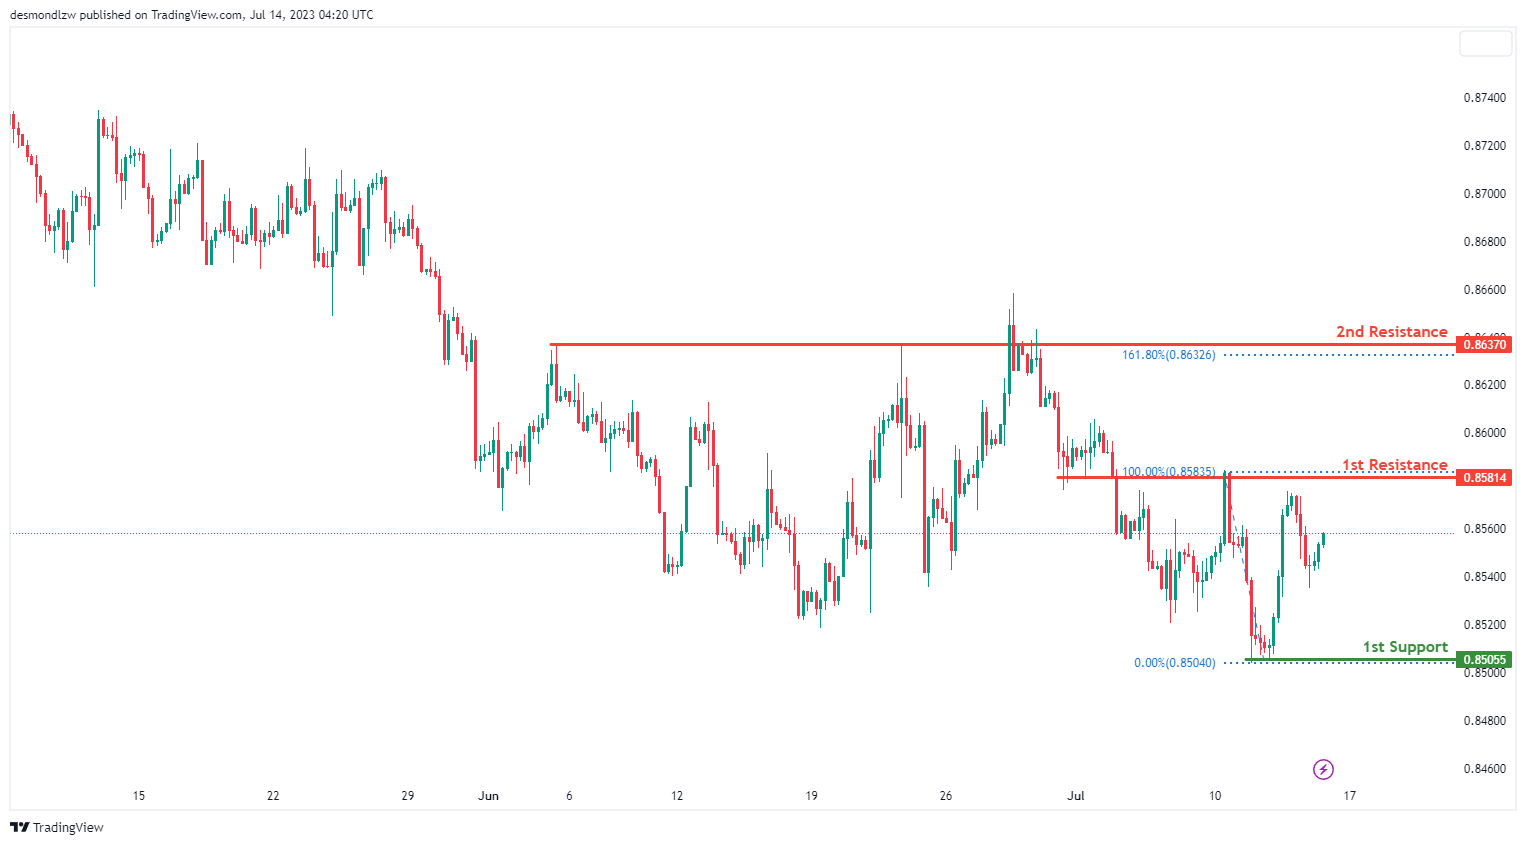
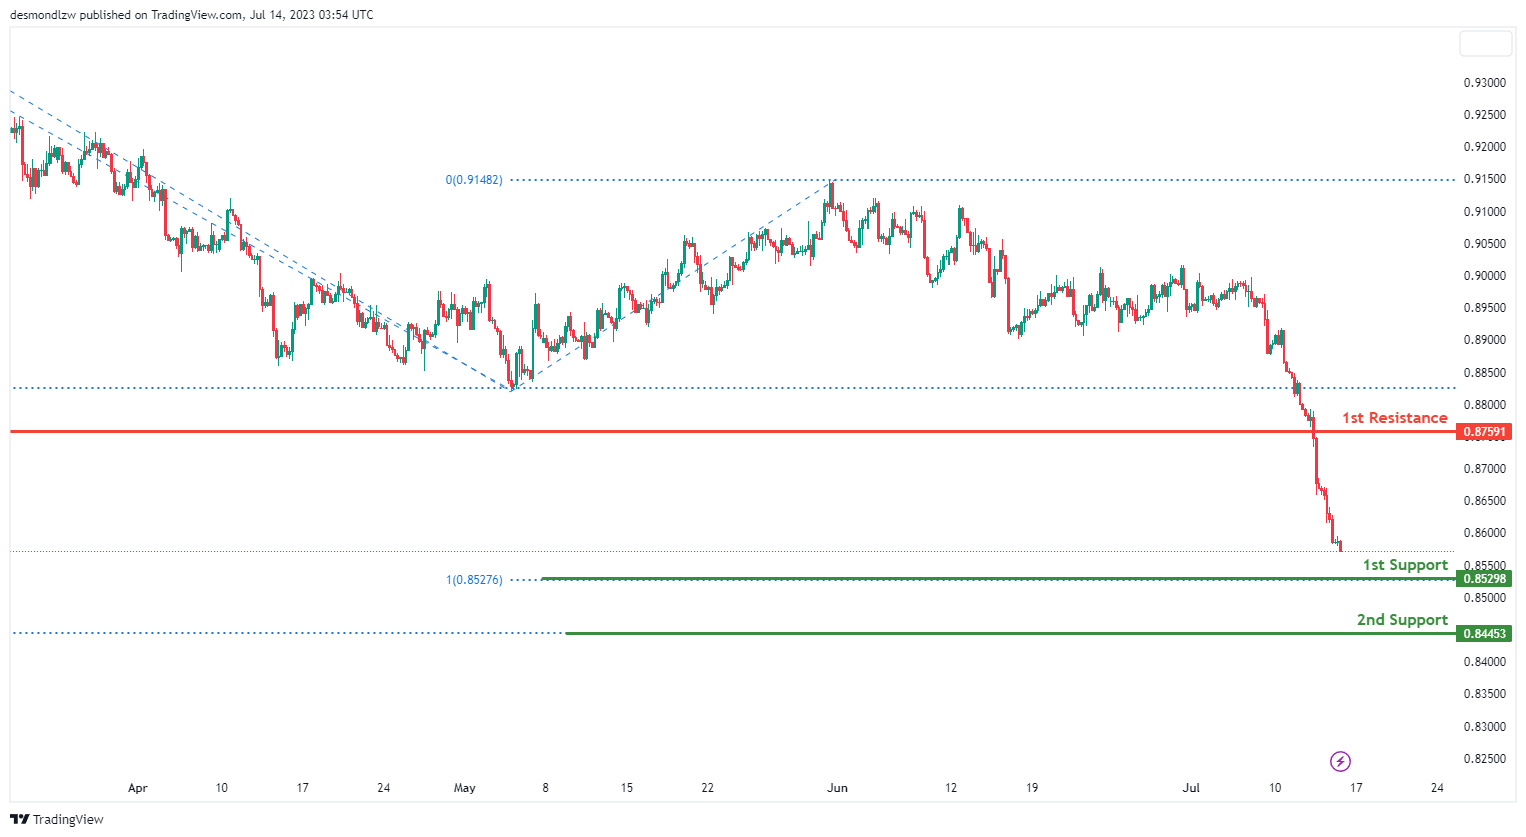
The EUR/GBP instrument is currently demonstrating a bearish momentum. There is a potential for a bearish reaction off the 1st resistance level, leading to a drop towards the 1st support level.
The 1st support level is situated at 0.8505 and is considered good as it represents a swing low support. This level has historically acted as a support area in the price movement.
On the other hand, the 1st resistance level is located at 0.8581 and is recognized as an overlap resistance. It indicates a significant price level where selling pressure may increase.
Additionally, there is a 2nd resistance level at 0.8637, which is also an overlap resistance. This level is further strengthened by the presence of the 161.80% Fibonacci extension.
GBP/USD:
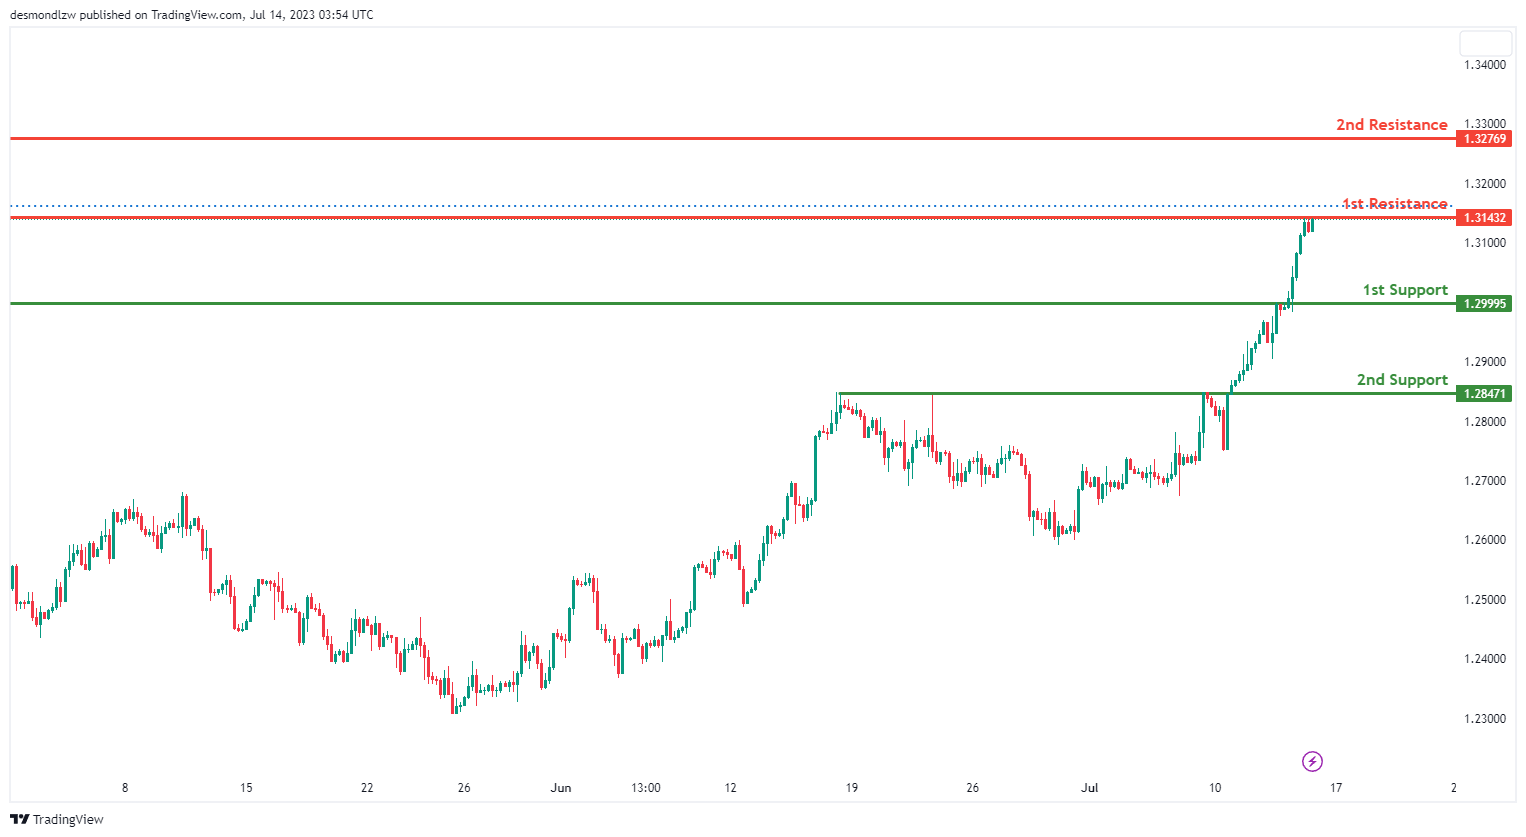
The GBP/USD chart is currently showing a bullish momentum. However, the price could potentially react off the 1st resistance and drop towards the 1st support level.
The 1st support level is at 1.2999. This level could be significant as it acts as a pullback support, suggesting that the price could find buying interest here, potentially bouncing upwards.
The 2nd support level is at 1.2847. This level could also act as a pullback support, suggesting another possible level where the market could find buyers and bounce.
The 1st resistance level is at 1.3143. This is a multi-swing high resistance level, suggesting that the price could face selling pressure at this point, potentially reversing its direction.
The 2nd resistance level is at 1.3276. This is an overlap resistance level, suggesting that this could be another point of potential price reversal due to selling pressure.
GBP/JPY:
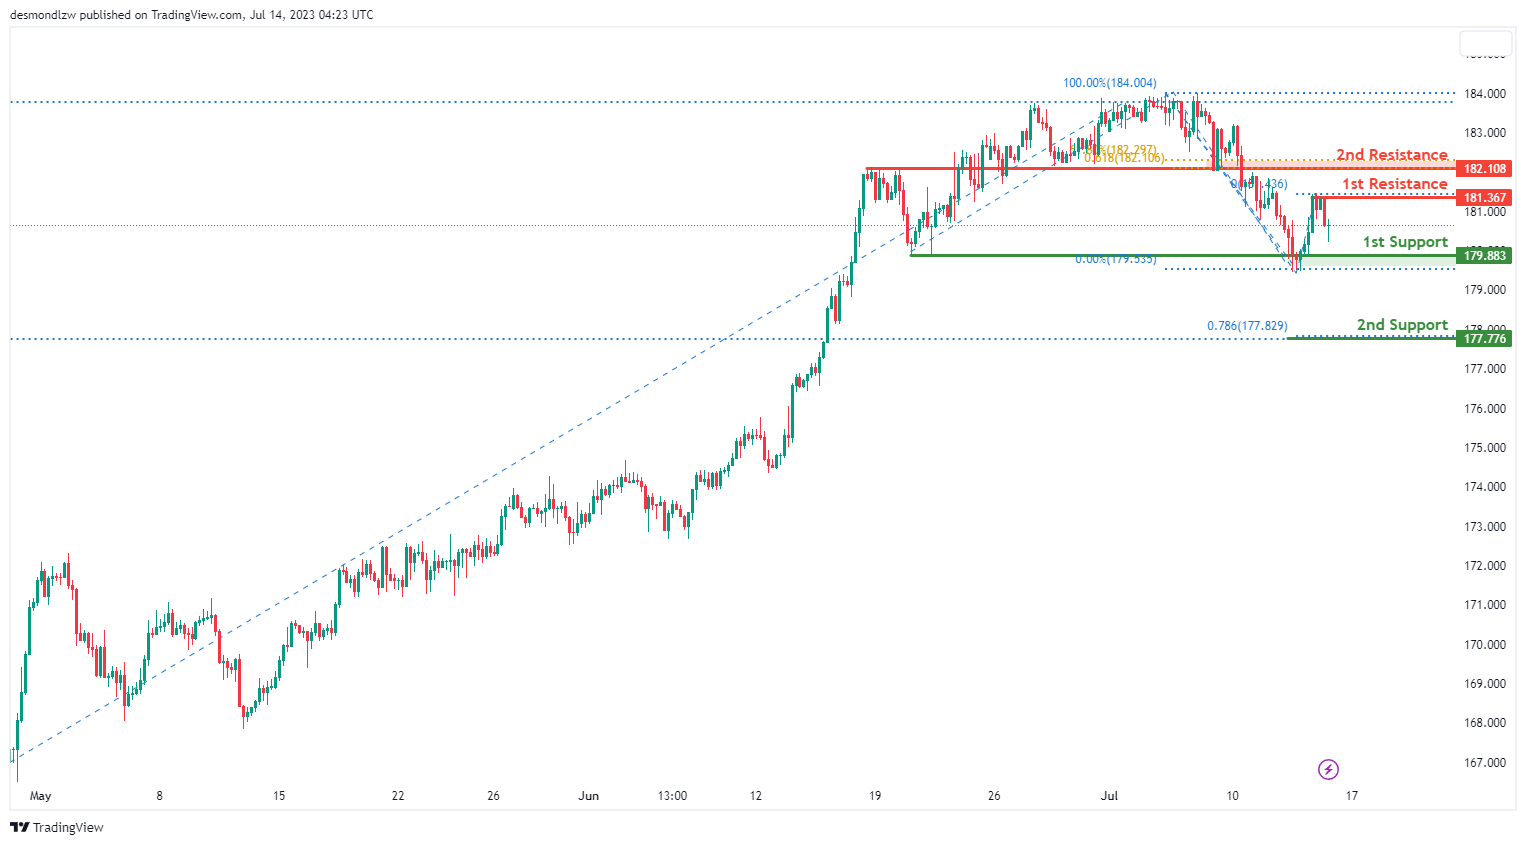
The GBP/JPY instrument is currently demonstrating a bearish momentum. There is a potential for a bearish reaction off the 1st resistance level, leading to a drop towards the 1st support level.
The 1st support level is located at 179.88 and is considered good as it represents a multi-swing low support. This level has historically acted as a support area in the price movement.
Furthermore, there is a 2nd support level at 177.77. This level is strengthened by the presence of both the 78.60% Fibonacci projection and the 23.60% Fibonacci retracement, indicating a potential Fibonacci confluence.
On the upside, the 1st resistance level is situated at 181.36 and is recognized as a swing high resistance. It represents a significant price level where selling pressure may increase.
Additionally, there is a 2nd resistance level at 182.10, which is an overlap resistance. This level is further supported by the presence of both the 61.80% Fibonacci retracement and the 61.80% Fibonacci projection, indicating a potential Fibonacci confluence.
USD/CHF:
The USD/CHF chart is currently showing a bearish momentum. The market could potentially make a bearish continuation towards the 1st support level.
The 1st support level is at 0.8529. This level is significant as it aligns with a 100% Fibonacci projection, suggesting a price point where the market could find buying interest and potentially bounce upwards.
The 2nd support level is at 0.8445. This level is also significant as it aligns with a -61.8% Fibonacci expansion, another potential level where buyers could enter the market, providing further support.
The 1st resistance level is at 0.8759, which is considered a pullback resistance. This means the price could face selling pressure and potentially reverse its direction when it reaches this level.
Given the bearish momentum, the market may continue its descent towards the 1st support. However, if the price manages to bounce off the support and break past the resistance, we might see a shift in market sentiment.
USD/JPY:
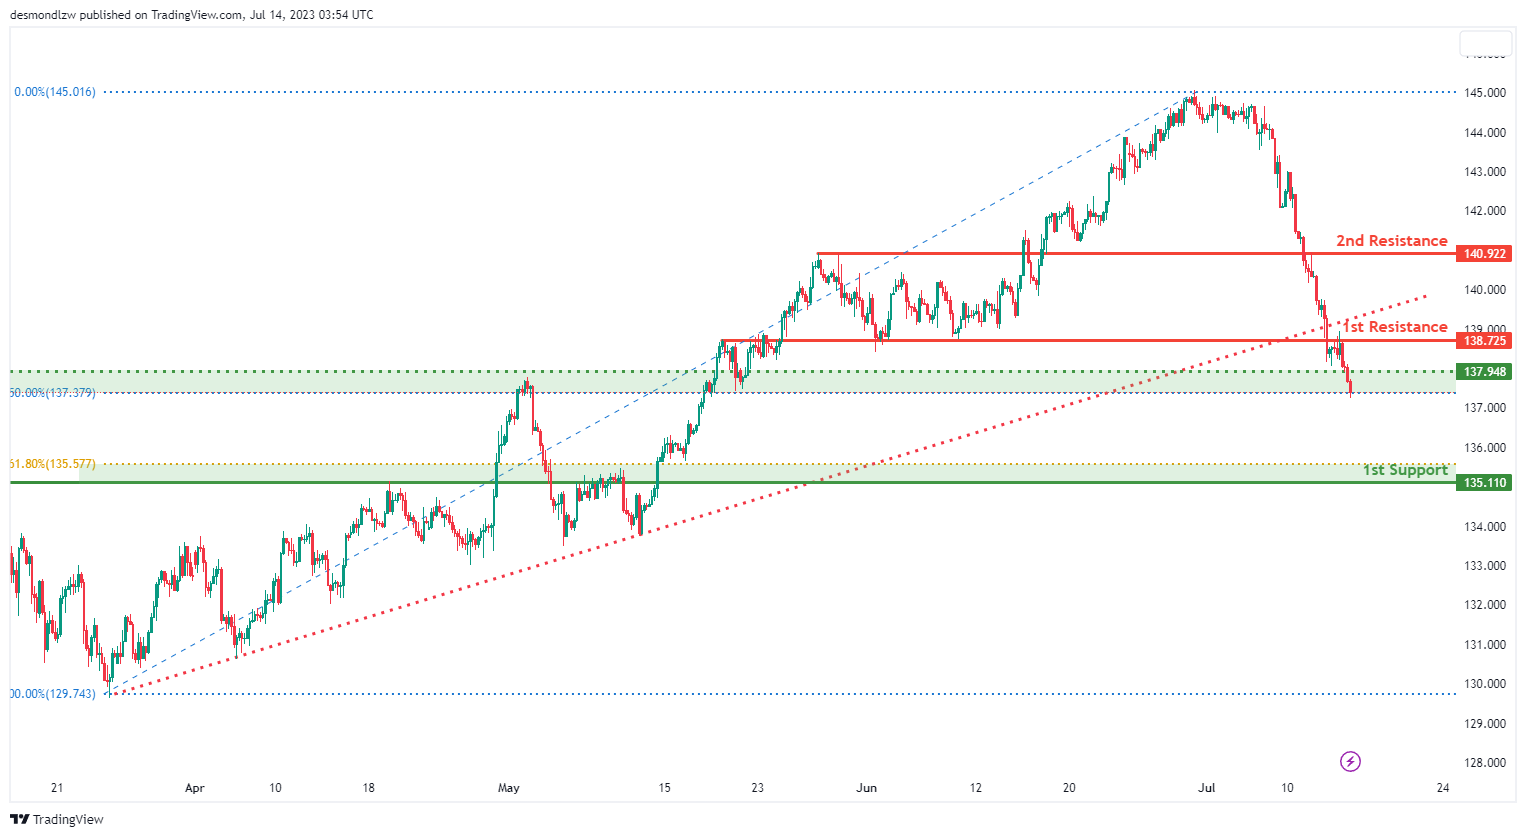
The USD/JPY chart is currently showing a bearish momentum, primarily due to the price breaking below an ascending support line. This break might trigger a potential bearish move. However, the market could potentially make a bullish bounce off the 1st support and head towards the 1st resistance level
The 1st support level is at 0.8529. This level is significant as it aligns with an overlap support and the 50% Fibonacci retracement level. It suggests a price point where the market could find buying interest and potentially bounce upwards.
An intermediate support level is at 0.8445. This level is also significant as it aligns with an overlap support and the 61.80% Fibonacci retracement level. This is another potential level where buyers could enter the market, providing further support.
The 1st resistance level is at 138.7200, which is considered an overlap resistance. This means the price could face selling pressure and potentially reverse its direction when it reaches this level.
The 2nd resistance level is at 140.9200, which is also an overlap resistance.
USD/CAD:
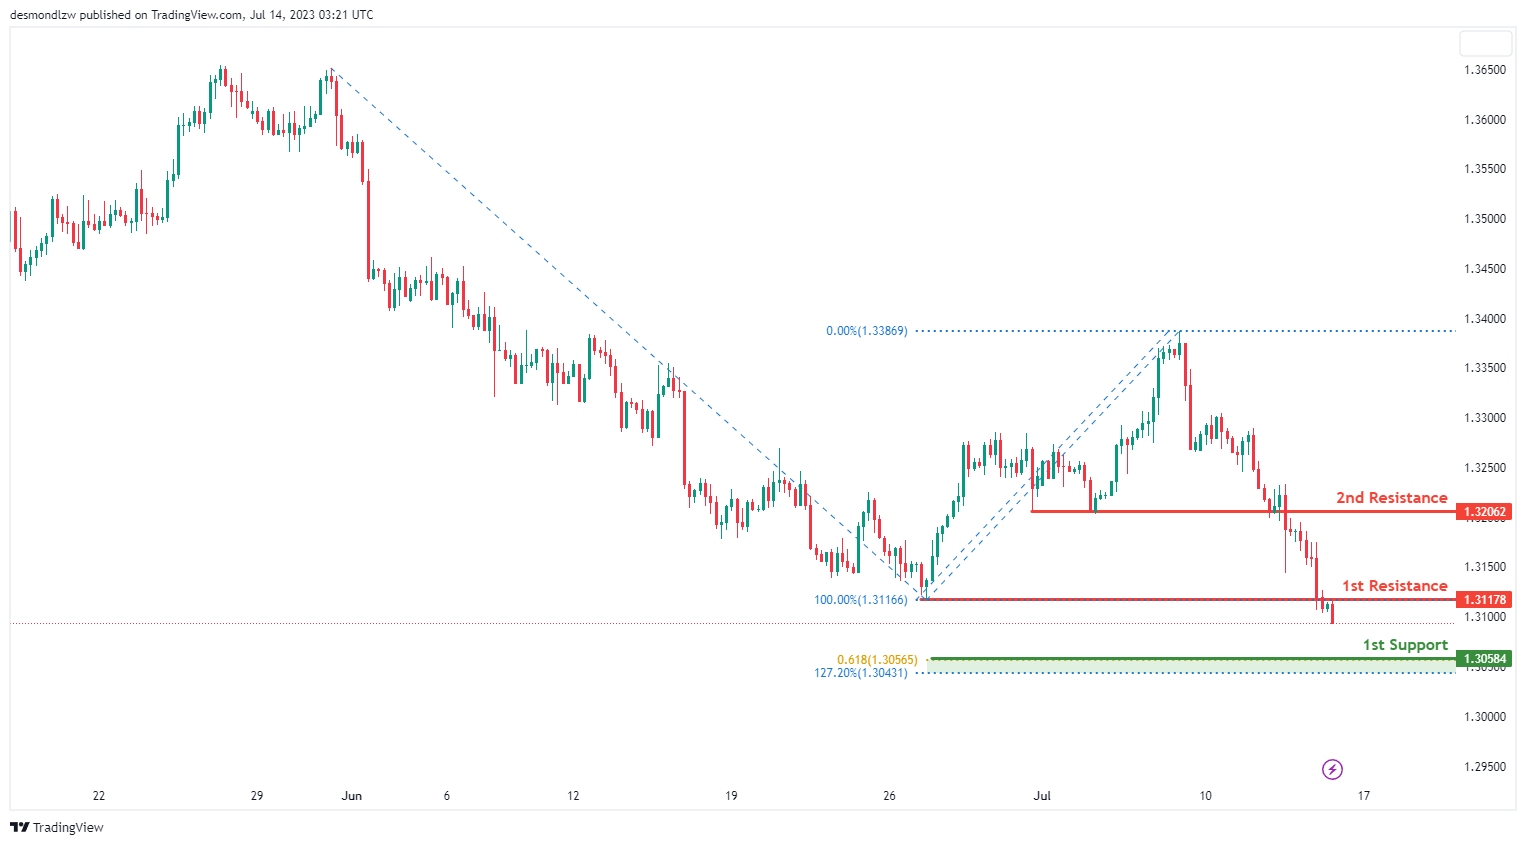
The USD/CAD pair currently exhibits a bearish trend, indicating a potential continuation of this bearish momentum towards the 1st support level.
The 1st support level is located at 1.3058 and serves as an overlap support. Moreover, it aligns with the 61.80% Fibonacci projection and 127.20% Fibonacci extension levels, bolstering its significance backed by a confluence of Fibonacci levels.
On the other hand, if the price reverses and ascends, it could encounter the 1st resistance level at 1.3118. This level, recognized as an overlap resistance, could pose a significant barrier to upward price movements. Further upward, the 2nd resistance level is found at 1.3206, another overlap resistance, which could serve as an additional hurdle for further price ascents.
AUD/USD:
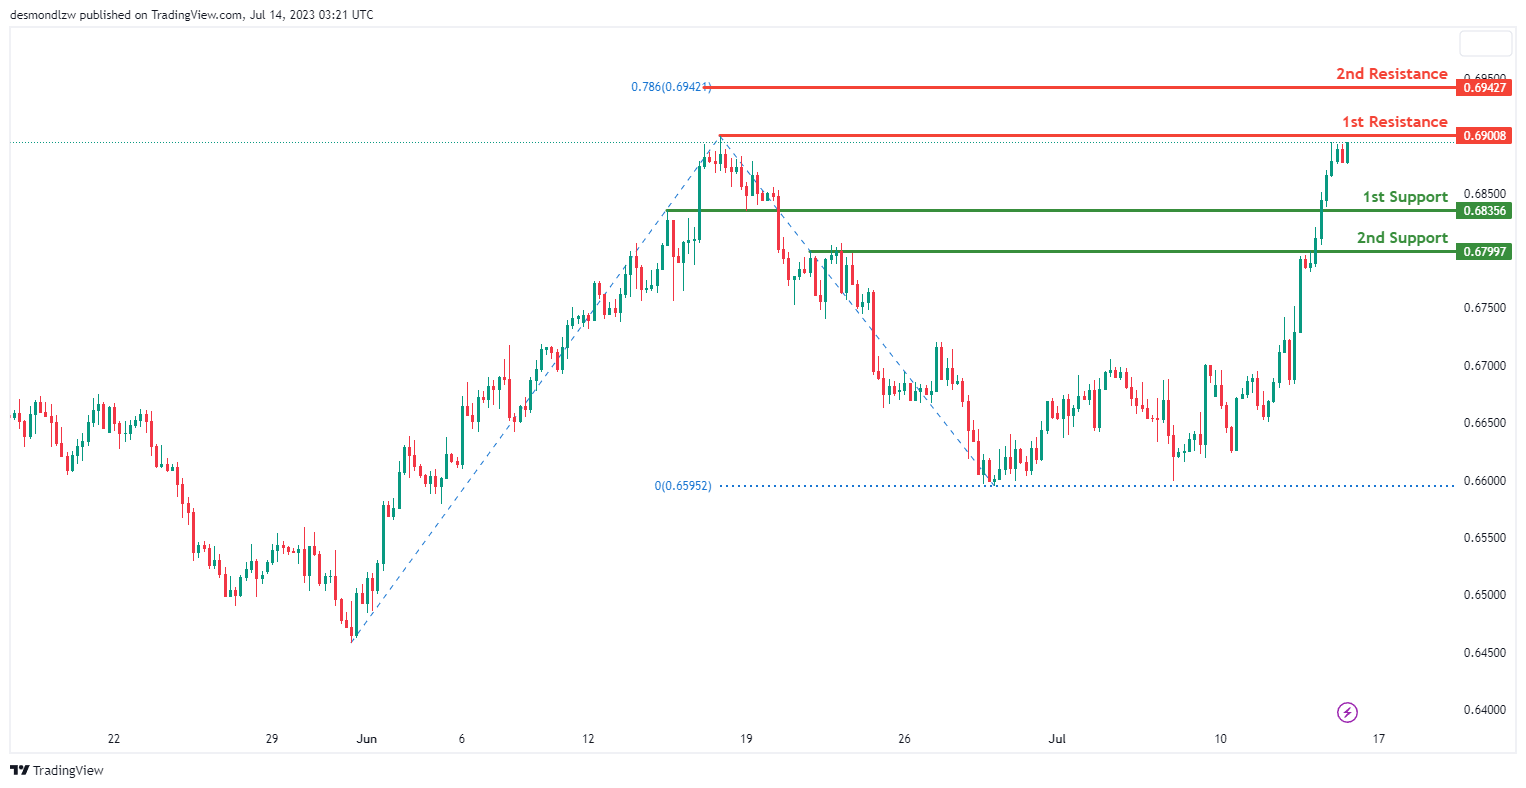
The AUD/USD pair is presently showing a bullish trend, implying a potential continuation of this momentum towards the 1st resistance level.
On the downside, the 1st support level is identified at 0.6836, acting as an overlap support and offering a significant degree of price stability. Further protection against a possible price decline is offered by the 2nd support level, located at 0.6799, also classified as an overlap support.
On the bullish side, the price may continue its upward trajectory towards the 1st resistance level set at 0.6901. This overlap resistance could serve as a significant barrier to upward price movements. If the price manages to breach this level, it could aim for the 2nd resistance level at 0.6943. This overlap resistance coincides with a 78.60% Fibonacci projection level, enhancing its potential to resist further price ascents.
NZD/USD
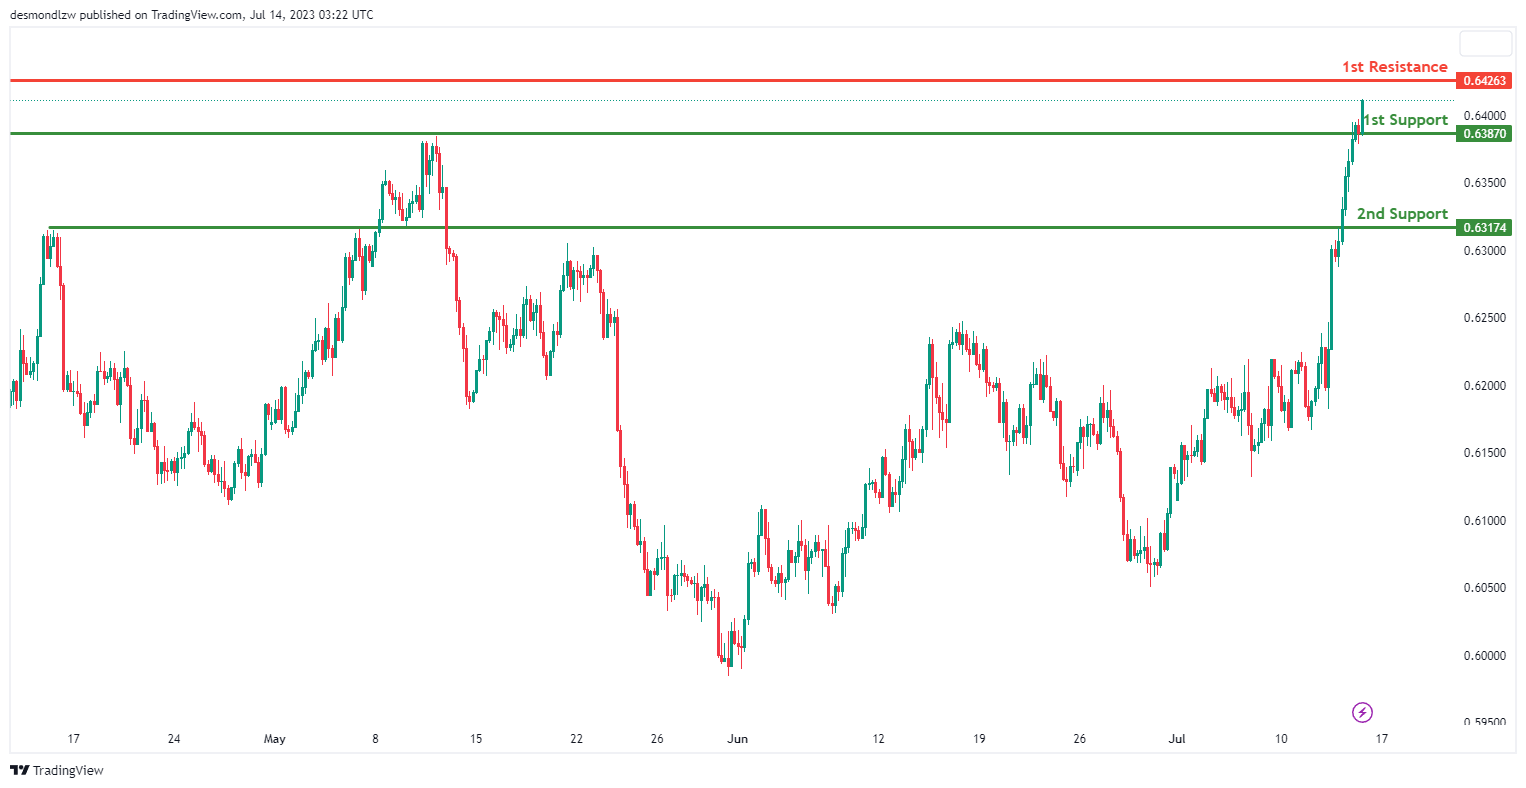
The NZD/USD pair is currently demonstrating a bullish momentum, suggesting a potential bullish continuation towards the 1st resistance level.
On the downside, the 1st support level is identified at 0.6387, acting as an overlap support, providing considerable price stability. Furthermore, a 2nd support level is found at 0.6317, which also functions as an overlap support, offering additional protection for potential downward price movements.
On the upside, the price could potentially continue its bullish trend towards the 1st resistance level situated at 0.6426. This level, characterized as an overlap resistance, could pose a significant hurdle for further price ascension.
DJ30:
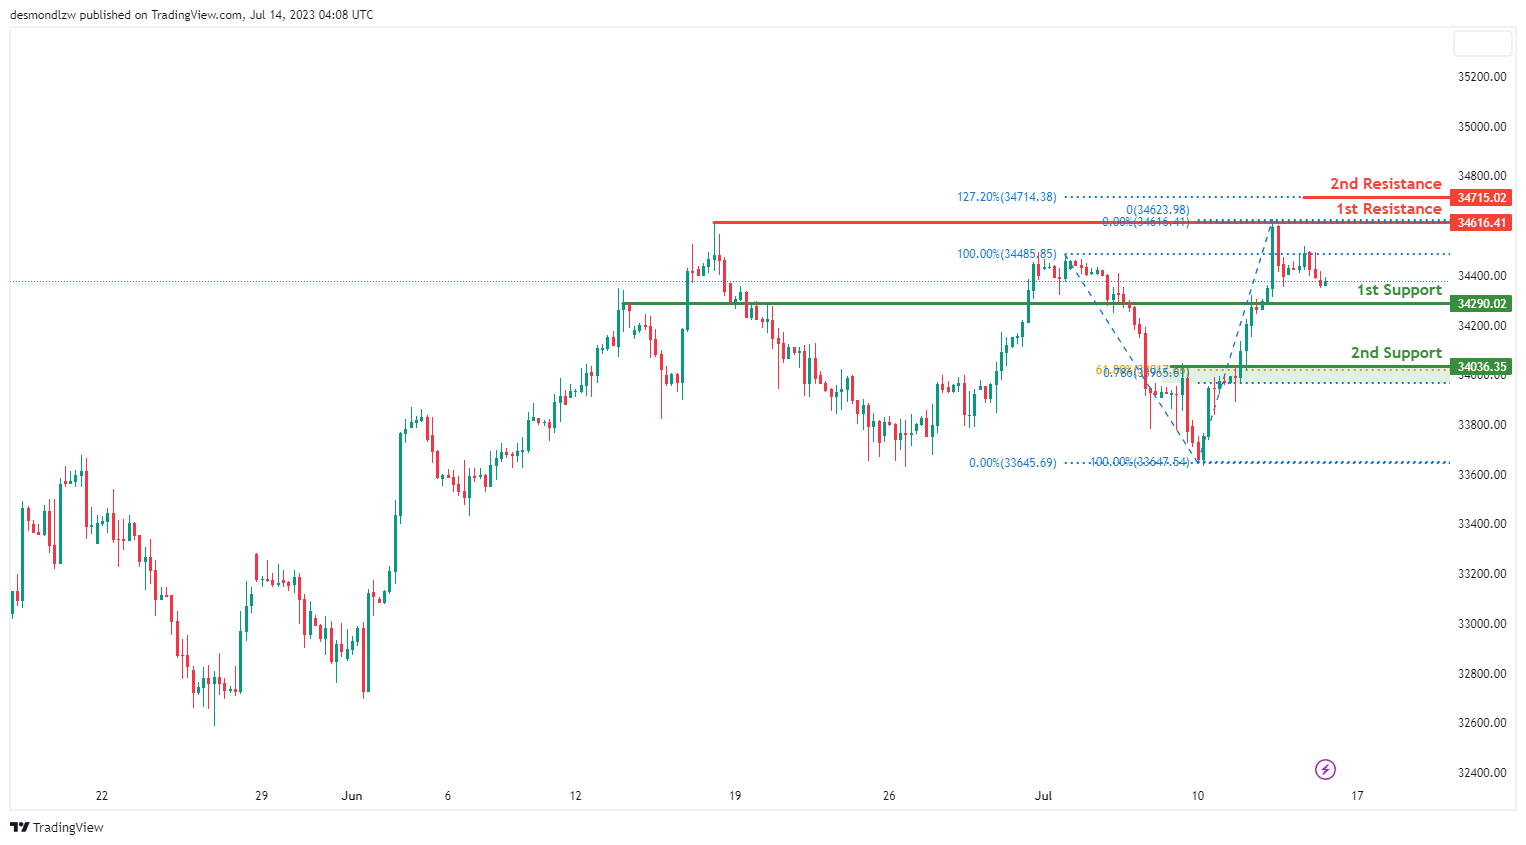
The DJ30 (Dow Jones Industrial Average) chart currently exhibits a bullish momentum. There is potential for the price to make a bullish bounce off the 1st support and head towards the 1st resistance.
The 1st support level is located at 34290.02 and is considered good as it represents a pullback support. The 2nd support level is positioned at 34036.35 and is recognized as an overlap support, along with the presence of a 61.80% Fibonacci retracement and 78.60% Fibonacci projection, indicating Fibonacci confluence.
Moving on to the resistance levels, the 1st resistance is found at 34616.41 and is deemed significant as it represents a multi-swing high resistance. The 2nd resistance level is situated at 34715.02 and is considered noteworthy due to the presence of a 127.20% Fibonacci extension.
GER30:
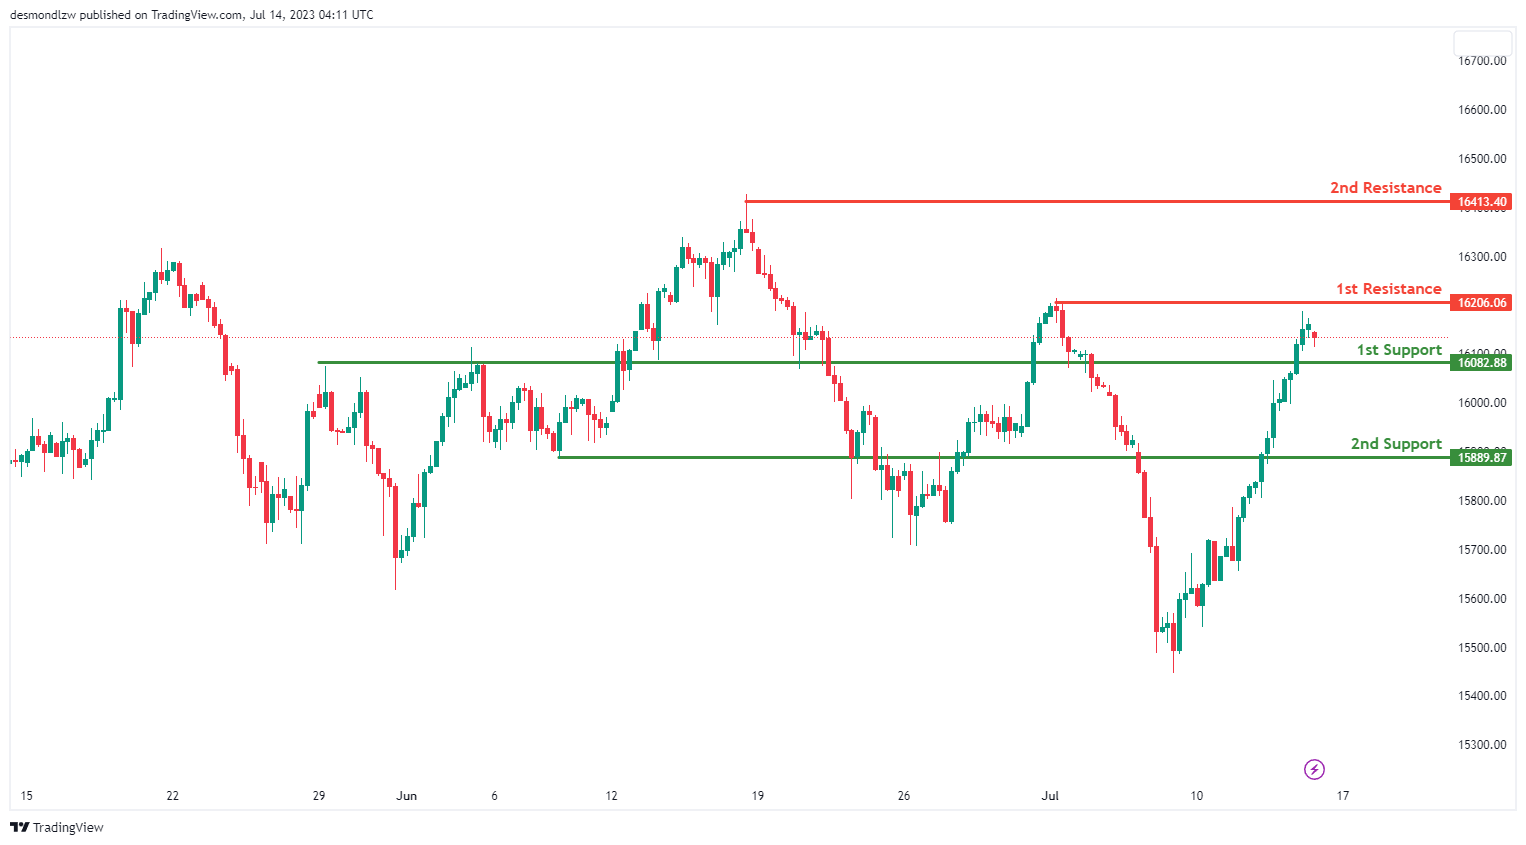
The GER30 (DAX) chart currently exhibits a bullish momentum. There is potential for the price to drop further to the 1st support in the short term before bouncing from there and rising towards the 1st resistance.
The 1st support level is located at 16082.88 and is considered good as it represents a pullback support. The 2nd support level is positioned at 15889.87 and is recognized as an overlap support.
Moving on to the resistance levels, the 1st resistance is found at 16206.06 and is deemed significant as it represents a swing high resistance. The 2nd resistance level is situated at 16413.40 and is also recognized as a swing high resistance.
US500
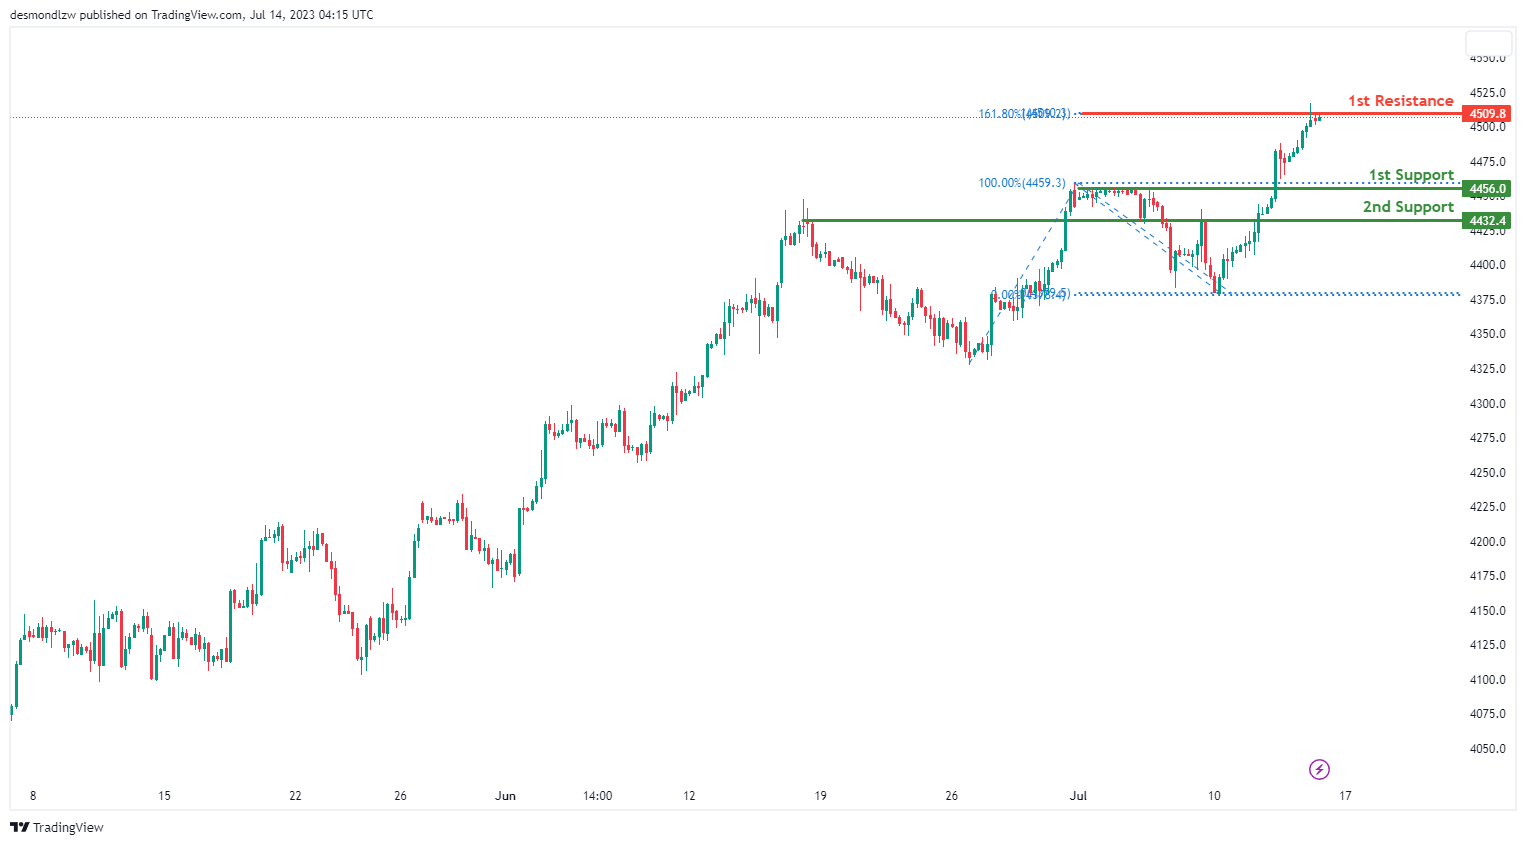
The US500 (S&P 500) chart currently exhibits a bearish momentum. There is potential for the price to experience a bearish reaction off the 1st resistance and drop to the 1st support.
The 1st support level is located at 4456.0 and is considered good as it represents a pullback support. The 2nd support level is positioned at 4432.4 and is recognized as an overlap support.
Moving on to the resistance level, the 1st resistance is found at 4509.8 and is deemed significant due to the presence of a 161.80% Fibonacci extension and 100% Fibonacci expansion, indicating Fibonacci confluence.
BTC/USD:
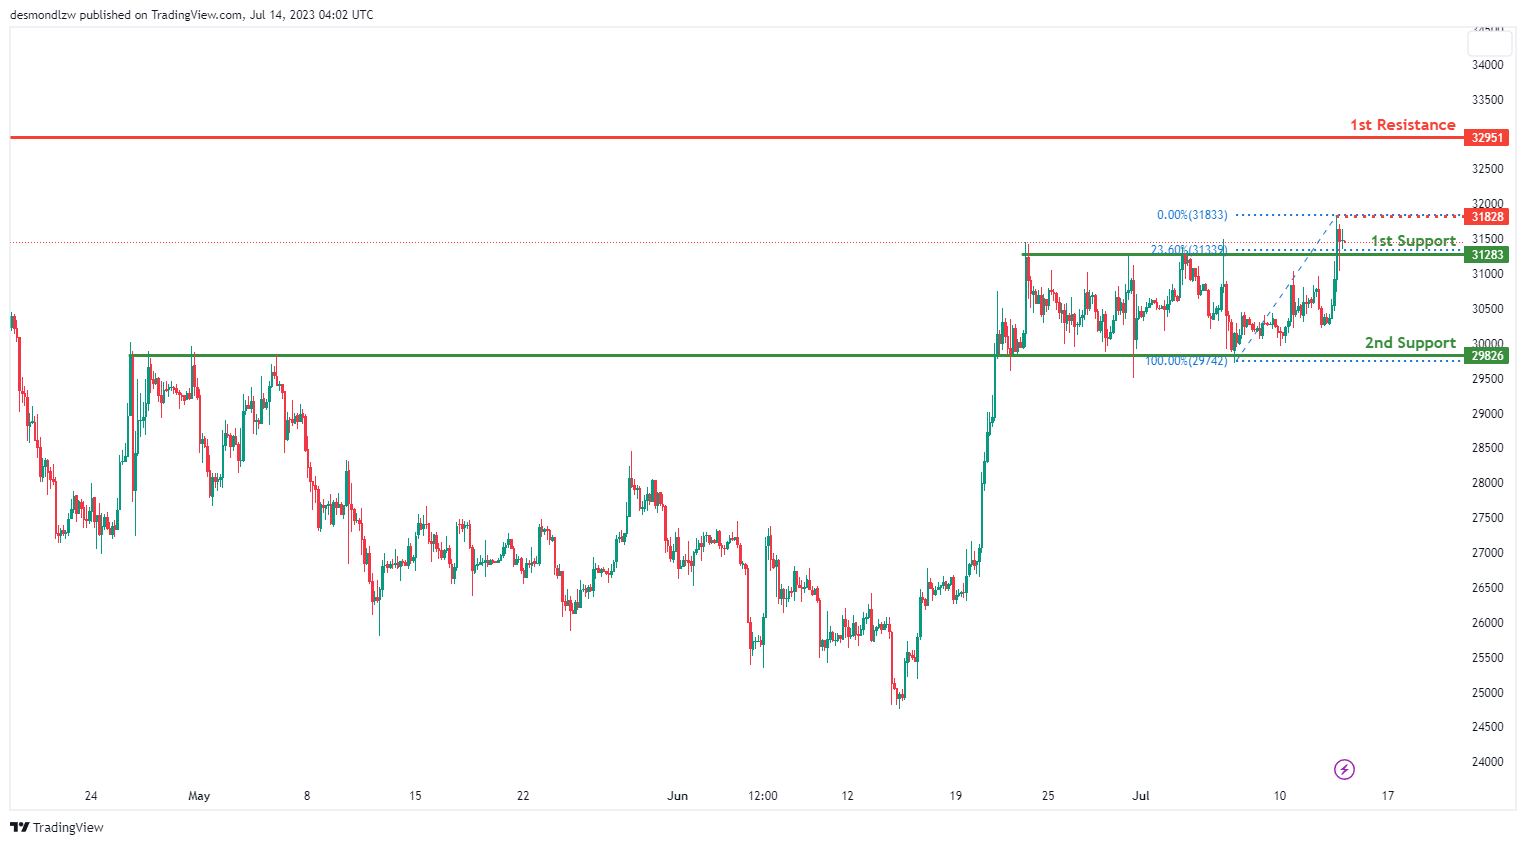
The BTC/USD instrument currently exhibits a bullish momentum. There is potential for the price to make a bullish bounce off the 1st support and head towards the 1st resistance.
The 1st support level is located at 31283 and is considered significant as it represents an overlap support, along with the 23.60% Fibonacci retracement. The 2nd support level is positioned at 29826 and is recognized as another overlap support.
Moving on to the resistance levels, the 1st resistance is found at 32951 and is deemed significant as it represents a swing high resistance. Additionally, there is an intermediate resistance level at 31828.
ETH/USD:
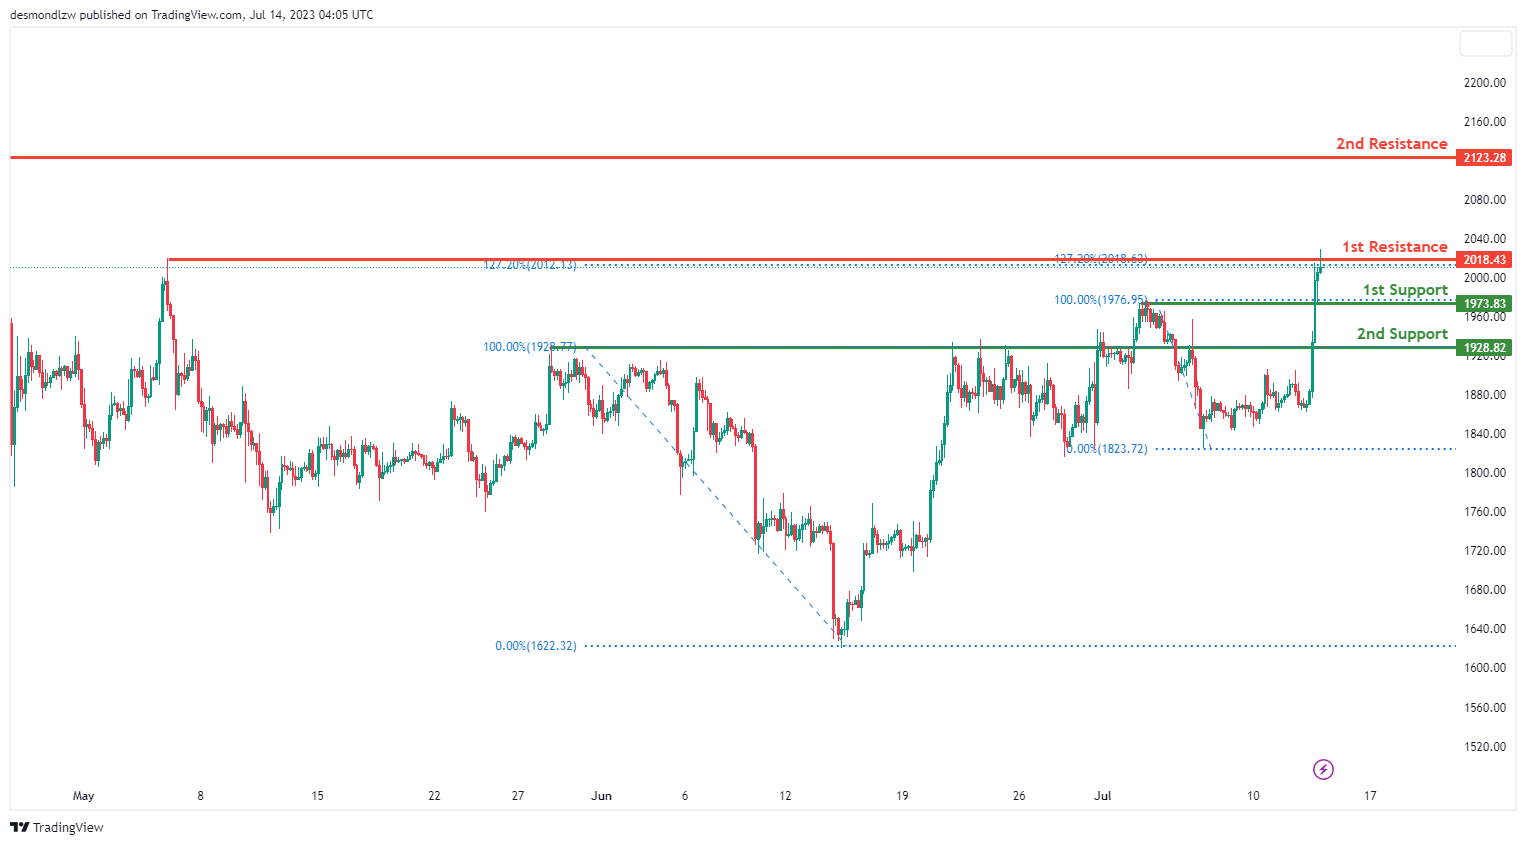
The ETH/USD instrument currently demonstrates a bearish momentum. There is potential for the price to make a bearish reaction off the 1st resistance and drop towards the 1st support.
The 1st support level is located at 1973.83 and is considered good as it represents a pullback support. The 2nd support level is positioned at 1928.82 and is recognized as an overlap support.
Moving on to the resistance levels, the 1st resistance is found at 2018.43 and is deemed significant as it represents a swing high resistance, along with the 127.20% Fibonacci extension. The 2nd resistance level is situated at 2123.28 and is considered noteworthy as it represents a multi-swing high resistance.
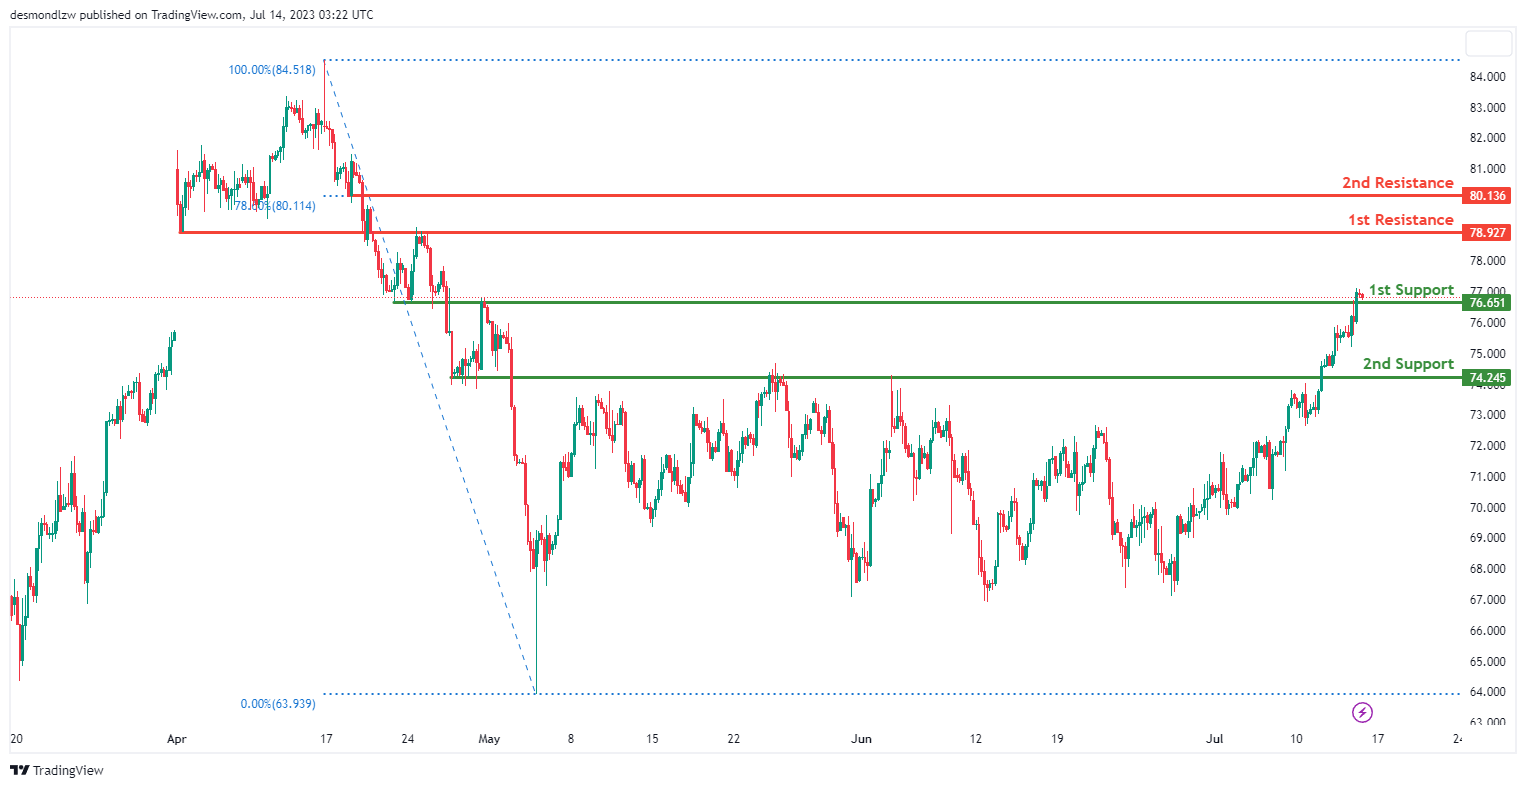
WTI/USD:
The WTI/USD chart is currently showing weak bullish momentum with low confidence. It’s anticipated that the price could potentially drop to the 1st support level in the short term before bouncing back and rising towards the 1st resistance level.
The 1st support level is at 76.65 and is characterized as an overlap support, offering a considerable level of price stability. Further down, the 2nd support level is found at 74.25, although no specific characteristics are mentioned to emphasize its significance.
On the upside, if the price reverses and ascends, it could encounter the 1st resistance level at 78.93, an overlap resistance, which could serve as a considerable barrier to upward price movements. If the price surpasses this level, it could aim for the 2nd resistance at 80.14, which is also an overlap resistance and aligns with a 78.60% Fibonacci retracement level, further strengthening its role as a potential barrier.
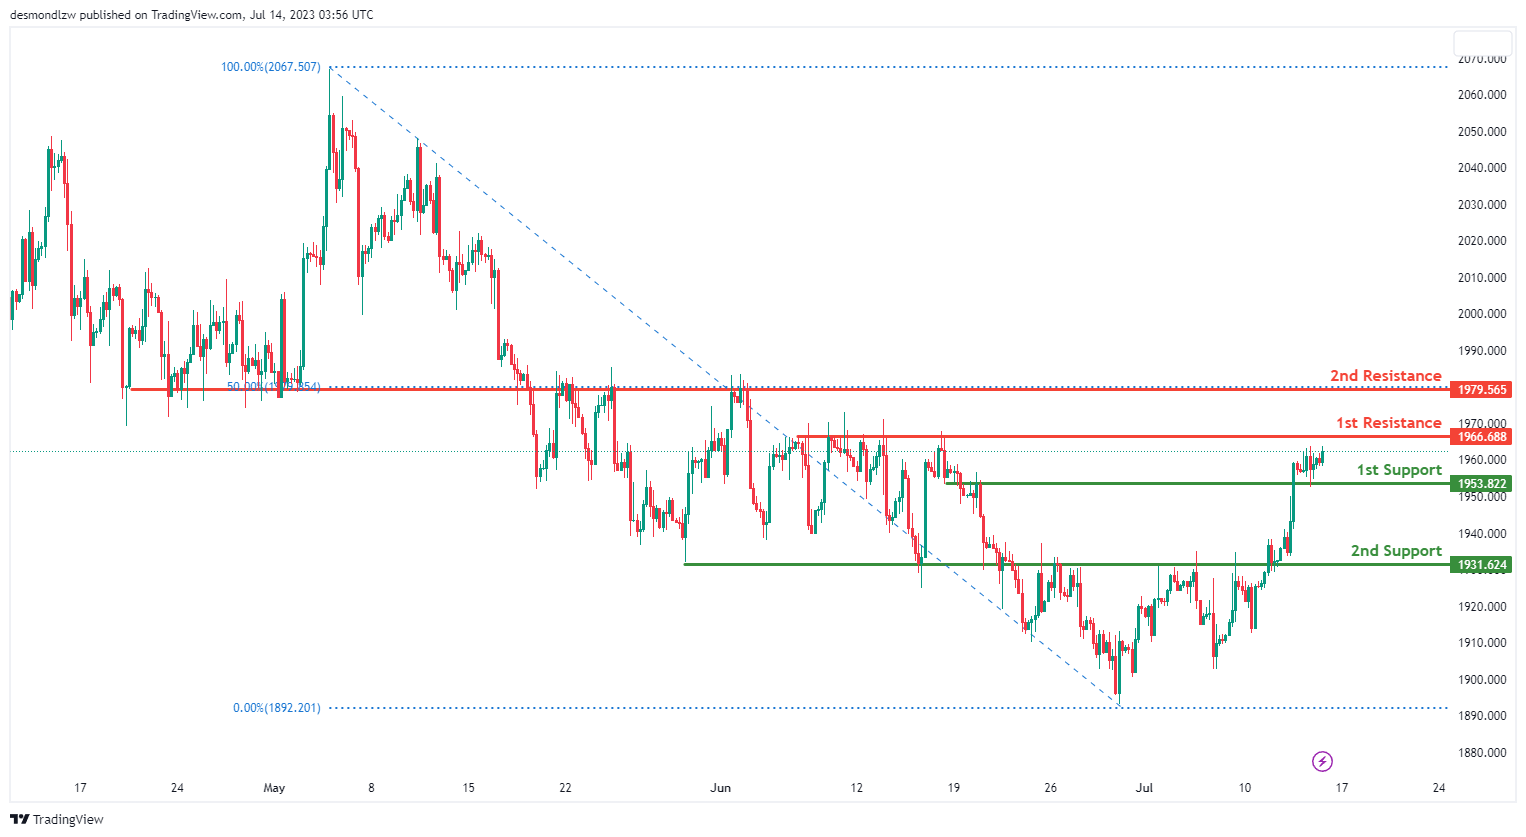
XAU/USD (GOLD):
The XAUUSD chart currently shows a neutral momentum, indicating that the price may fluctuate between the 1st resistance and 1st support level.
The 1st support level is at 1953.82. This is an overlap support level which suggests that it might have a concentration of buyers, possibly leading to a price bounce if it reaches this point.
The 2nd support level is at 1931.62. It is also an overlap support, implying another potential area of buying interest that could lead to a price rebound.
The 1st resistance level is at 1966.68. It represents a multi-swing high resistance, which means that the price has faced selling pressure and turned down at this level multiple times in the past, indicating potential future resistance.
The 2nd resistance level is at 1979.56. This is an overlap resistance and also corresponds to the 50% Fibonacci retracement level. Such confluence of technical factors can often make these levels particularly robust.


