
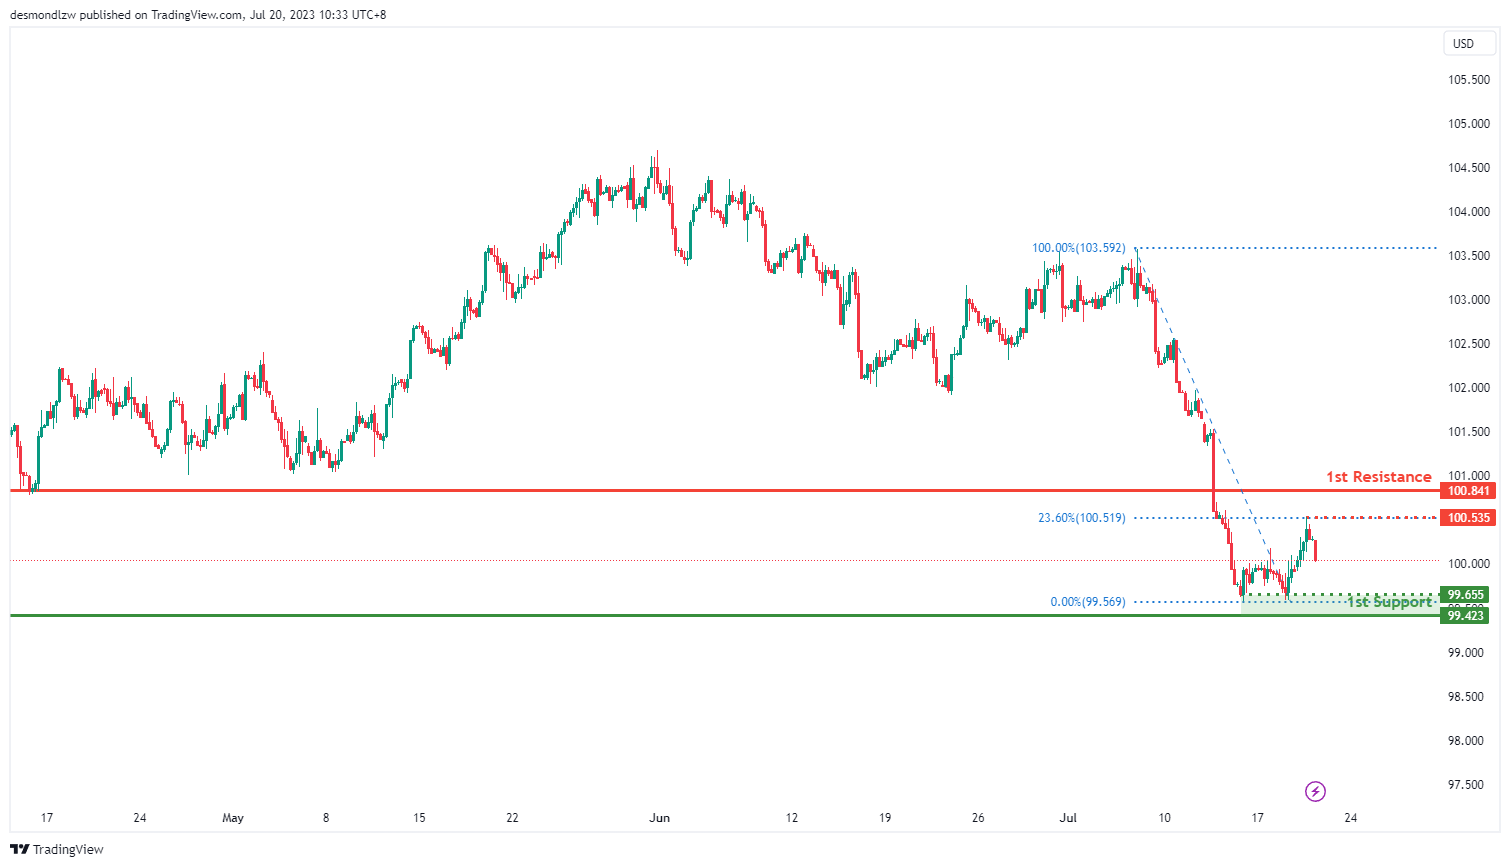
DXY:
The DXY chart indicates a bearish overall momentum, suggesting a potential continuation of the downward movement towards the 1st support level.
The 1st support at 99.42 is identified as an overlap support, serving as a significant level to watch for potential buying interest. Additionally, there is an intermediate support at 99.65, representing a multi-swing low support.
On the upside, the 1st resistance level at 100.84 is considered a pullback resistance, potentially hindering further upward movement. Furthermore, there is an intermediate resistance at 100.53, recognized as a swing high resistance.
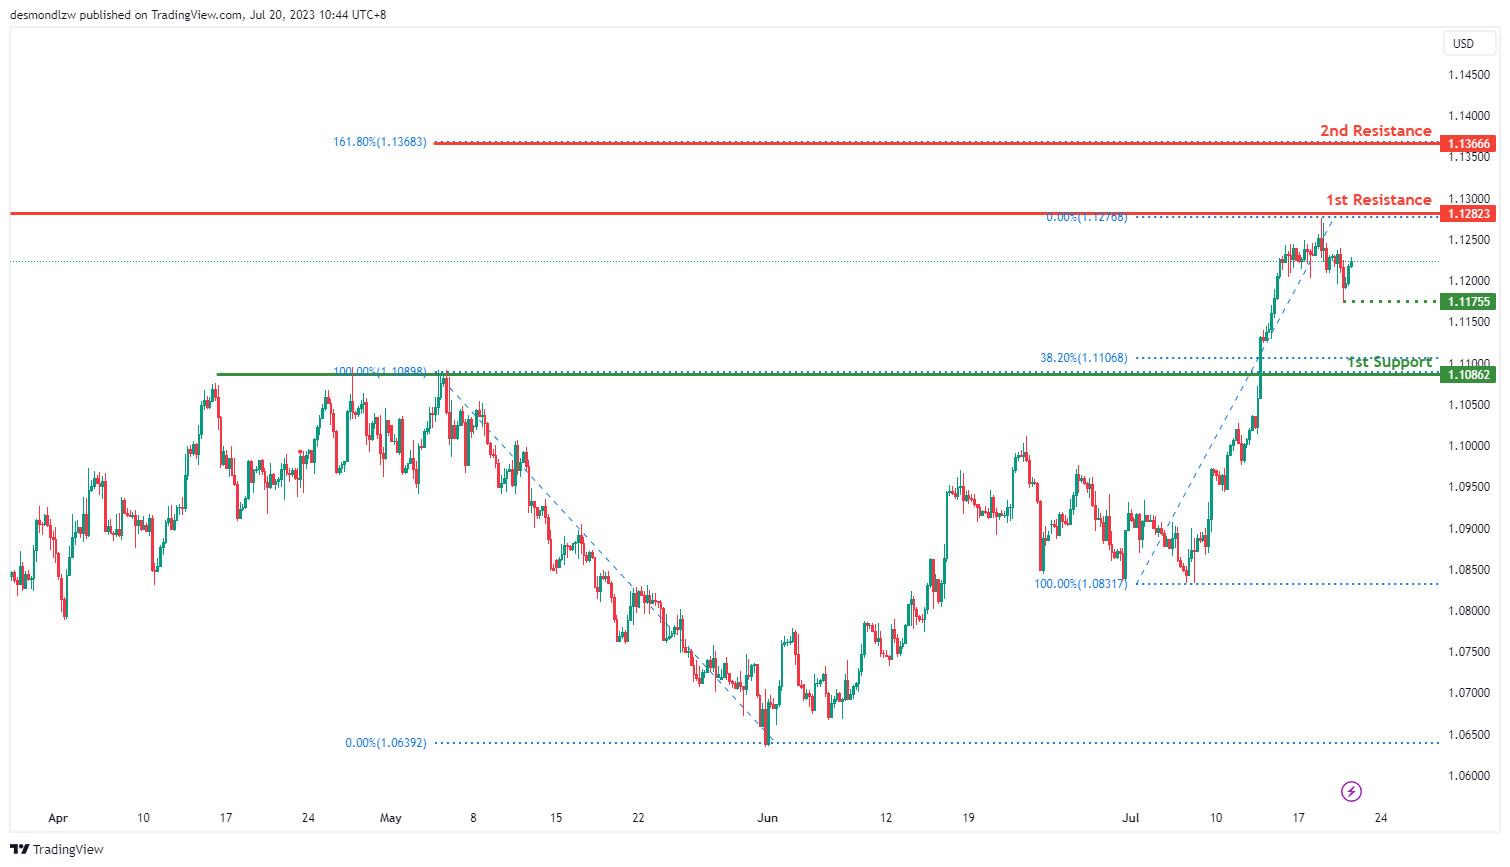
EUR/USD:
The EUR/USD chart currently exhibits a bearish overall momentum, suggesting a potential continuation of the downward movement towards the 1st support level.
The 1st support level at 1.1086 holds significance as a pullback support, coinciding with the 38.20% Fibonacci retracement level. Additionally, there is an intermediate support level at 1.1175, identified as a swing low support.
Conversely, on the upside, the 1st resistance level at 1.1282 serves as a notable overlap resistance. Furthermore, the 2nd resistance level at 1.1366 aligns with the 161.80% Fibonacci extension, adding to its significance.
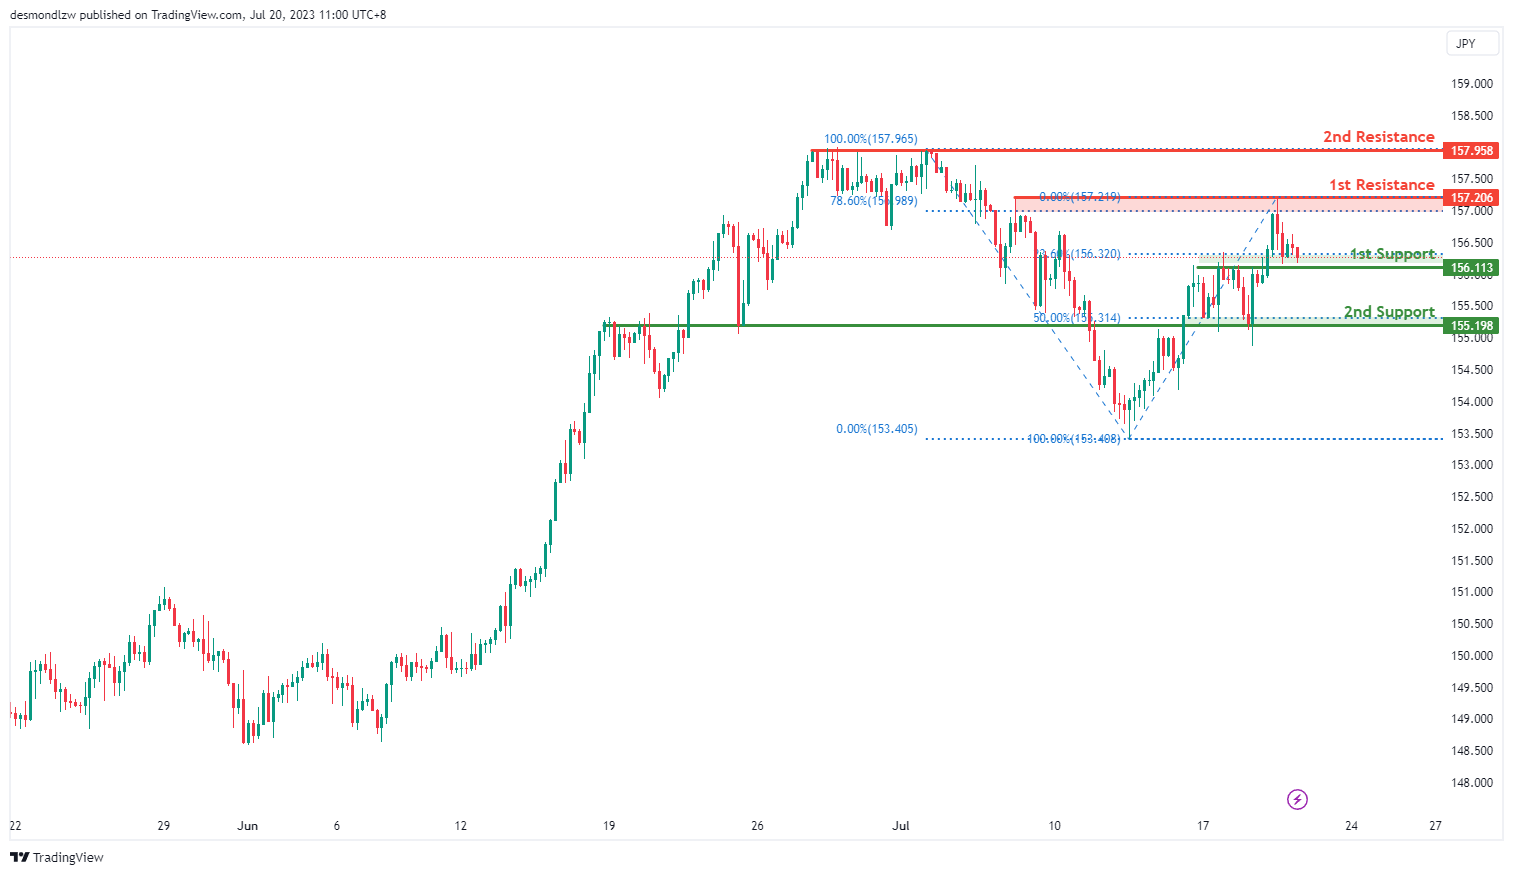
EUR/JPY:
The EUR/JPY chart currently indicates a bullish overall momentum. There is a potential for a bullish bounce off the 1st support level, leading the price towards the 1st resistance.
The 1st support level at 156.11 is identified as a pullback support and aligns with the 23.60% Fibonacci Retracement level. Additionally, the 2nd support level at 155.19 is recognized as an overlap support and coincides with the 61.80% Fibonacci Retracement level.
On the upside, the 1st resistance level at 157.20 represents a multi-swing high resistance. Furthermore, the 2nd resistance level at 157.95 is also identified as a multi-swing high resistance. These resistance levels may pose challenges to further price advancement.
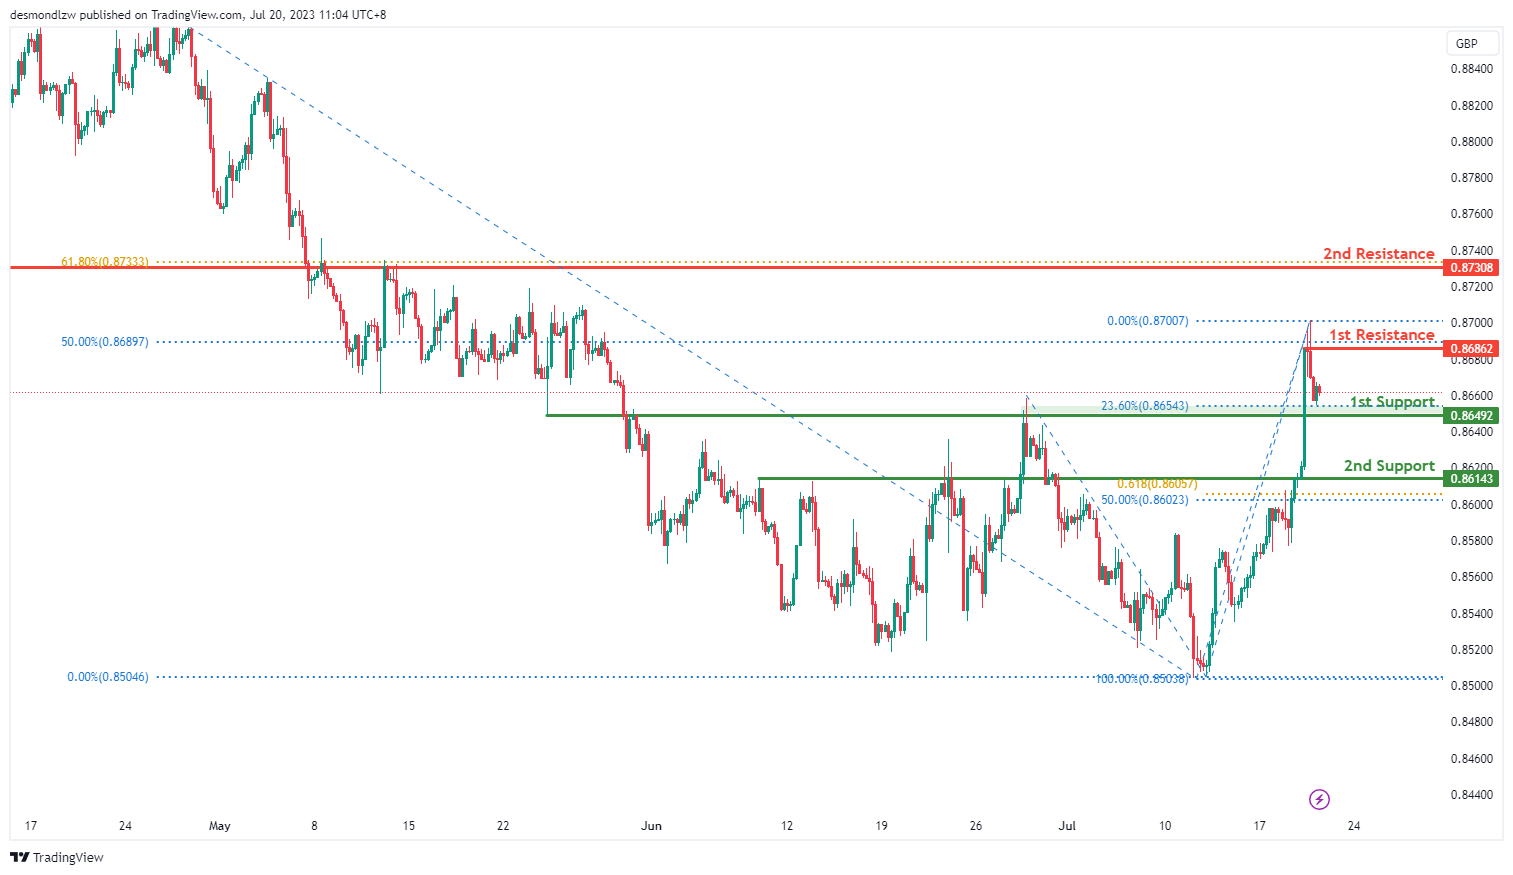
EUR/GBP:
The EUR/GBP chart currently indicates a bullish overall momentum. There is a potential for a bullish bounce off the 1st support level, leading the price towards the 1st resistance.
The 1st support level at 0.8649 is identified as an overlap support and coincides with the 23.60% Fibonacci Retracement level. Additionally, the 2nd support level at 0.8614 is recognized as an overlap support and exhibits Fibonacci confluence with the 61.80% and 50% Fibonacci Retracement levels.
On the upside, the 1st resistance level at 0.8686 represents a swing high resistance and aligns with the 50% Fibonacci Retracement level. Furthermore, the 2nd resistance level at 0.8730 is identified as a multi-swing high resistance and coincides with the 61.80% Fibonacci Retracement level.
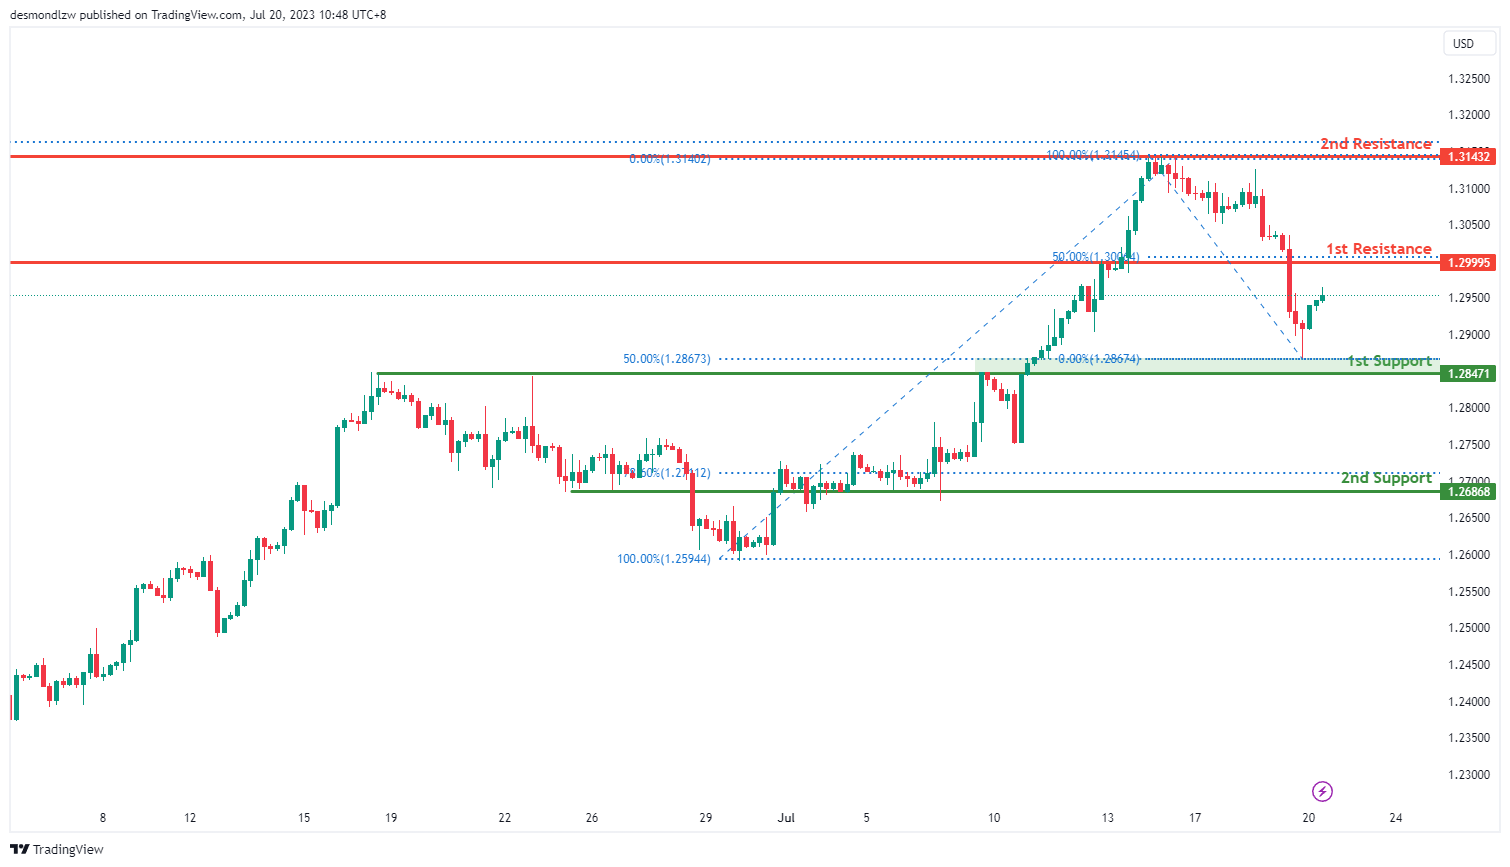
GBP/USD:
The GBP/USD chart currently demonstrates a bullish overall momentum, indicating the potential for a continuation of the upward movement towards the 1st resistance level.
The 1st support level at 1.2847 is identified as an overlap support, coinciding with the 50% Fibonacci retracement level, thereby providing a strong foundation for potential price bounces. Additionally, the 2nd support level at 1.2686 acts as another overlap support, aligning with the 78.60% Fibonacci retracement level.
On the upside, the 1st resistance level at 1.2999 represents a significant pullback resistance, coinciding with the 50% Fibonacci retracement level. Furthermore, the 2nd resistance level at 1.3143 is characterized as a multi-swing high resistance, adding to its importance.
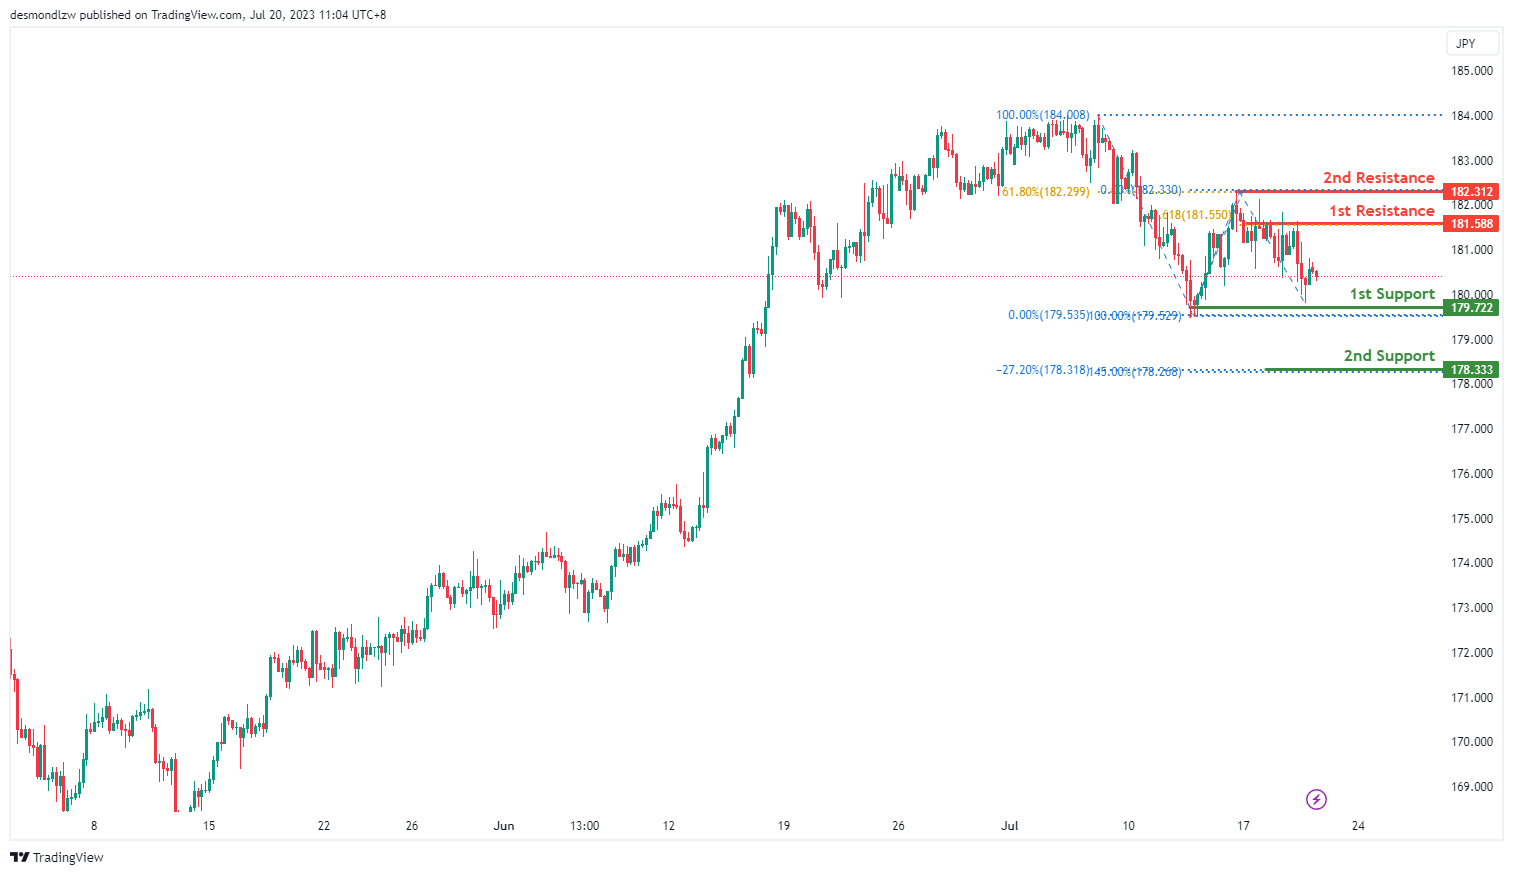
GBP/JPY:
The GBP/JPY chart currently indicates a bearish overall momentum. There is a potential for a bearish continuation towards the first support level.
The first support level at 179.72 is identified as a multi-swing low support, suggesting its significance in providing potential price stability. Additionally, the second support level at 178.33 exhibits Fibonacci confluence with the -27% Fibonacci Expansion and 145.00% Fibonacci Extension, further emphasizing its potential as a support level.
On the upside, the first resistance level at 181.58 represents a multi-swing high resistance and aligns with the 61.80% Fibonacci Projection. Furthermore, the second resistance level at 182.31 is recognized as a swing high resistance and coincides with the 61.80% Fibonacci Retracement.
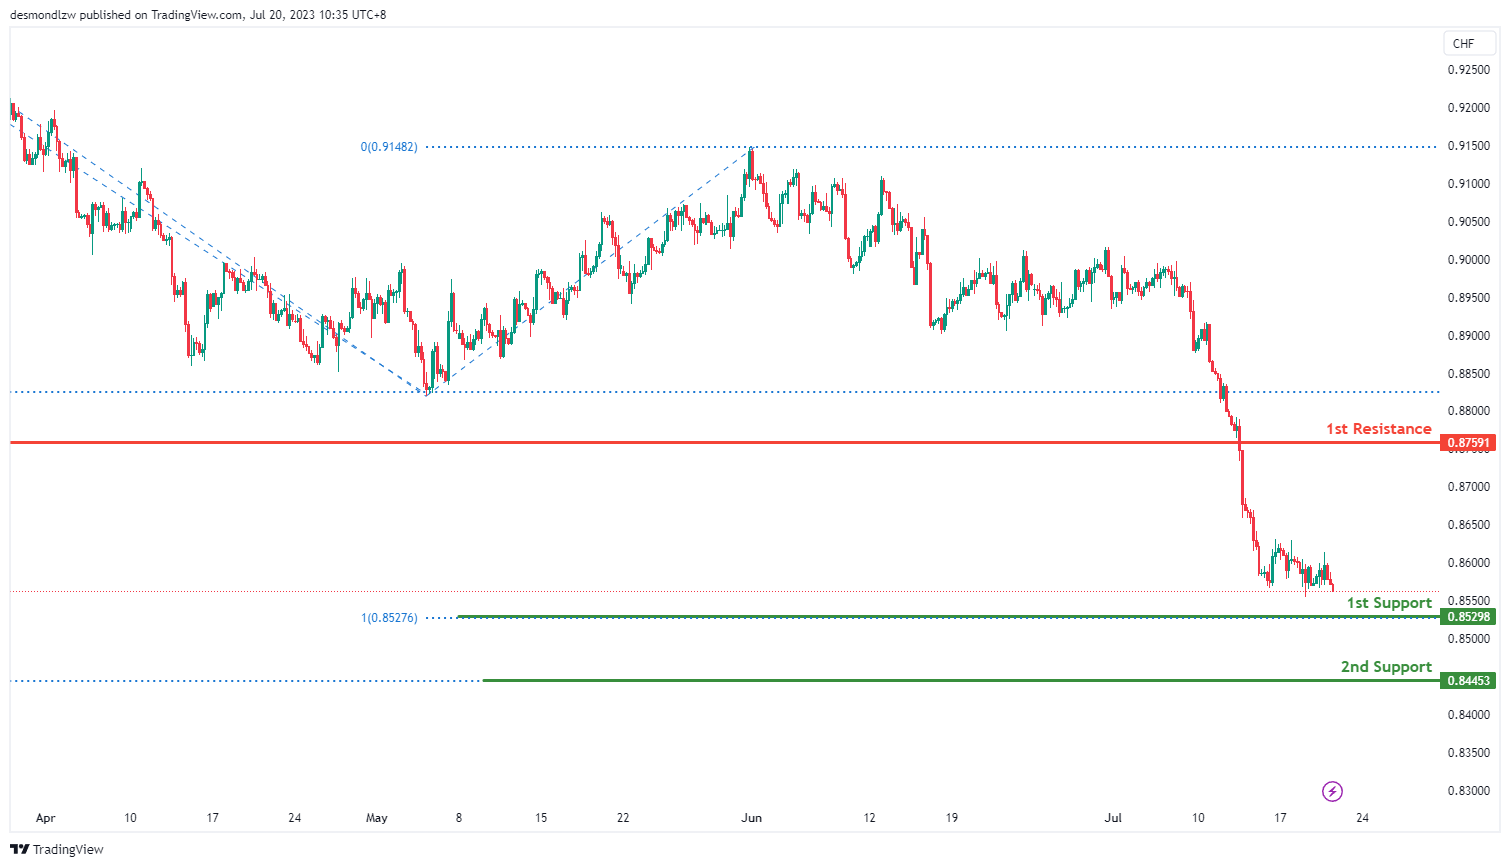
USD/CHF:
The USD/CHF currency pair currently demonstrates a bearish overall momentum, suggesting the potential for a continuation of the downward movement towards the 1st support level.
The 1st support level at 0.8529 is significant as it aligns with the 100% Fibonacci Projection. This level may act as a strong support zone, attracting buying interest and potentially halting the price decline. Additionally, the 2nd support level at 0.8445 corresponds to the -61.8% Fibonacci Expansion, further reinforcing its significance as a potential area of support.
On the upside, the 1st resistance level at 0.8759 is identified as a pullback resistance, which may impede upward price movement. It is important to monitor price action around this level, as a failure to break above it could maintain the bearish momentum.
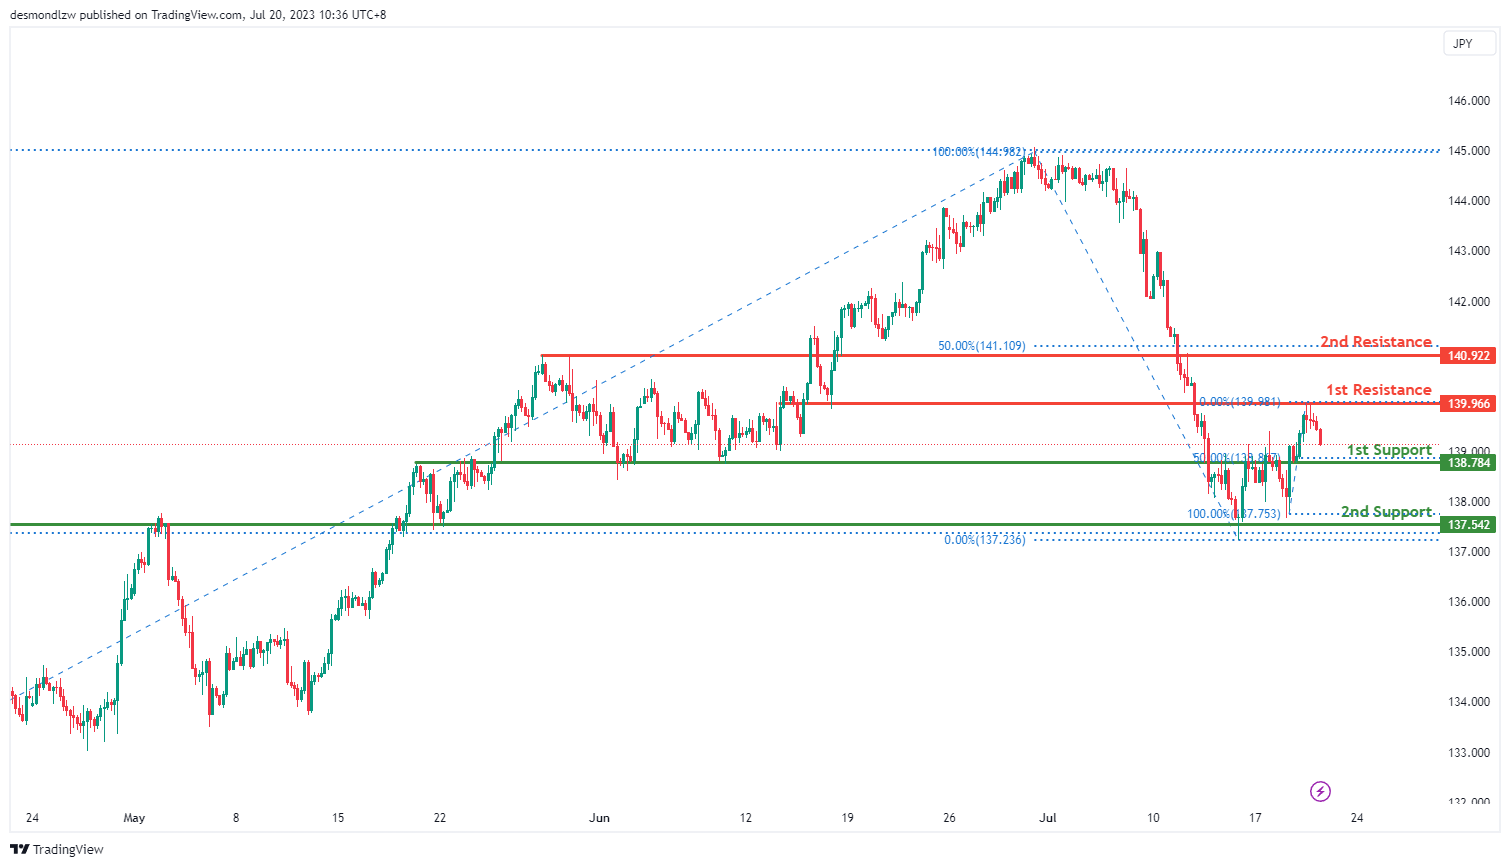
USD/JPY:
The USD/JPY currency pair currently exhibits a bearish overall momentum, indicating the potential for a continuation of the downward movement towards the 1st support level.
The 1st support level at 138.78 is identified as a pullback support and coincides with the 50% Fibonacci Retracement level. This level is expected to provide a strong foundation for potential price rebounds. Additionally, the 2nd support level at 137.54 acts as an overlap support, further reinforcing its significance in providing potential price support.
On the upside, the 1st resistance level at 139.96 is characterized as an overlap resistance, which could pose a barrier to upward price movement. Furthermore, the 2nd resistance level at 140.92 also acts as an overlap resistance, adding to its importance in limiting the potential upward movement.
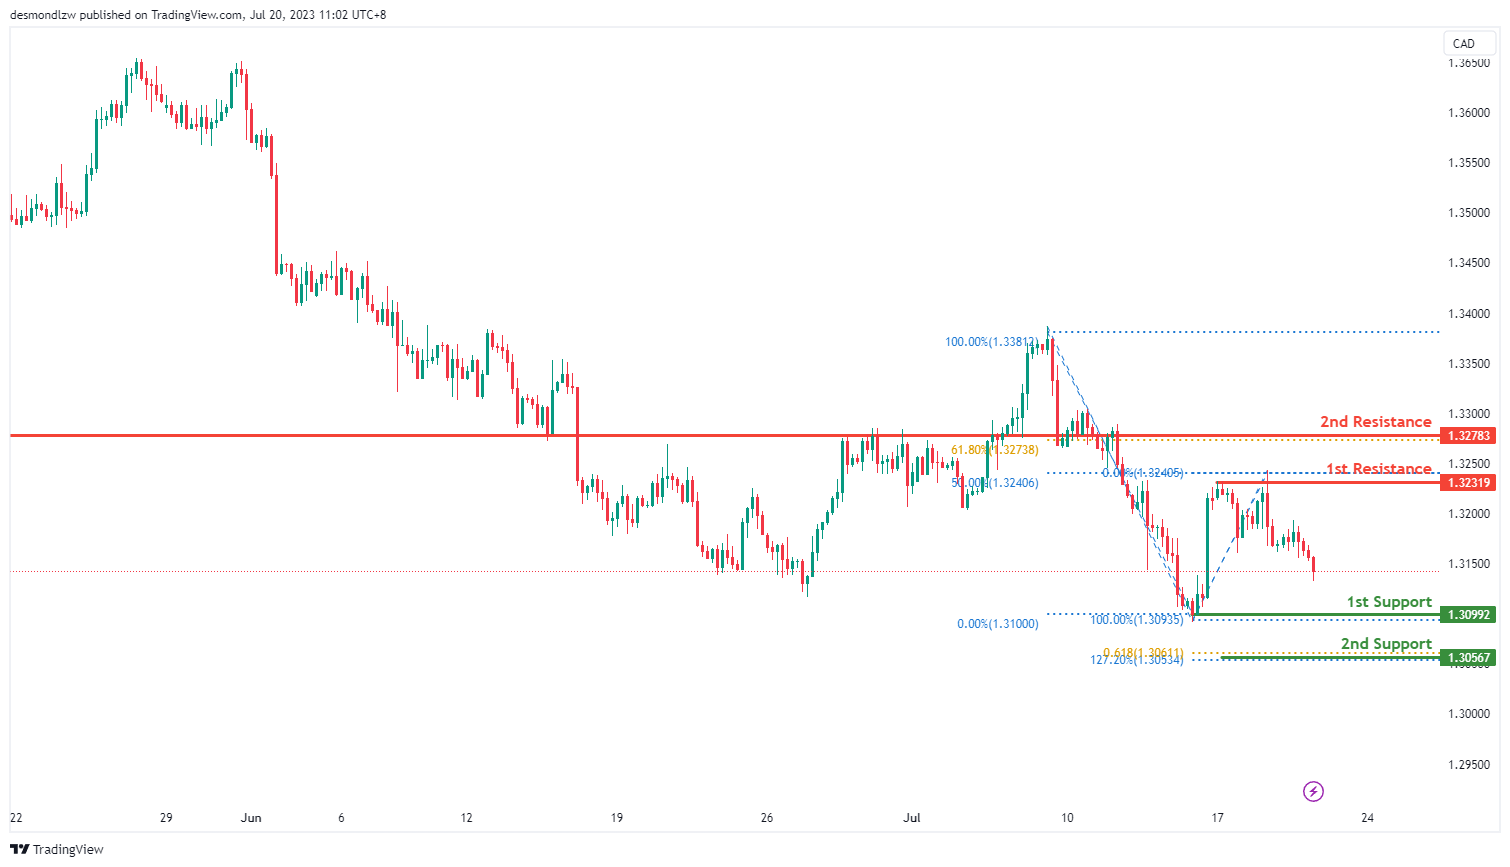
USD/CAD:
The USD/CAD pair is currently showing a strong bearish trend with high confidence, suggesting a potential continuation of the bearish momentum towards the 1st support level.
The 1st line of support is at 1.3099, acting as a swing low support that could potentially halt the bearish movement. Should the price decline further, the 2nd support level at 1.3057, identified as a support level that corresponds to a Fibonacci confluence at the 61.8% projection and 127.2% extension levels, could serve as a robust barrier against further price drop.
On the flip side, if the trend reverses, the 1st resistance at 1.3232, a multi-swing high resistance and the 50% Fibonacci retracement level, could challenge the price advancement. A further upward movement could meet the 2nd resistance level at 1.3278, a pullback resistance coinciding with the 61.8% Fibonacci retracement, potentially impeding further price ascension.
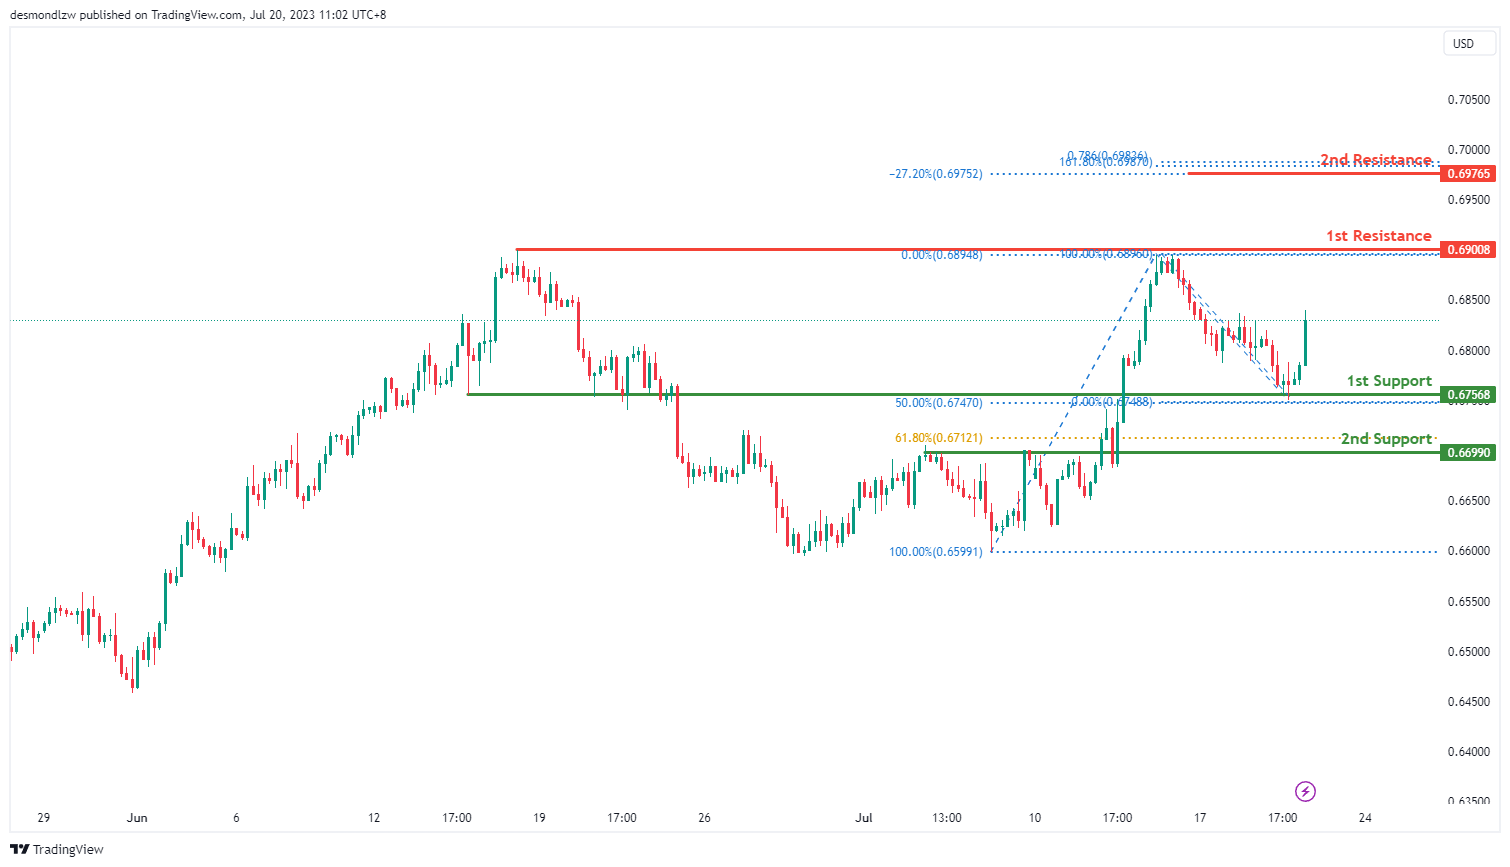
AUD/USD:
The AUD/USD pair currently displays a strong bullish trend with high confidence, suggesting a potential continuation of this upward momentum towards the 1st resistance level.
The 1st line of support is at 0.6757, recognized as an overlap support and aligning with the 50% Fibonacci retracement level. This could potentially halt any bearish retracement. If the price descends further, the 2nd support level at 0.6699, another overlap support coinciding with the 61.8% Fibonacci retracement, could serve as a significant rebound zone.
Conversely, if the bullish trend continues, the price may face resistance at the 1st level of 0.6901, identified as an overlap resistance. A further upward trend might encounter the 2nd resistance level at 0.6977, a resistance level which corresponds with a Fibonacci confluence at the 78.6% projection, 161.8% extension and -27% expansion levels. This could potentially hinder the price’s upward movement.
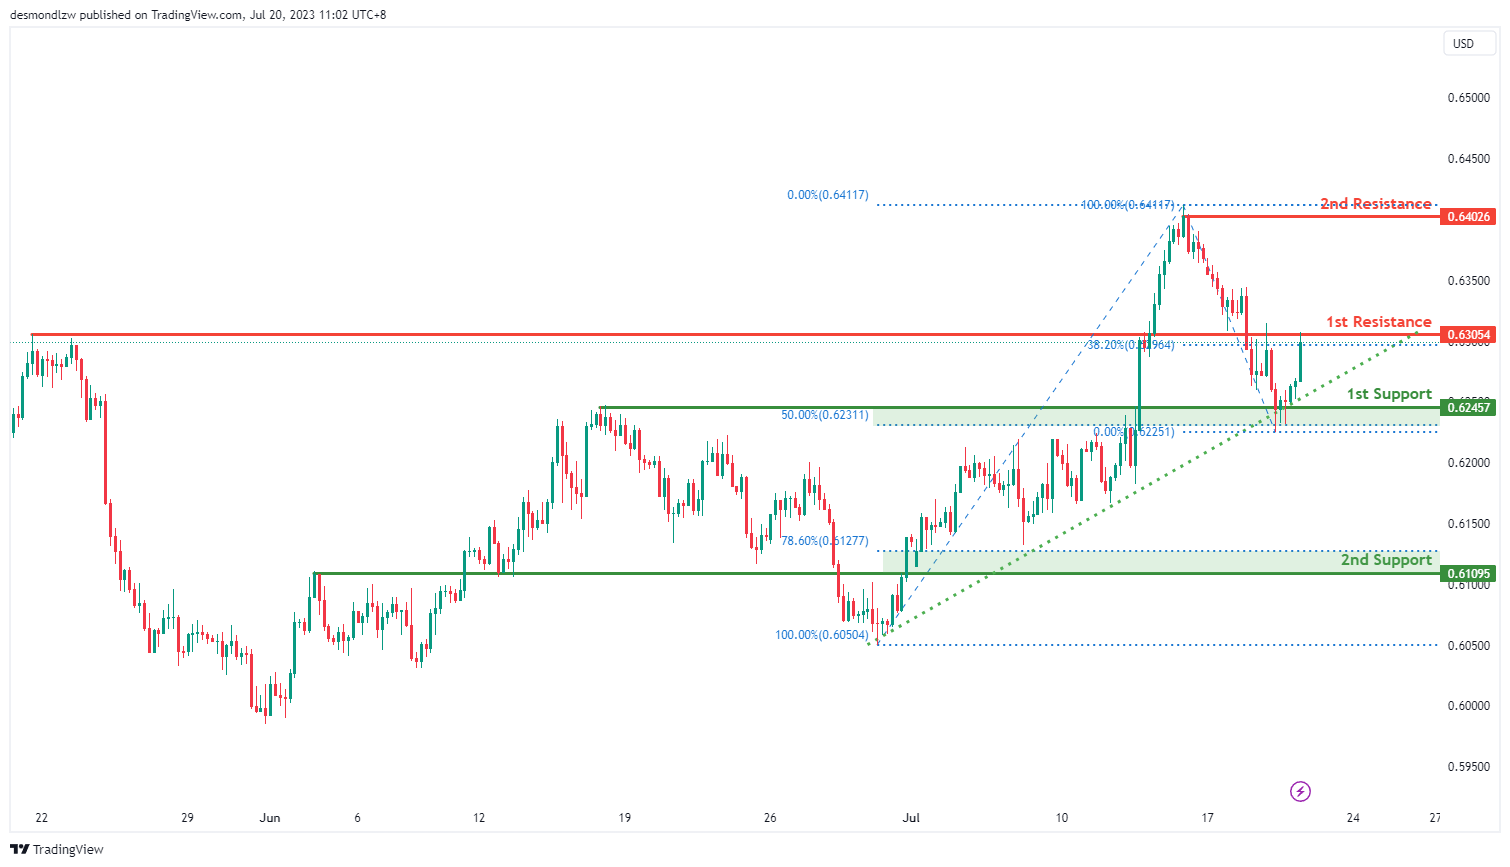
NZD/USD
The NZD/USD pair is showing a strong bullish trend with high confidence, primarily due to the price being above a significant ascending trend line, which suggests a potential continuation of the bullish momentum.
If the price starts to retract, the 1st support level is at 0.6246, which is an overlap support coinciding with the 50% Fibonacci retracement level, providing a potential floor for the price. If the price falls further, the 2nd support level at 0.6109, another overlap support and also the 78.6% Fibonacci retracement level, could halt further decline.
However, if the bullish momentum continues, the price could face resistance at 0.6305, an overlap resistance level that aligns with the 38.2% Fibonacci retracement. If the price continues to climb and surpasses this level, the next challenge could come from the 2nd resistance level at 0.6403, which is a swing high resistance. These resistance levels could potentially halt the price’s upward movement.
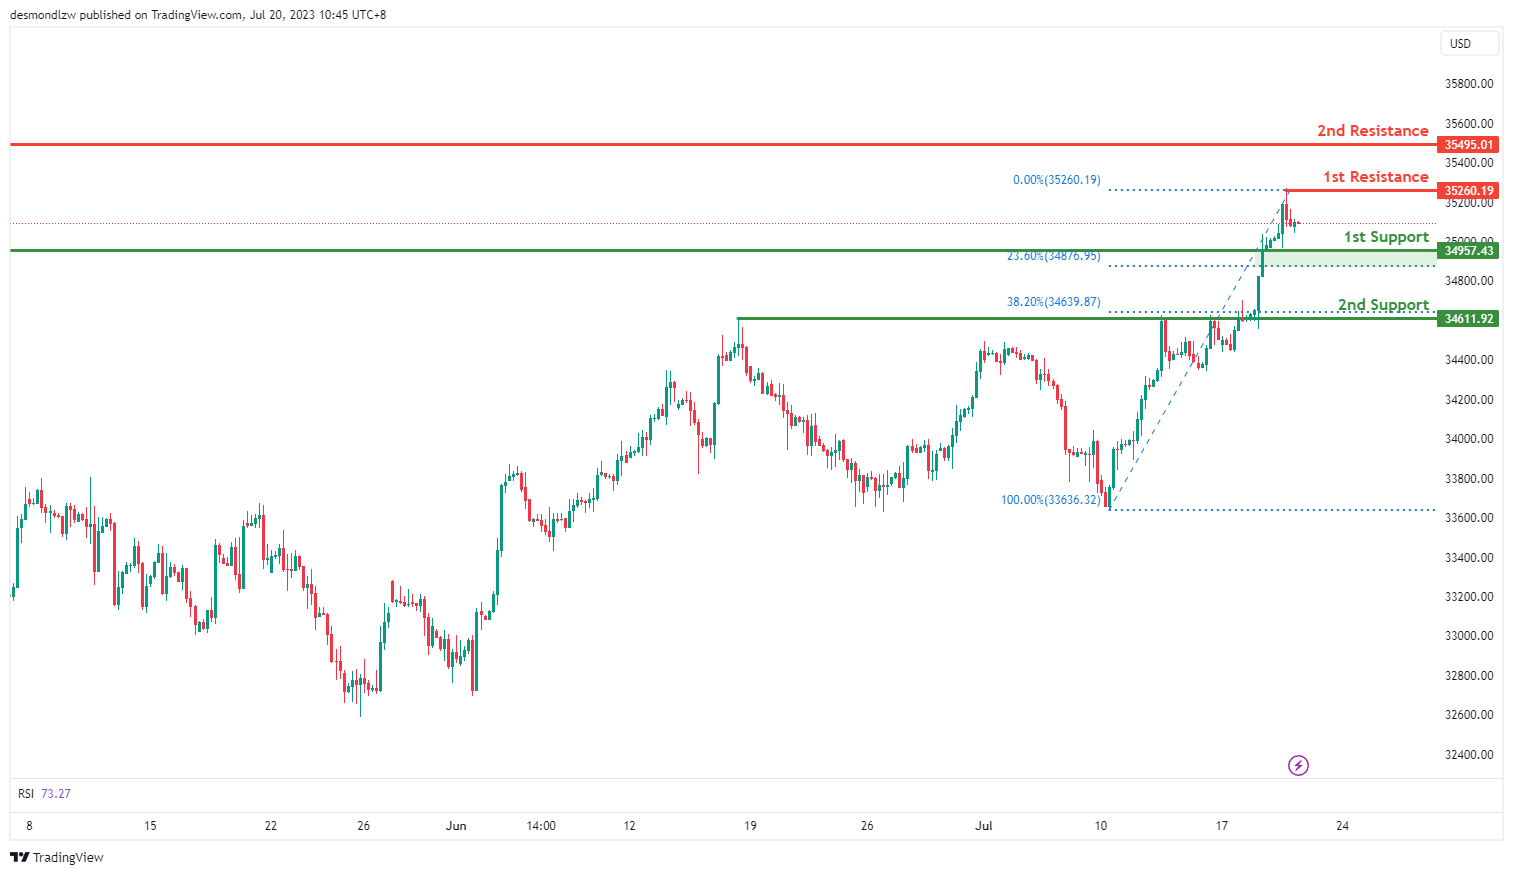
DJ30:
The DJ30 (Dow Jones Industrial Average) chart currently exhibits a bullish overall momentum. There is a potential for a bullish bounce off the 1st support level, followed by a potential upward movement towards the 1st resistance level.
The 1st support level at 34,957.43 is identified as a pullback support and aligns with the 23.60% Fibonacci Retracement level. Additionally, the 2nd support level at 34,611.92 acts as a pullback support and coincides with the 38.20% Fibonacci Retracement level.
On the upside, the 1st resistance level at 35,260.19 represents a swing high resistance. If the price breaks above this level, it could further advance towards the 2nd resistance level at 35,495.01, which is also identified as a swing high resistance. These resistance levels may pose challenges to further price advancement.
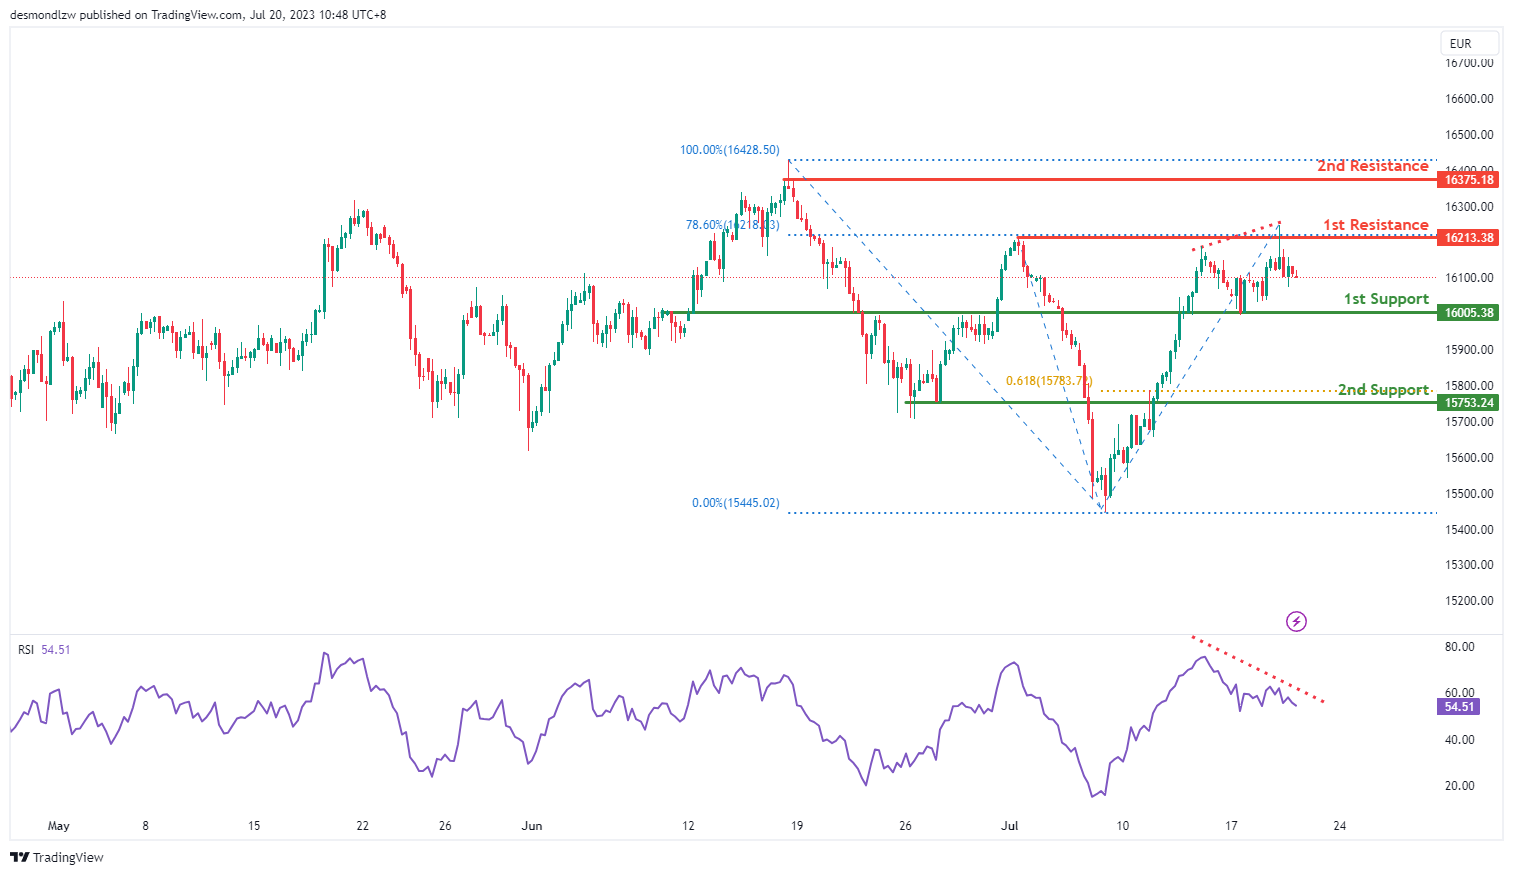
GER30:
The GER30 (DAX) chart currently indicates a bearish overall momentum. There is a potential for a bearish continuation towards the 1st support level.
The 1st support level at 16,005.38 is identified as an overlap support and coincides with the 23.60% Fibonacci Retracement level. Additionally, the 2nd support level at 15,753.24 acts as an overlap support and aligns with the 61.80% Fibonacci Projection level.
On the upside, the 1st resistance level at 16,213.38 represents a multi-swing high resistance and coincides with the 78.60% Fibonacci Retracement level. Furthermore, the 2nd resistance level at 16,375.18 is identified as a swing high resistance. These resistance levels may limit further price advancement.
The Relative Strength Index (RSI) is displaying bearish divergence versus price, indicating a potential rapid decline in price. This further supports the bearish outlook for the GER30 chart.
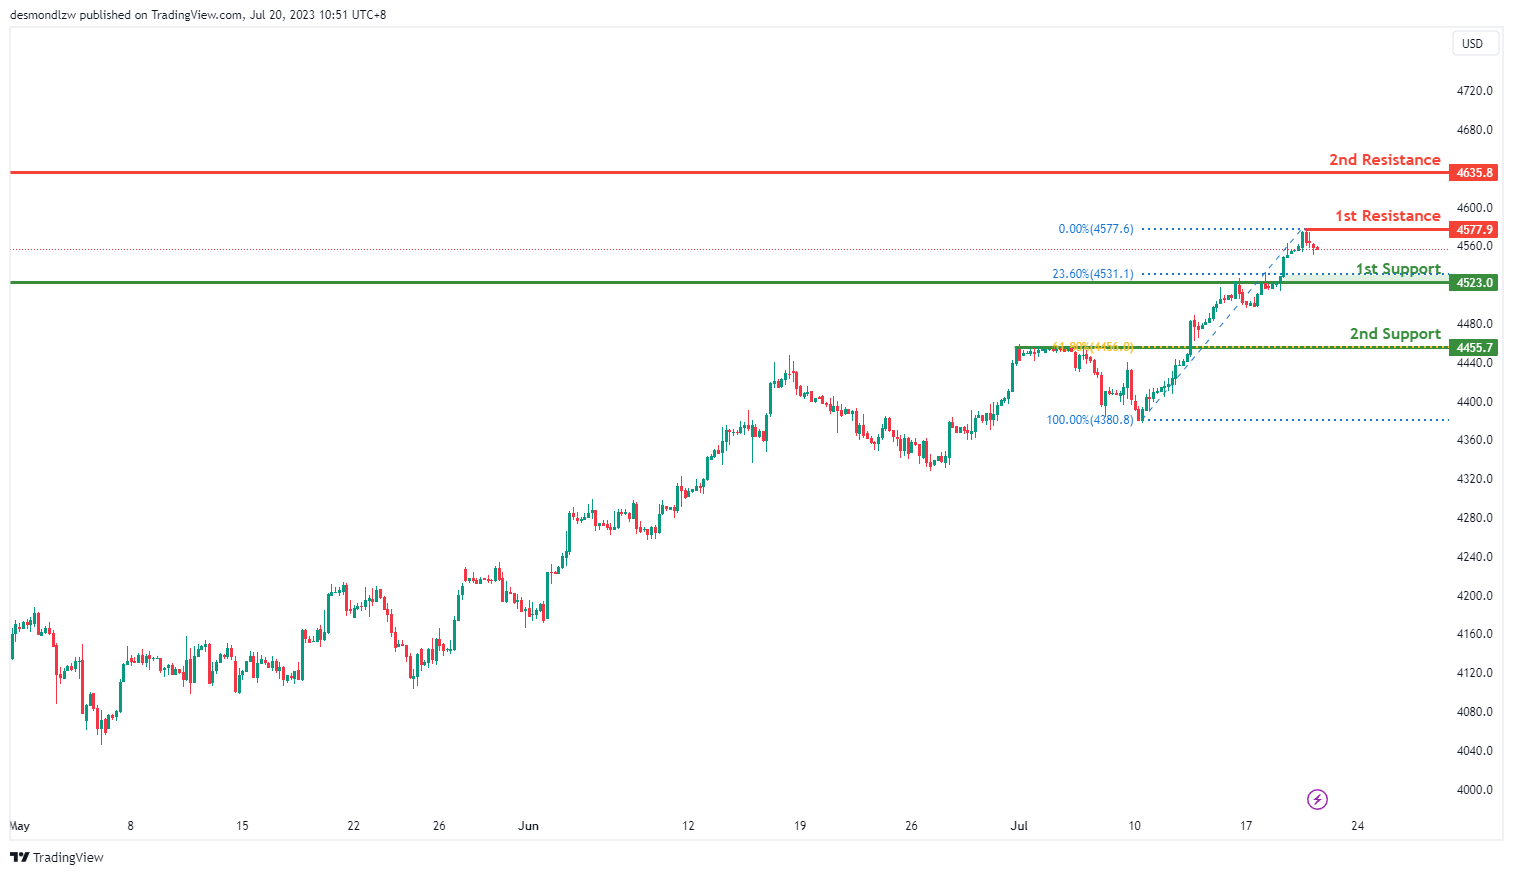
US500
The US500 (S&P 500) chart currently demonstrates a bearish overall momentum. There is a potential for a bearish continuation towards the 1st support level.
The 1st support level at 4523.0 is identified as a pullback support and coincides with the 23.60% Fibonacci Retracement level. Additionally, the 2nd support level at 4455.7 acts as an overlap support and aligns with the 61.80% Fibonacci Retracement level.
On the upside, the 1st resistance level at 4577.9 represents a swing high resistance. Furthermore, the 2nd resistance level at 4635.8 is also identified as a swing high resistance. These resistance levels may impede further price advancement.
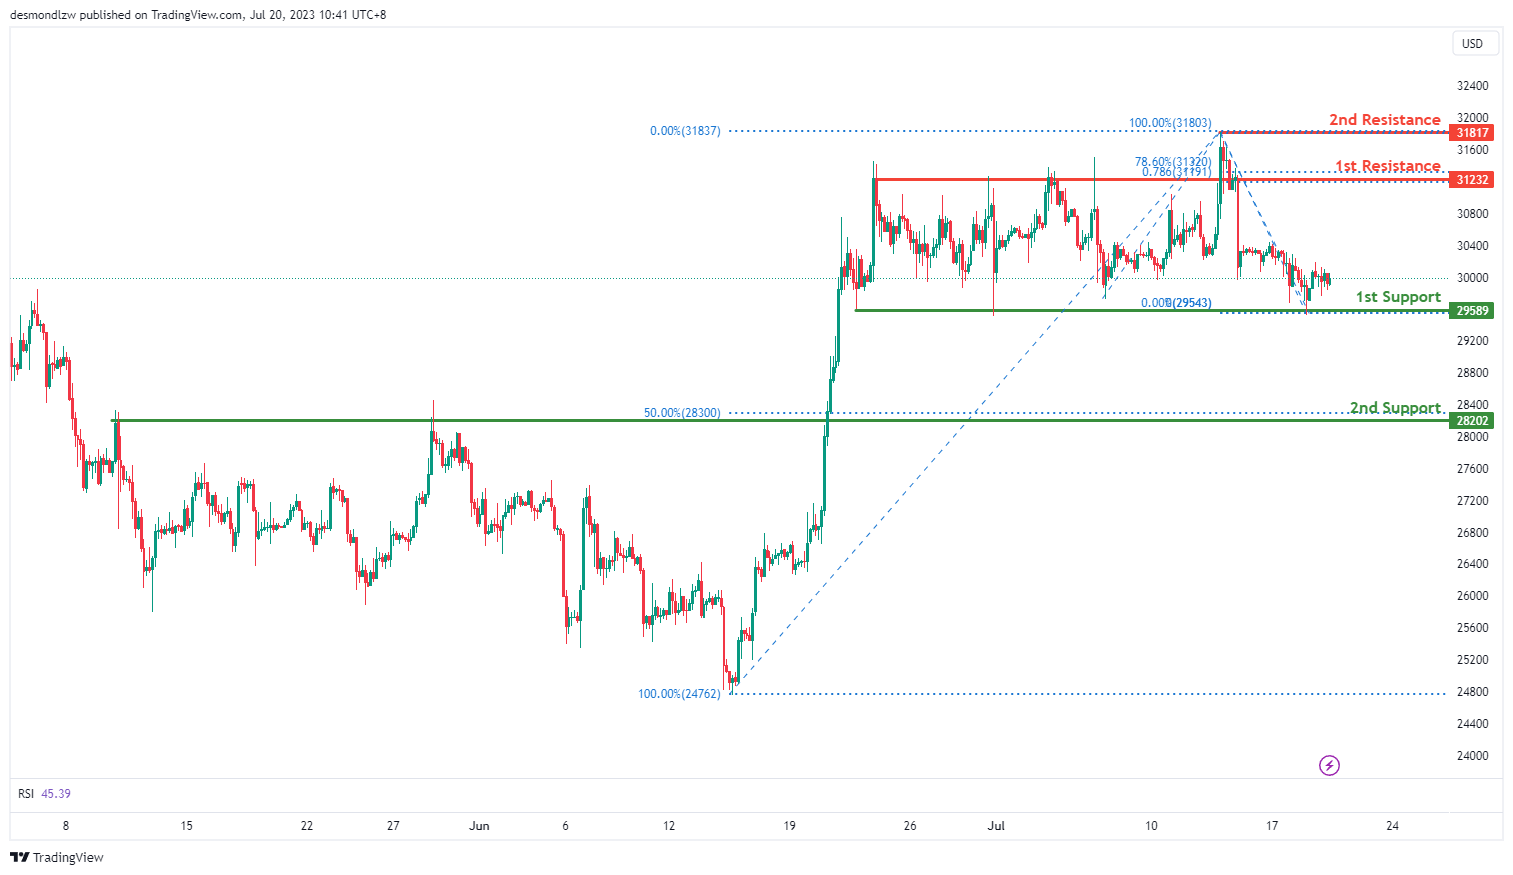
BTC/USD:
The BTC/USD chart currently indicates a bullish overall momentum. There is a potential for a bullish continuation towards the first resistance level.
The first support level at 29,589 is identified as a multi-swing low support, indicating its significance in providing potential price stability. Additionally, the second support level at 28,202 is considered a pullback support, coinciding with the 50% Fibonacci Retracement.
On the upside, the first resistance level at 31,232 represents an overlap resistance and exhibits Fibonacci confluence with the 78.60% Fibonacci Projection and 78.60% Fibonacci Retracement, suggesting its importance as a potential barrier. Furthermore, the second resistance level at 31,817 is recognized as a swing high resistance.
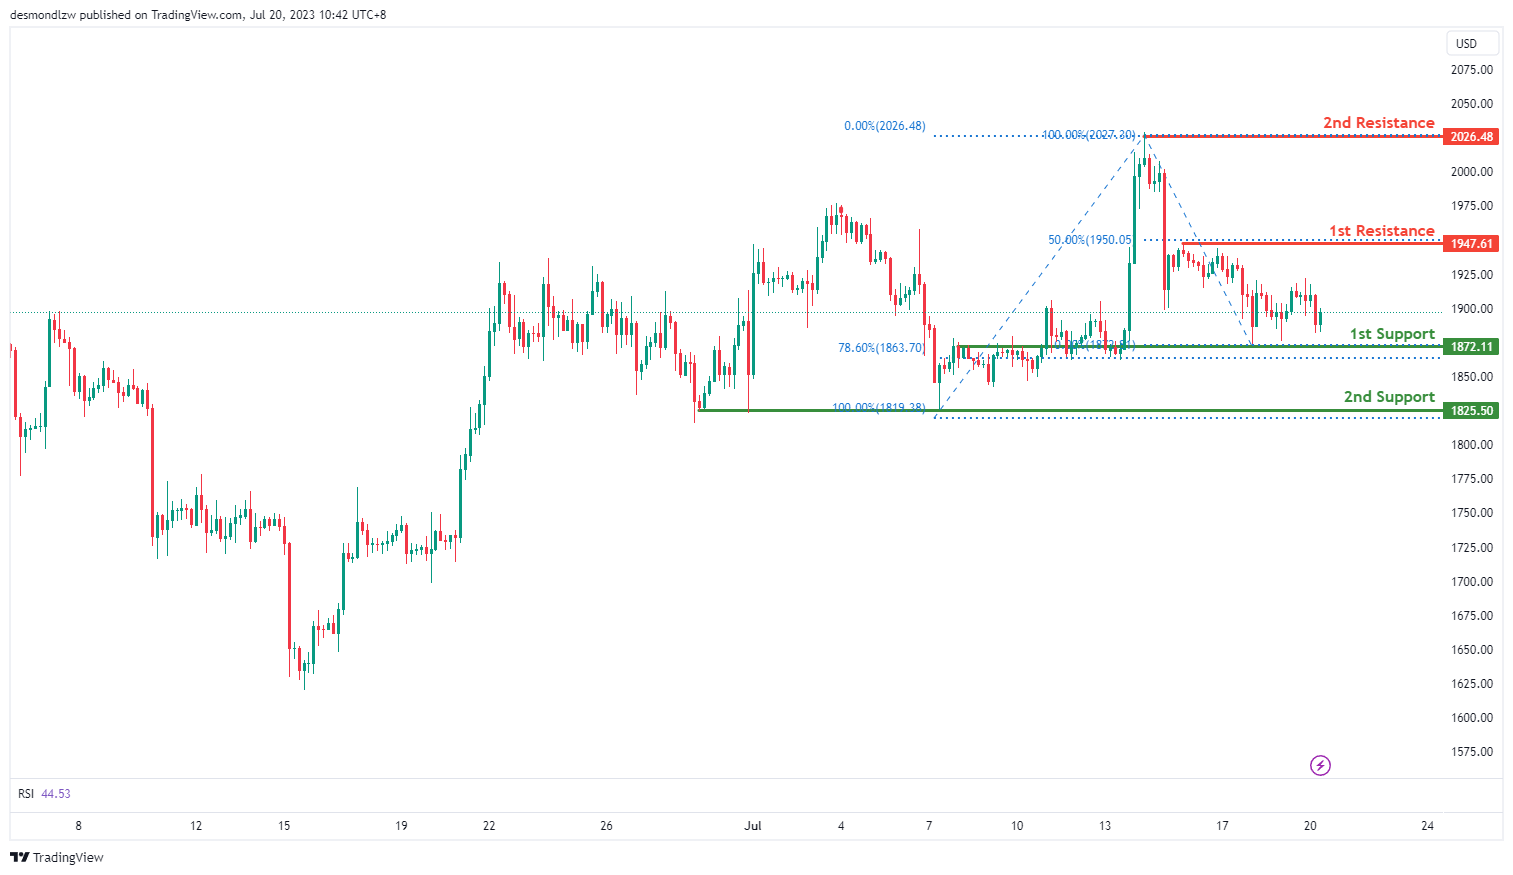
ETH/USD:
The ETH/USD chart demonstrates a bullish momentum, indicating the potential for a bullish continuation towards the 1st resistance level.
The 1st support level at 1872.11 is considered good due to its status as an overlap support and aligning with the 78.60% Fibonacci Retracement level. Additionally, the 2nd support at 1825.50 acts as a multi-swing low support.
On the upside, the 1st resistance level at 1947.61 represents a multi-swing high resistance and coincides with the 50% Fibonacci Retracement level. Furthermore, the 2nd resistance at 2026.48 is identified as a swing high resistance.
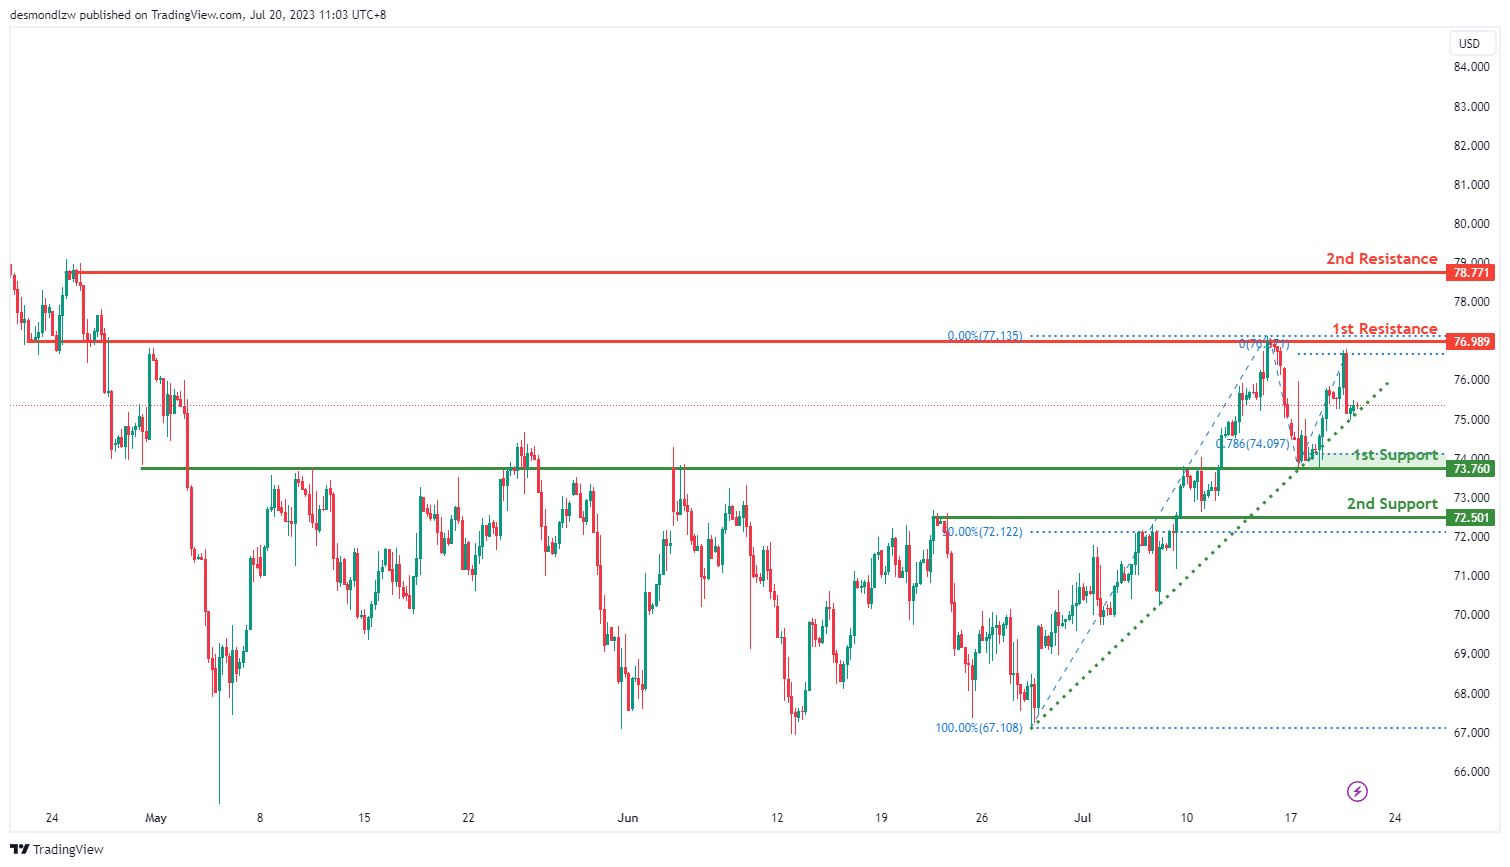
WTI/USD:
The WTI/USD chart currently shows a weak bullish momentum with low confidence. It is suggested that the price could potentially drop to the 1st support in the short term before bouncing back and rising towards the 1st resistance level.
The 1st support level is at 73.76, which has been identified as an overlap support. This could potentially provide a rebound point for the price in the event of a further decline.
The 2nd support level is at 72.50, recognized as an overlap support and also coincides with the 50% Fibonacci retracement level. This adds significance to the level as a potential barrier to further price declines.
On the flip side, if the price reverses its course and begins to climb, it may face resistance at 76.99, which is identified as an overlap resistance. This could potentially hinder the price’s upward movement.
A further rise in price might encounter the 2nd resistance at 78.77, another overlap resistance level. This level might act as a barrier to further upward movement.
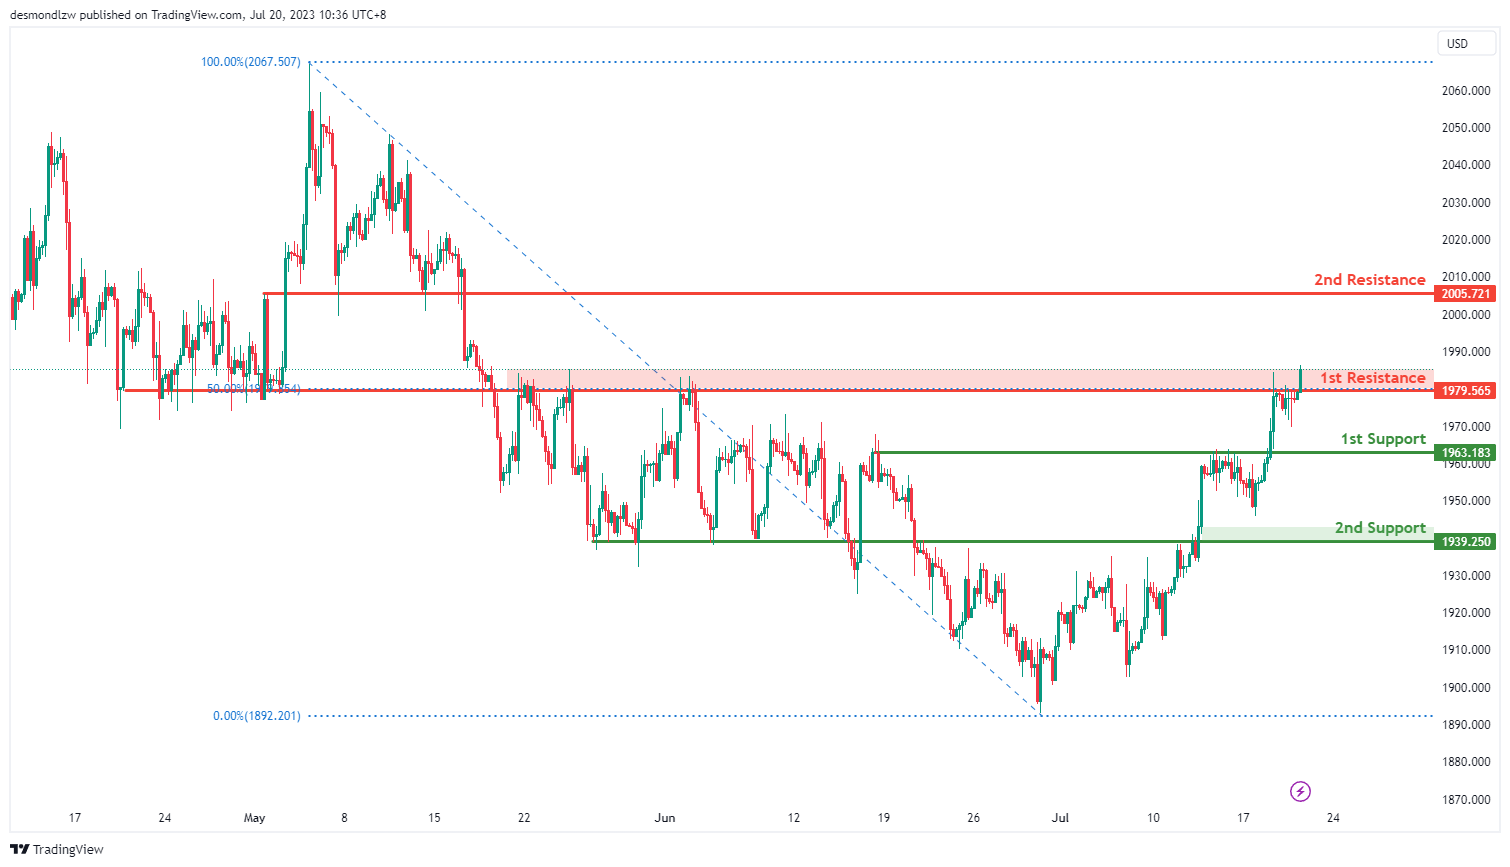
XAU/USD (GOLD):
The XAU/USD (Gold) chart currently demonstrates a bullish overall momentum, suggesting the potential for a bullish breakout of the 1st resistance level and a subsequent rise towards the 2nd resistance level.
The 1st support level at 1963.18 is identified as a pullback support, providing a foundation for potential price rebounds. Additionally, the 2nd support level at 1939.25 serves as another pullback support, further reinforcing the bullish outlook.
On the upside, the 1st resistance level at 1979.56 is characterized as an overlap resistance, indicating a potential barrier to upward price movement. However, if the price successfully breaks through this resistance level, it could lead to a bullish surge towards the 2nd resistance level at 2005.72, which is identified as a pullback resistance.


