
DXY:
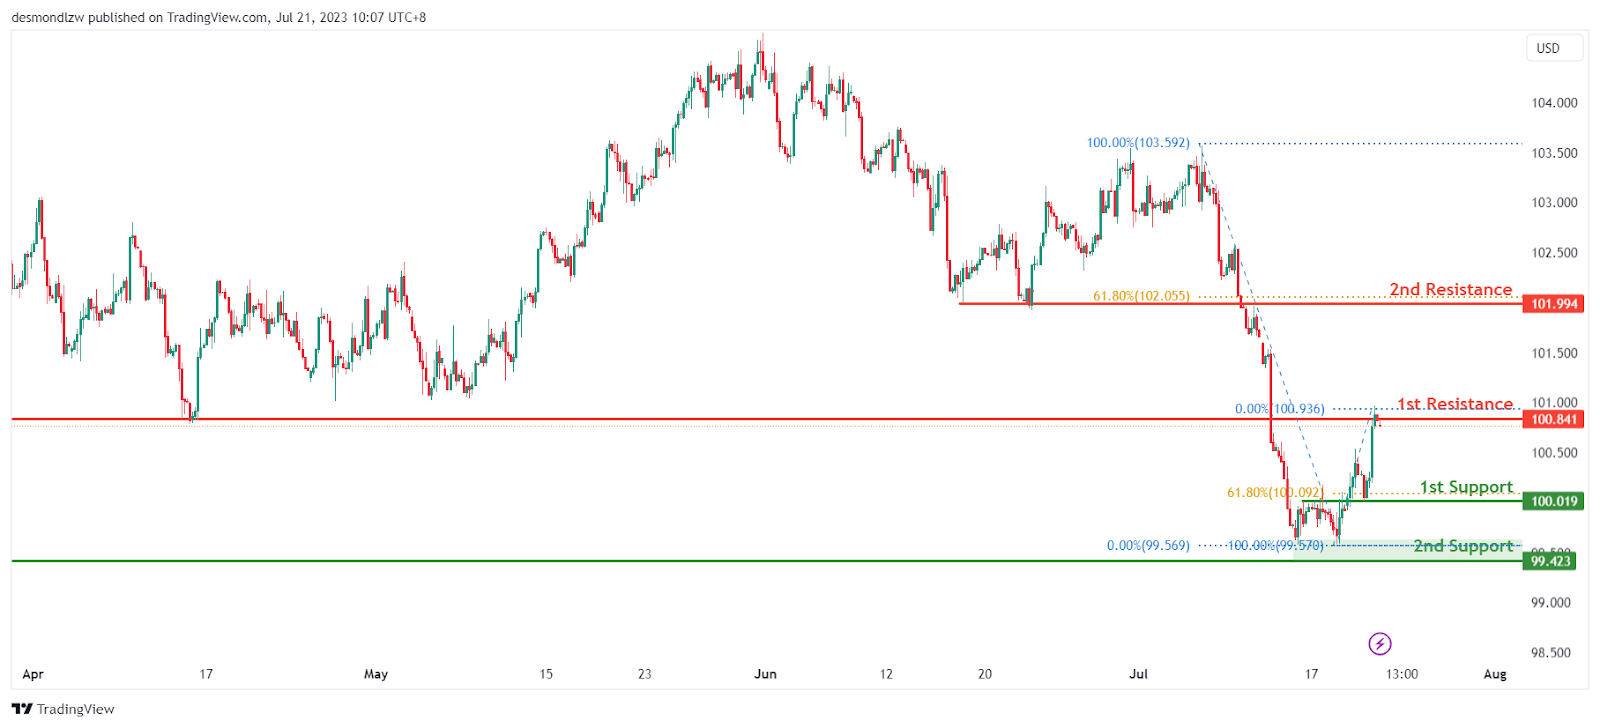
The chart for the DAY instrument indicates a prevailing bearish momentum, suggesting a potential continuation of the downward movement towards the 1st support level. This support level, located at 100.01, holds significance as an overlap support and aligns with the 61.80% Fibonacci retracement. Furthermore, the 2nd support level at 99.42 also acts as an overlap support.
On the other hand, if the price manages to reverse its bearish course, it could face resistance at the 1st resistance level of 100.84, which is identified as an overlap resistance. Additionally, the 2nd resistance level at 101.99 serves as a pullback resistance and coincides with the 61.80% Fibonacci retracement. These resistance levels may impede further upward movement.
EUR/USD:
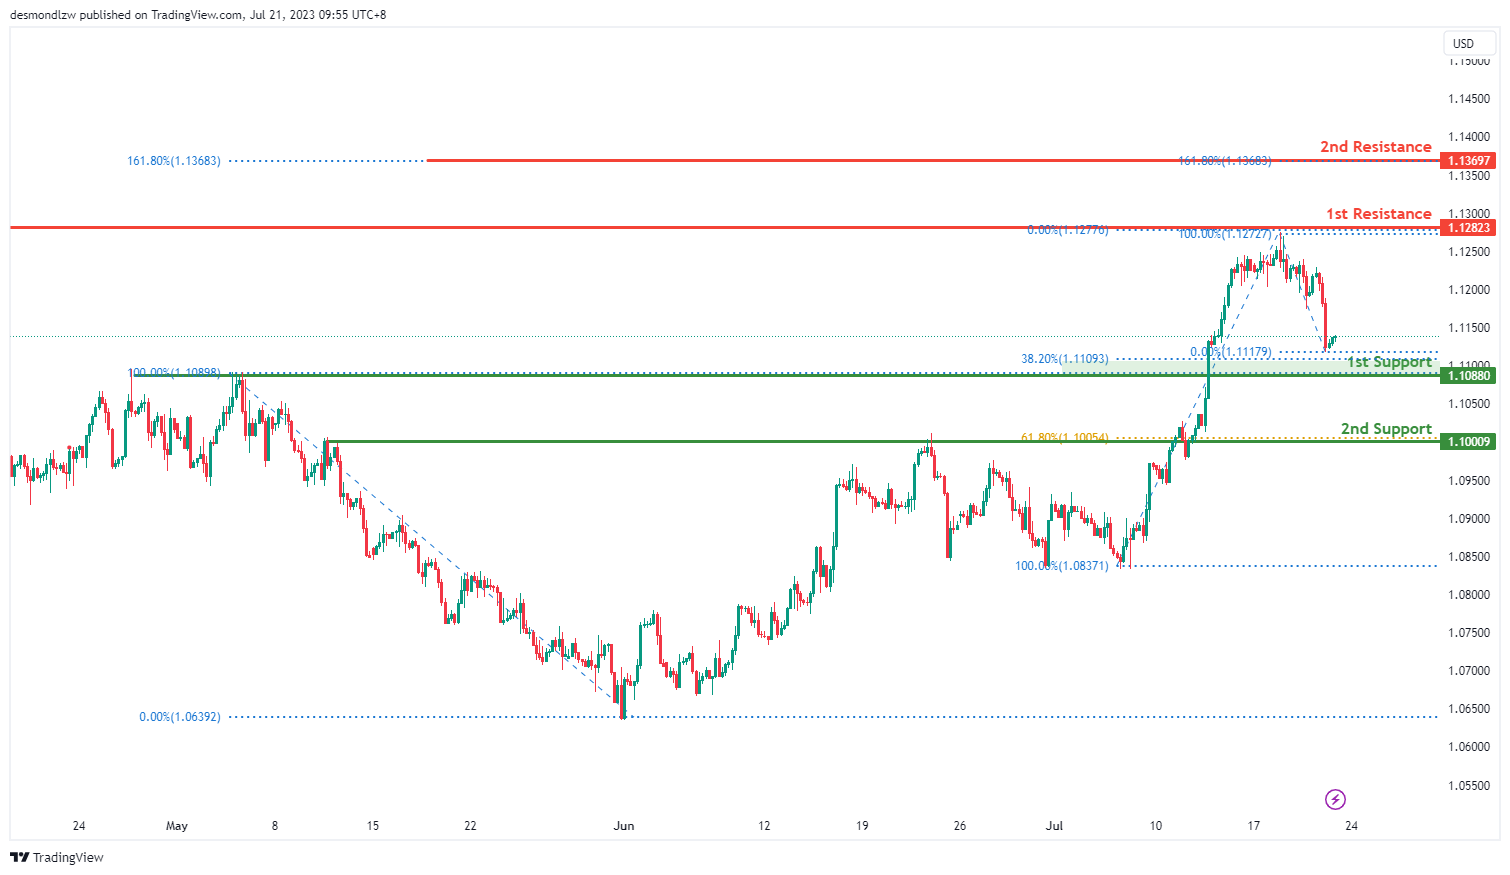
The EUR/USD chart shows a bullish overall momentum, indicating a potential continuation of the upward movement towards the 1st resistance level. The 1st support level at 1.1088 is considered a pullback support, coinciding with the 38.20% Fibonacci retracement. Additionally, the 2nd support level at 1.1000 acts as another pullback support, aligning with the 61.80% Fibonacci retracement.
On the upside, the 1st resistance level at 1.1282 represents a significant swing high resistance. Furthermore, the 2nd resistance level at 1.1369 corresponds to the 161.80% Fibonacci extension, adding to its significance.
EUR/JPY:
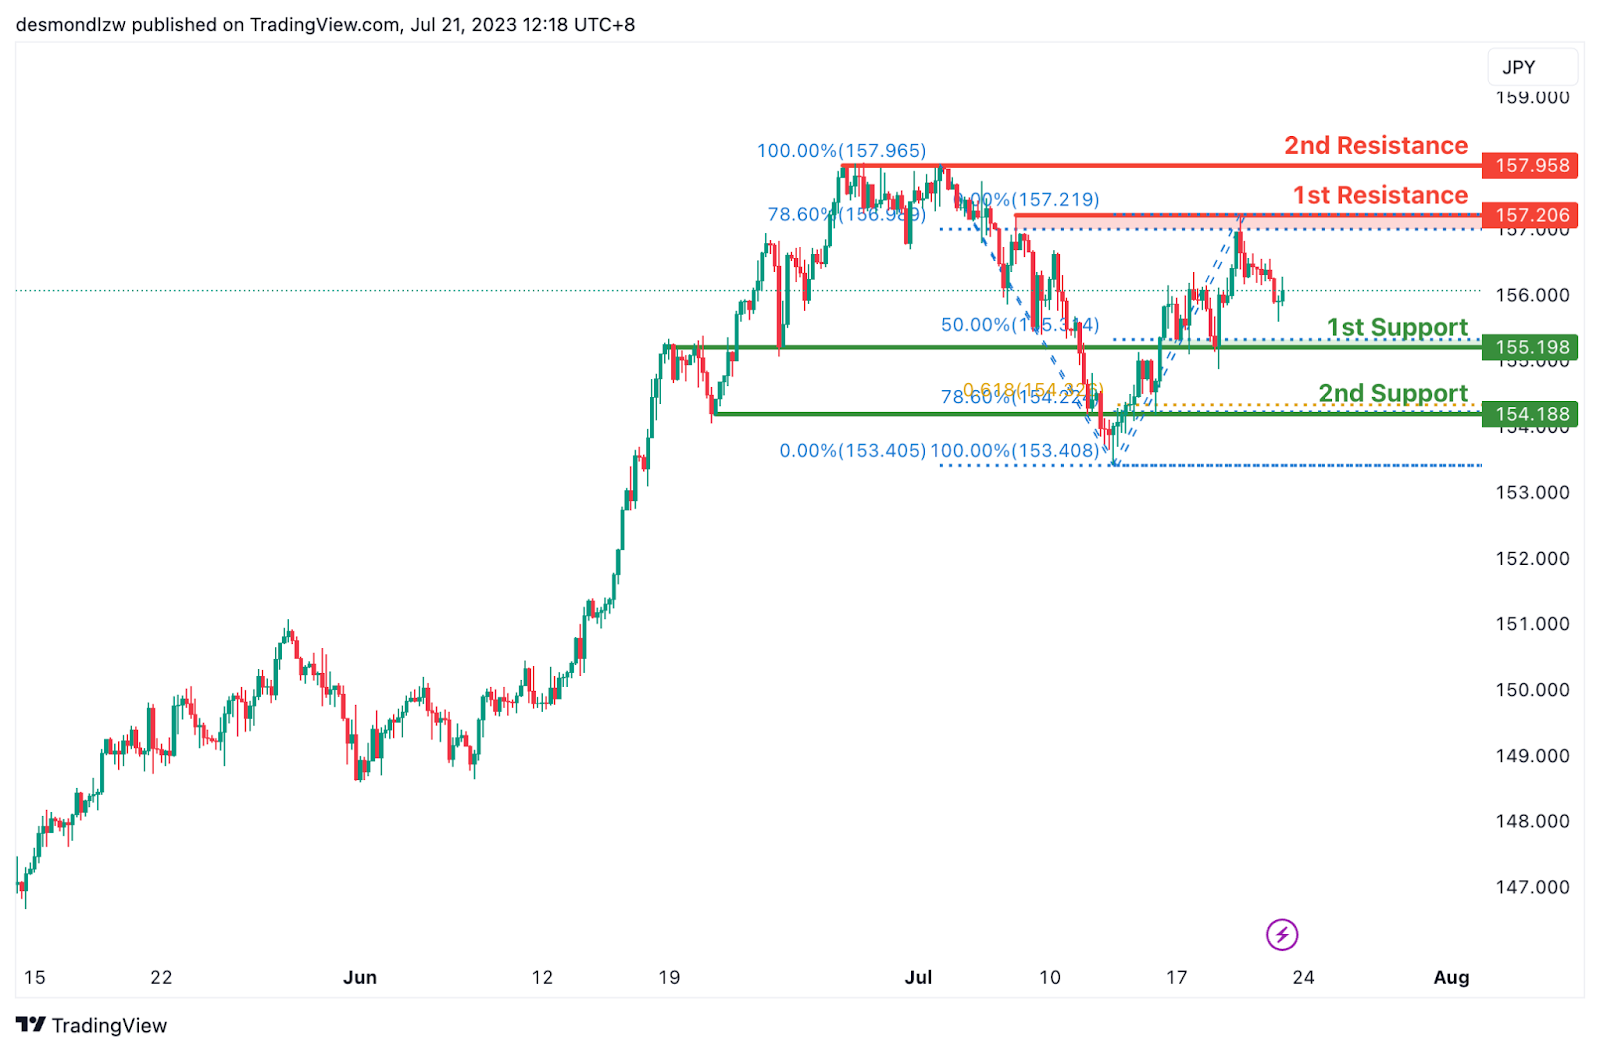
The EUR/JPY chart displays a bearish momentum, suggesting a potential continuation of the downward movement towards the 1st support level at 155.19. This support level aligns with the 50% Fibonacci retracement and serves as an overlap support.
If the price continues to decline, the 2nd support at 154.18 becomes significant as it aligns with the 78.60% Fibonacci retracement and the 61.80% Fibonacci projection, indicating Fibonacci confluence.
On the upside, the 1st resistance at 157.20 is a notable multi-swing high resistance, coinciding with the 78.60% Fibonacci retracement.
Furthermore, the 2nd resistance at 157.95 also acts as a multi-swing high resistance. These resistance levels could potentially impede the price’s upward movement.
EUR/GBP:
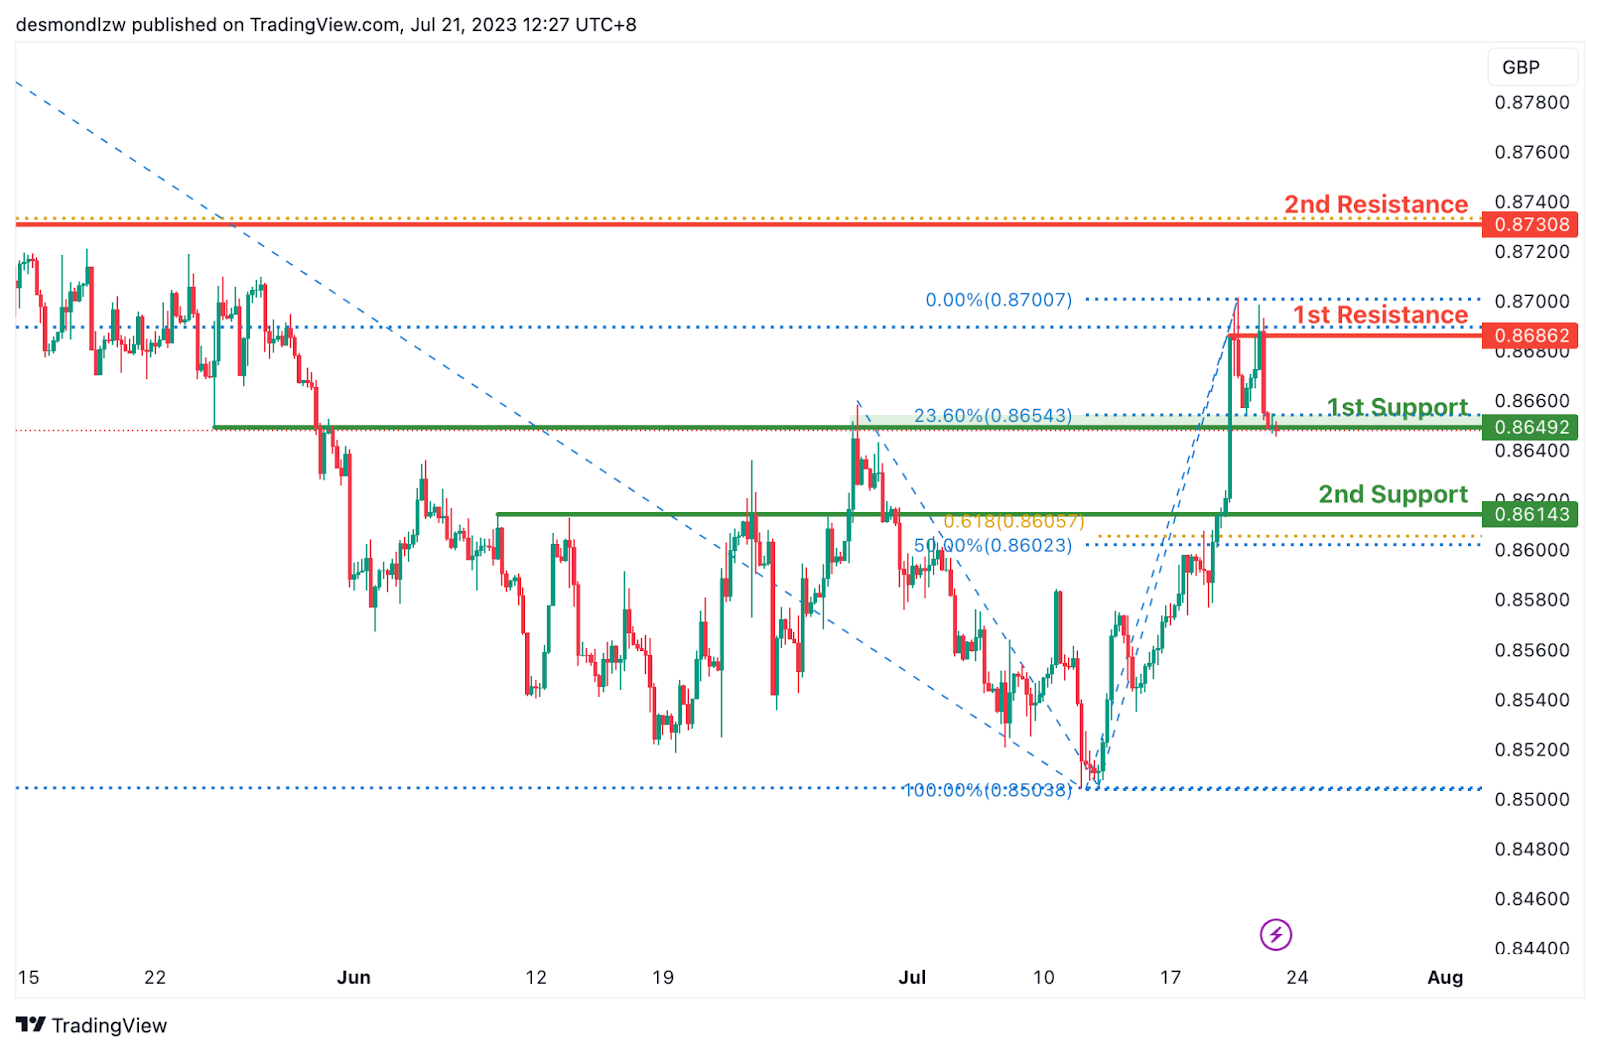
The EUR/GBP chart demonstrates a bullish momentum, suggesting the potential for a bullish bounce off the 1st support level and a subsequent move towards the 1st resistance level.
The 1st support at 0.8649 acts as a pullback support, coinciding with the 23.60% Fibonacci retracement. Additionally, the 2nd support at 0.8614 serves as an overlap support, aligning with the 50% Fibonacci retracement and the 61.80% Fibonacci projection, indicating Fibonacci confluence.
On the upside, the 1st resistance at 0.8686 represents a multi-swing high resistance, coinciding with the 50% Fibonacci retracement.
Furthermore, the 2nd resistance at 0.8730 acts as an overlap resistance, aligned with the 61.80% Fibonacci retracement. These resistance levels may impede the price’s upward movement.
GBP/USD:
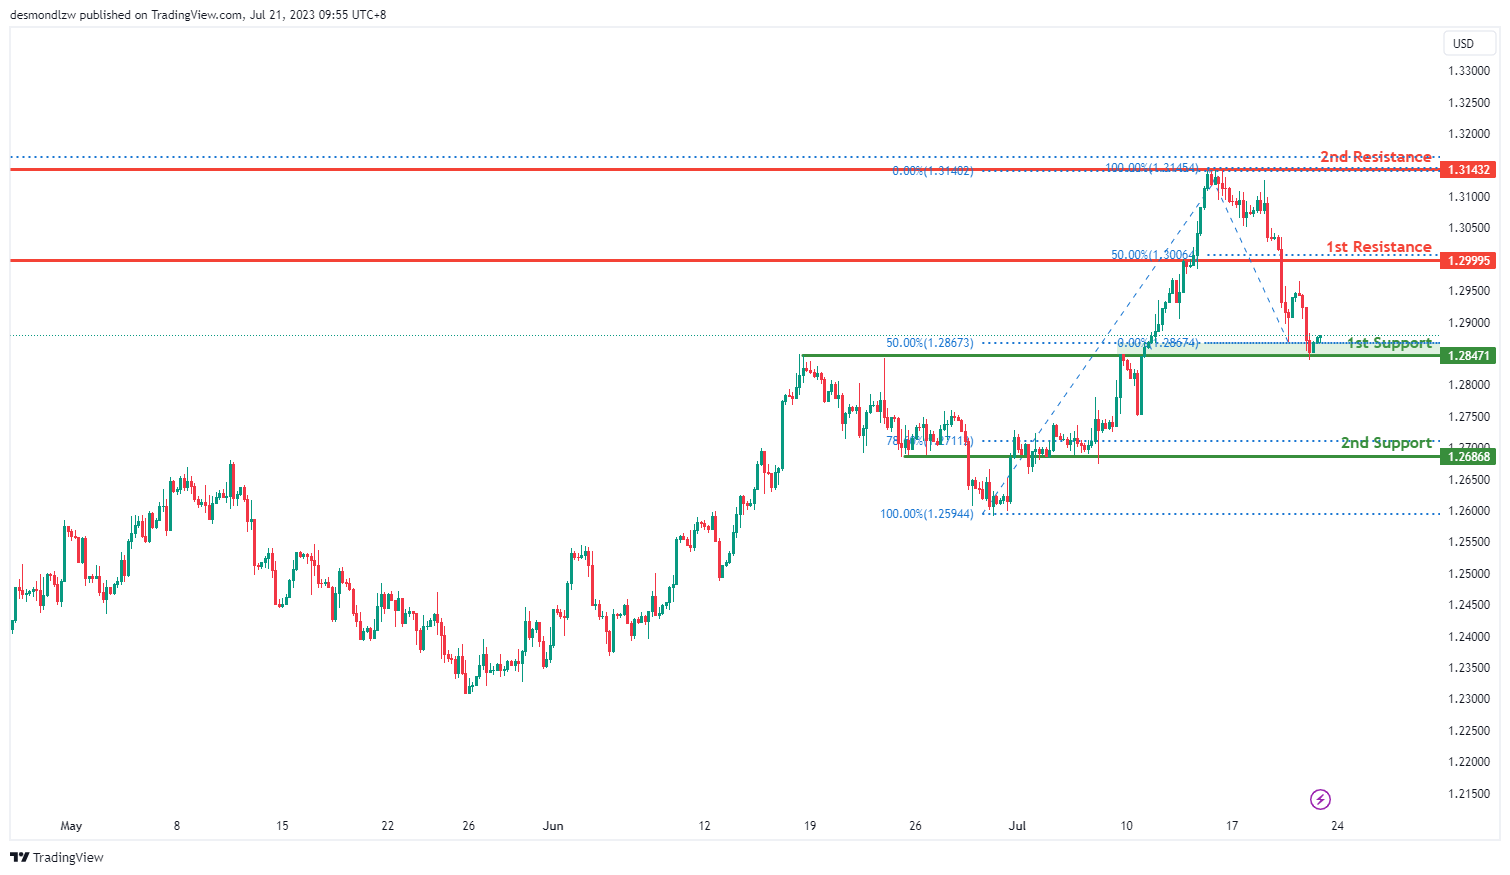
The GBP/USD chart indicates a bullish overall momentum, suggesting a potential continuation of the upward movement towards the 1st resistance level. The 1st support level at 1.2847 is an overlap support, coinciding with the 50% Fibonacci retracement, while the 2nd support level at 1.2686 is also an overlap support, aligning with the 78.60% Fibonacci retracement.
On the upside, the 1st resistance level at 1.2999 is considered a pullback resistance, corresponding to the 50% Fibonacci retracement. Additionally, the 2nd resistance level at 1.3143 is a multi-swing high resistance. These levels may act as barriers to the price’s upward movement.
GBP/JPY:
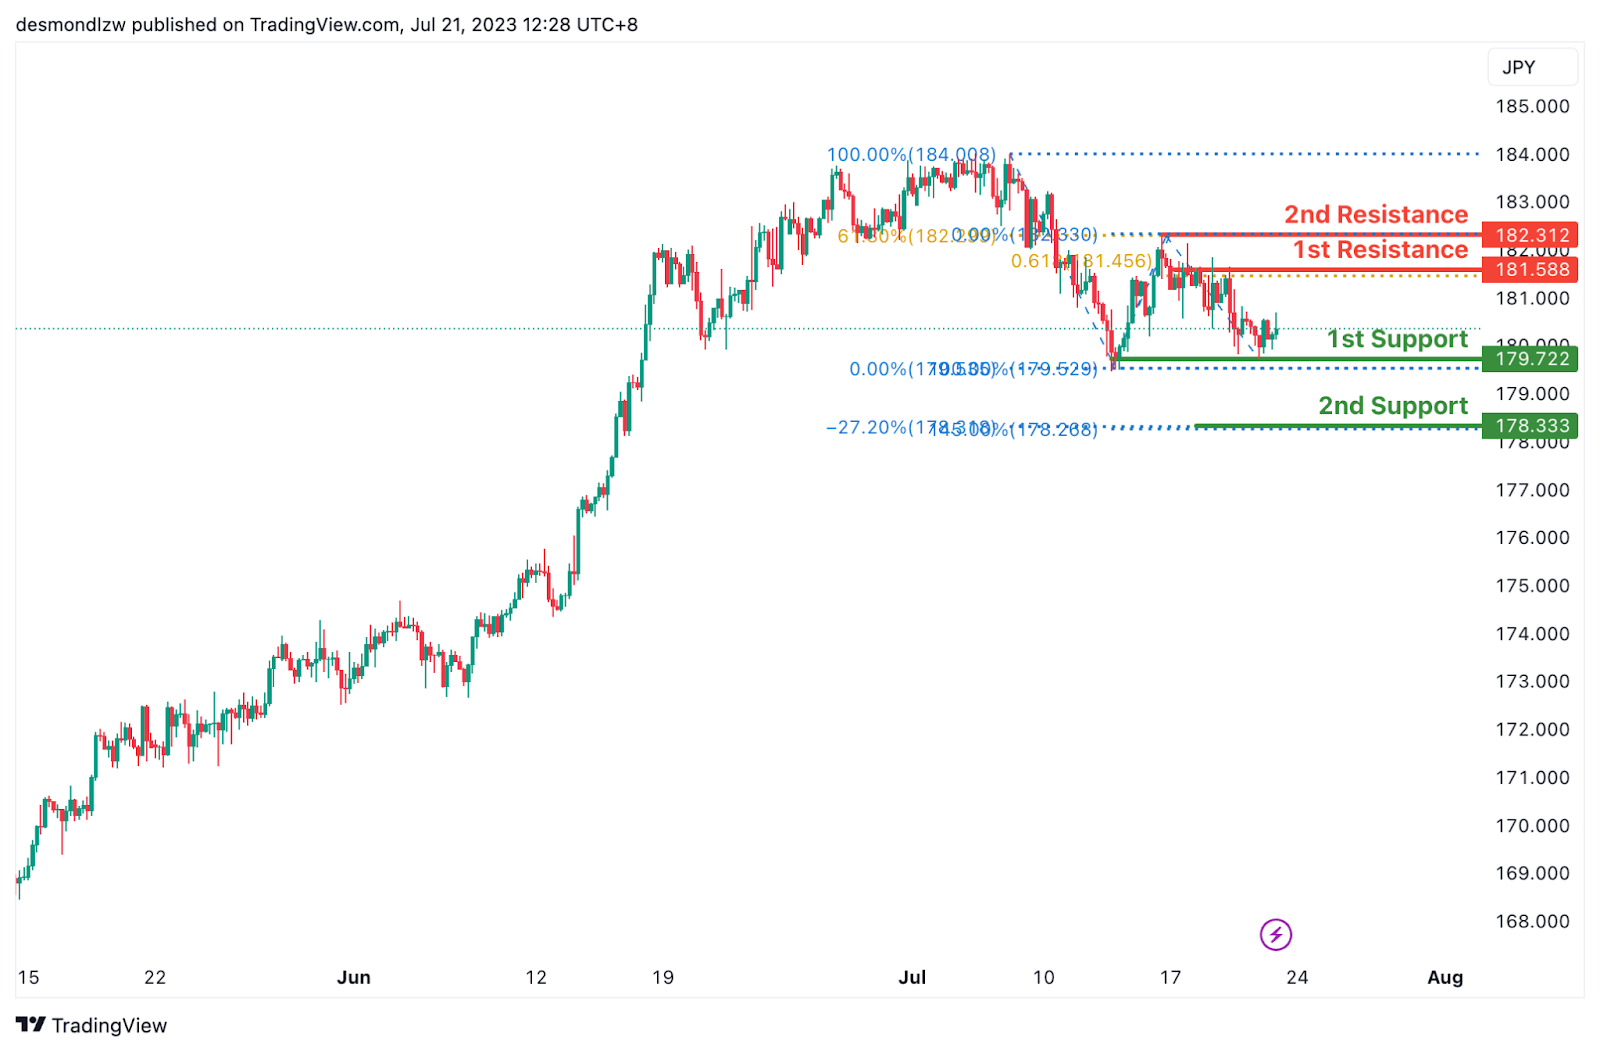
The GBP/JPY chart exhibits a bullish momentum, suggesting the potential for a bullish bounce off the 1st support level and a subsequent move towards the 1st resistance level.
The 1st support at 179.72 is a multi-swing low support, indicating its significance in providing potential price stability. Additionally, the 2nd support at 178.33 aligns with the -27% Fibonacci expansion and the 145.00% Fibonacci extension, highlighting Fibonacci confluence and reinforcing its role as a support level.
On the upside, the 1st resistance at 181.58 represents a multi-swing high resistance, coinciding with the 61.80% Fibonacci projection. Furthermore, the 2nd resistance at 182.31 acts as a swing high resistance, aligning with the 61.80% Fibonacci retracement. These resistance levels may pose challenges to the price’s upward movement.
USD/CHF:
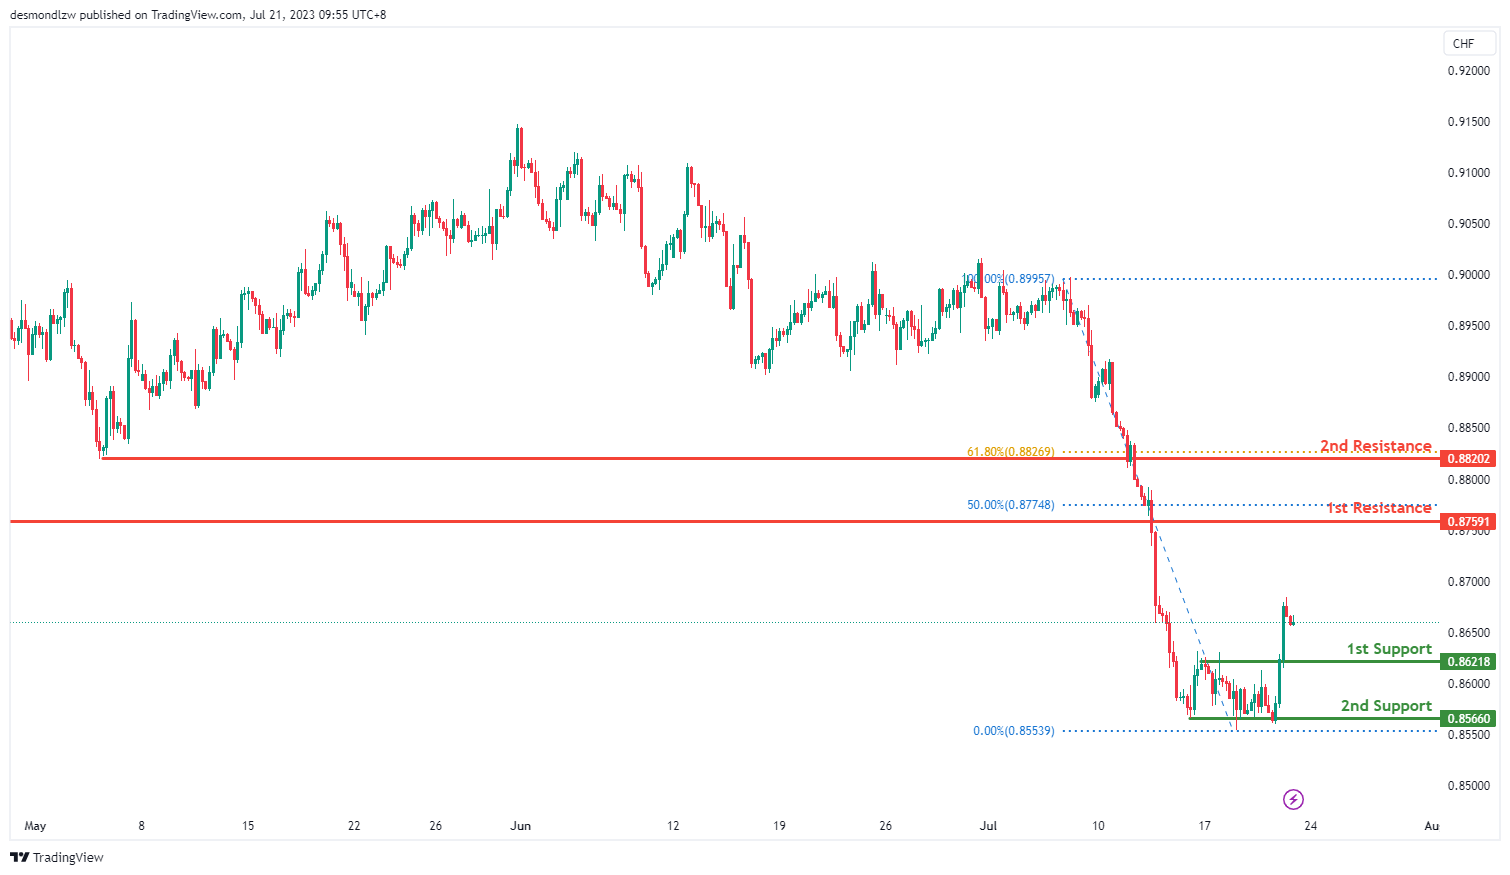
.The USD/CHF chart demonstrates a bullish overall momentum, indicating a potential continuation of the upward movement towards the 1st resistance level. The 1st support at 0.8621 serves as a pullback support, while the 2nd support at 0.8566 is identified as a multi-swing low support.
On the upside, the 1st resistance level at 0.8759 is considered a pullback resistance, coinciding with the 50% Fibonacci retracement. Additionally, the 2nd resistance level at 0.8820 is a pullback resistance, aligning with the 61.80% Fibonacci retracement. These resistance levels may impede the price’s upward movement.
USD/JPY:
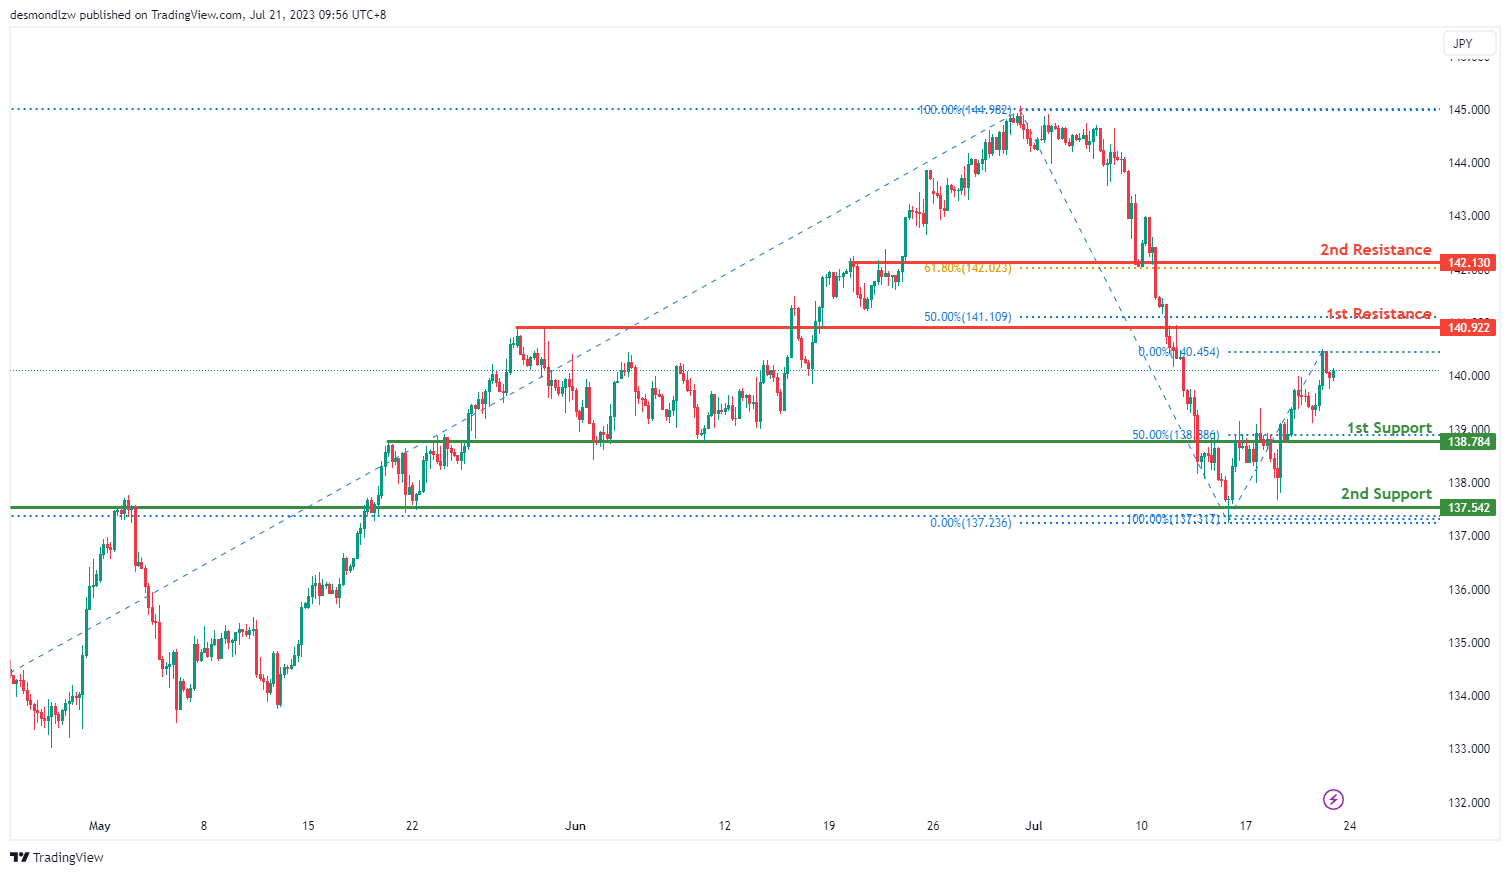
The USD/JPY chart demonstrates a bullish overall momentum, indicating a potential continuation of the upward movement towards the 1st resistance level. The 1st support at 138.7800 is recognized as an overlap support, coinciding with the 50% Fibonacci retracement. Additionally, the 2nd support at 13754.0000 acts as another overlap support.
On the upside, the 1st resistance level at 140.9200 is identified as an overlap resistance, aligning with the 61.80% Fibonacci retracement. Furthermore, the 2nd resistance level at 142.1300 serves as a pullback resistance, coinciding with the 50% Fibonacci retracement. These resistance levels may impede the price’s upward movement.
USD/CAD:
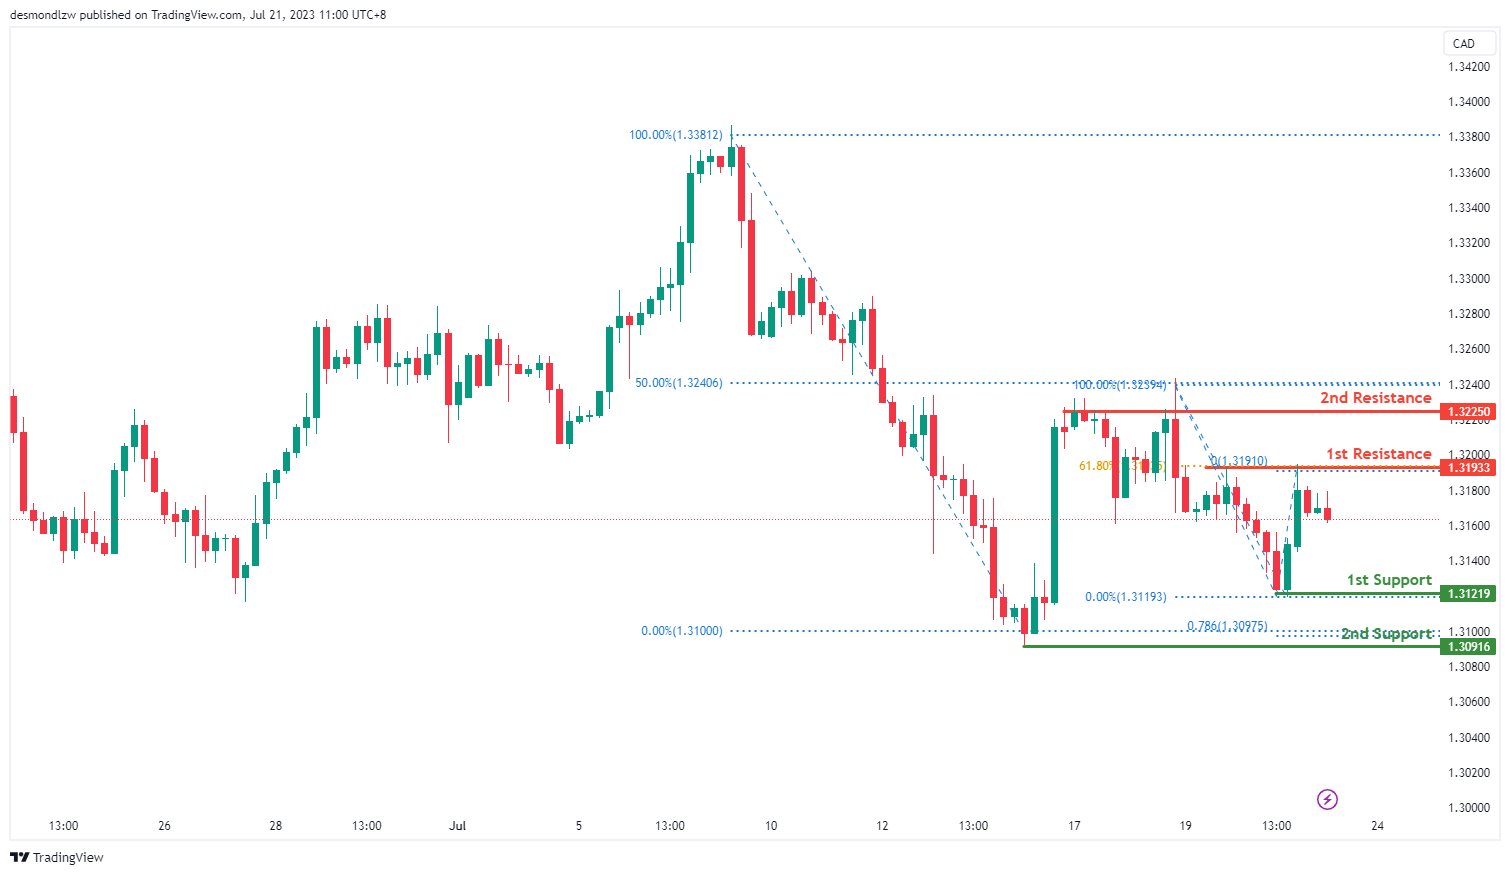
The USDCAD chart currently exhibits a bearish overall momentum, suggesting a potential continuation of the downward movement towards the 1st support level. The 1st support at 1.3121 is identified as a swing low support, coinciding with the 50% Fibonacci retracement. Additionally, the 2nd support at 1.3091 acts as a swing low support, aligning with the 78.60% Fibonacci projection.
On the upside, the 1st resistance level at 1.3193 is recognized as a swing high resistance, corresponding to the 61.80% Fibonacci retracement. Furthermore, the 2nd resistance level at 1.3225 serves as a multi-swing high resistance, coinciding with the 50% Fibonacci retracement. These resistance levels may impede the price’s upward movement.
AUD/USD:
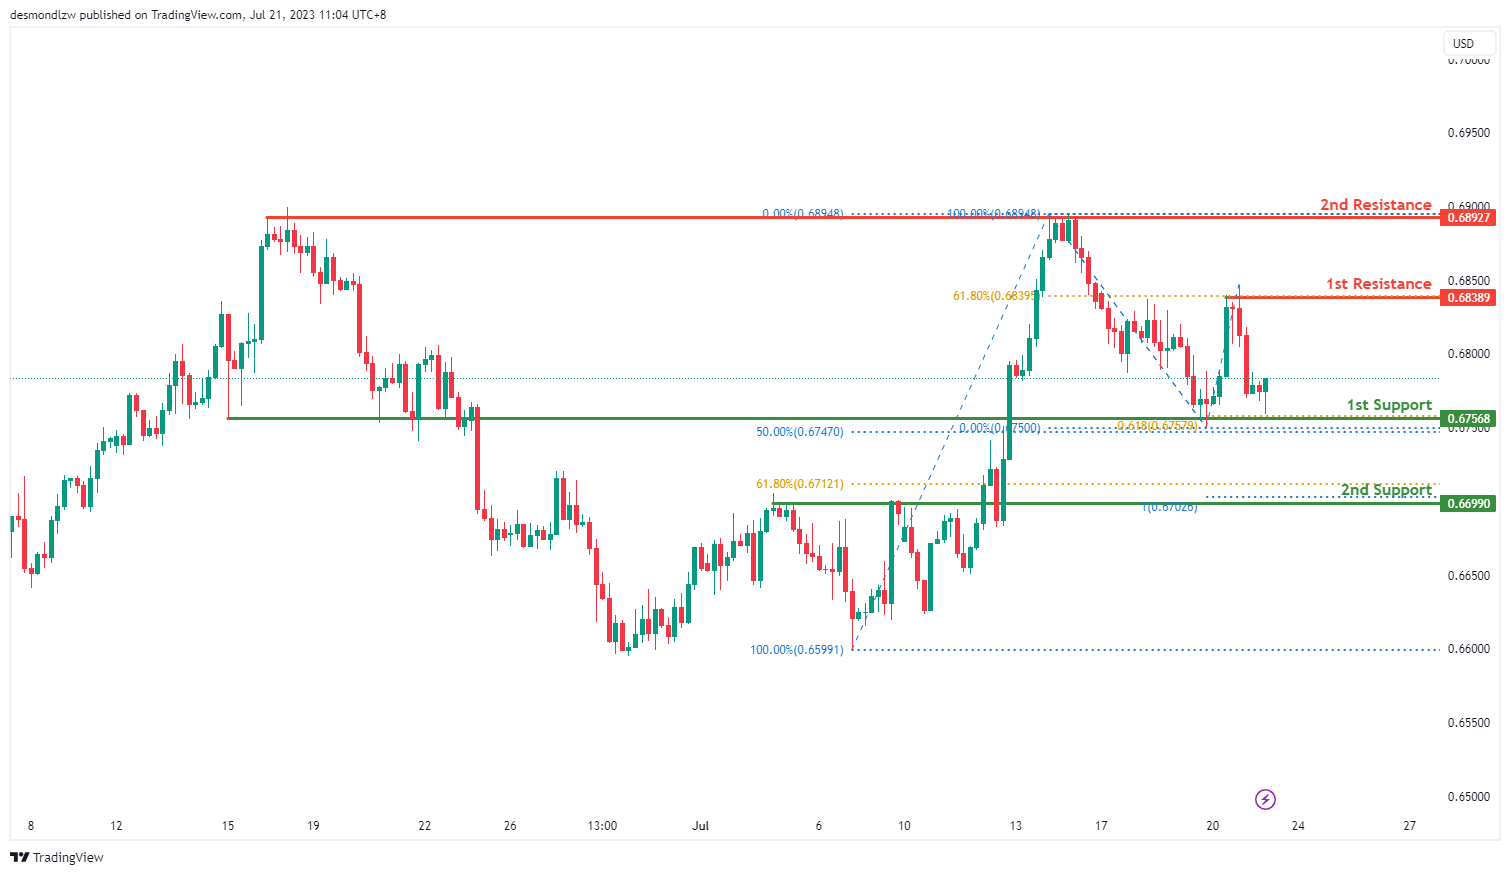
The AUD/USD chart currently demonstrates a bullish overall momentum, indicating a potential continuation of the upward movement towards the 1st resistance level. The 1st support level at 0.6756 is identified as an overlap support, showing Fibonacci confluence with the 50% and 61.80% Fibonacci retracement levels. Additionally, the 2nd support level at 0.6699 acts as a pullback support, aligning with the 61.80% Fibonacci retracement.
On the upside, the 1st resistance level at 0.6838 represents a swing high resistance, coinciding with the 61.80% Fibonacci retracement. Furthermore, the 2nd resistance level at 0.6892 serves as a multi-swing high resistance. These resistance levels may impede the price’s upward movement.
NZD/USD
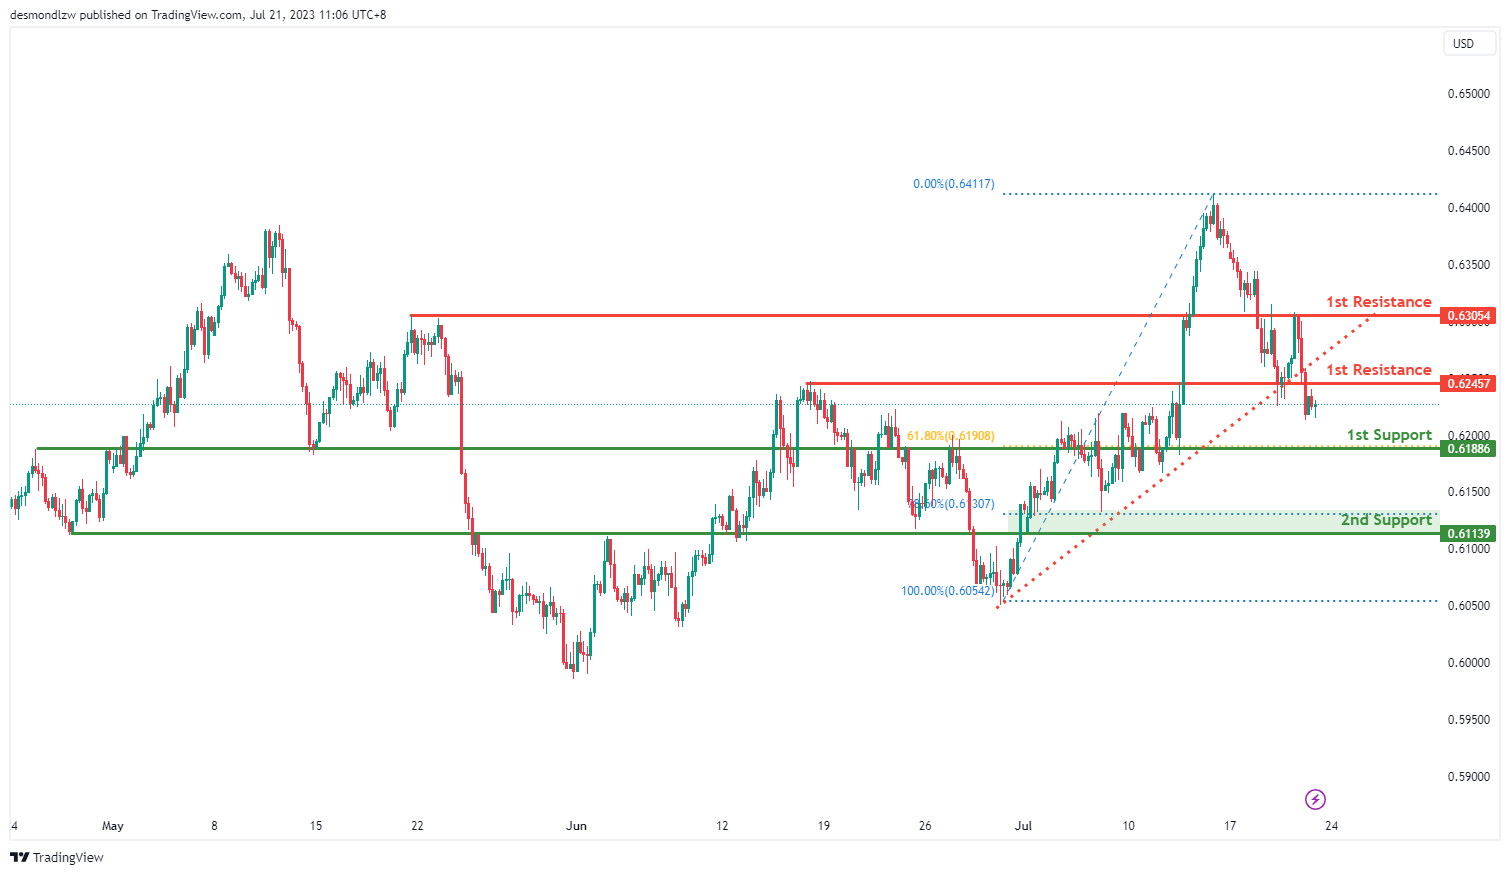
The NZD/USD pair is showing a bearish trend after breaking below an ascending support line, indicating a possible continuation of the bearish move.
In the event of a further drop, the first support is anticipated at 0.6189, an overlap support coinciding with the 61.8% Fibonacci retracement level, providing a potential floor for the price. Should the price drop beyond this point, the second support at 0.6114, another overlap support that coincides with the 78.6% Fibonacci retracement level, might act as a strong barrier against further price fall.
On the other hand, if the bearish momentum reverses, the price could face resistance at 0.6246, an overlap resistance level. If the price surges and overcomes this level, the next hurdle could be the second resistance level at 0.6305, another overlap resistance. These resistance levels might potentially hinder the price’s upward movement.
DJ30:
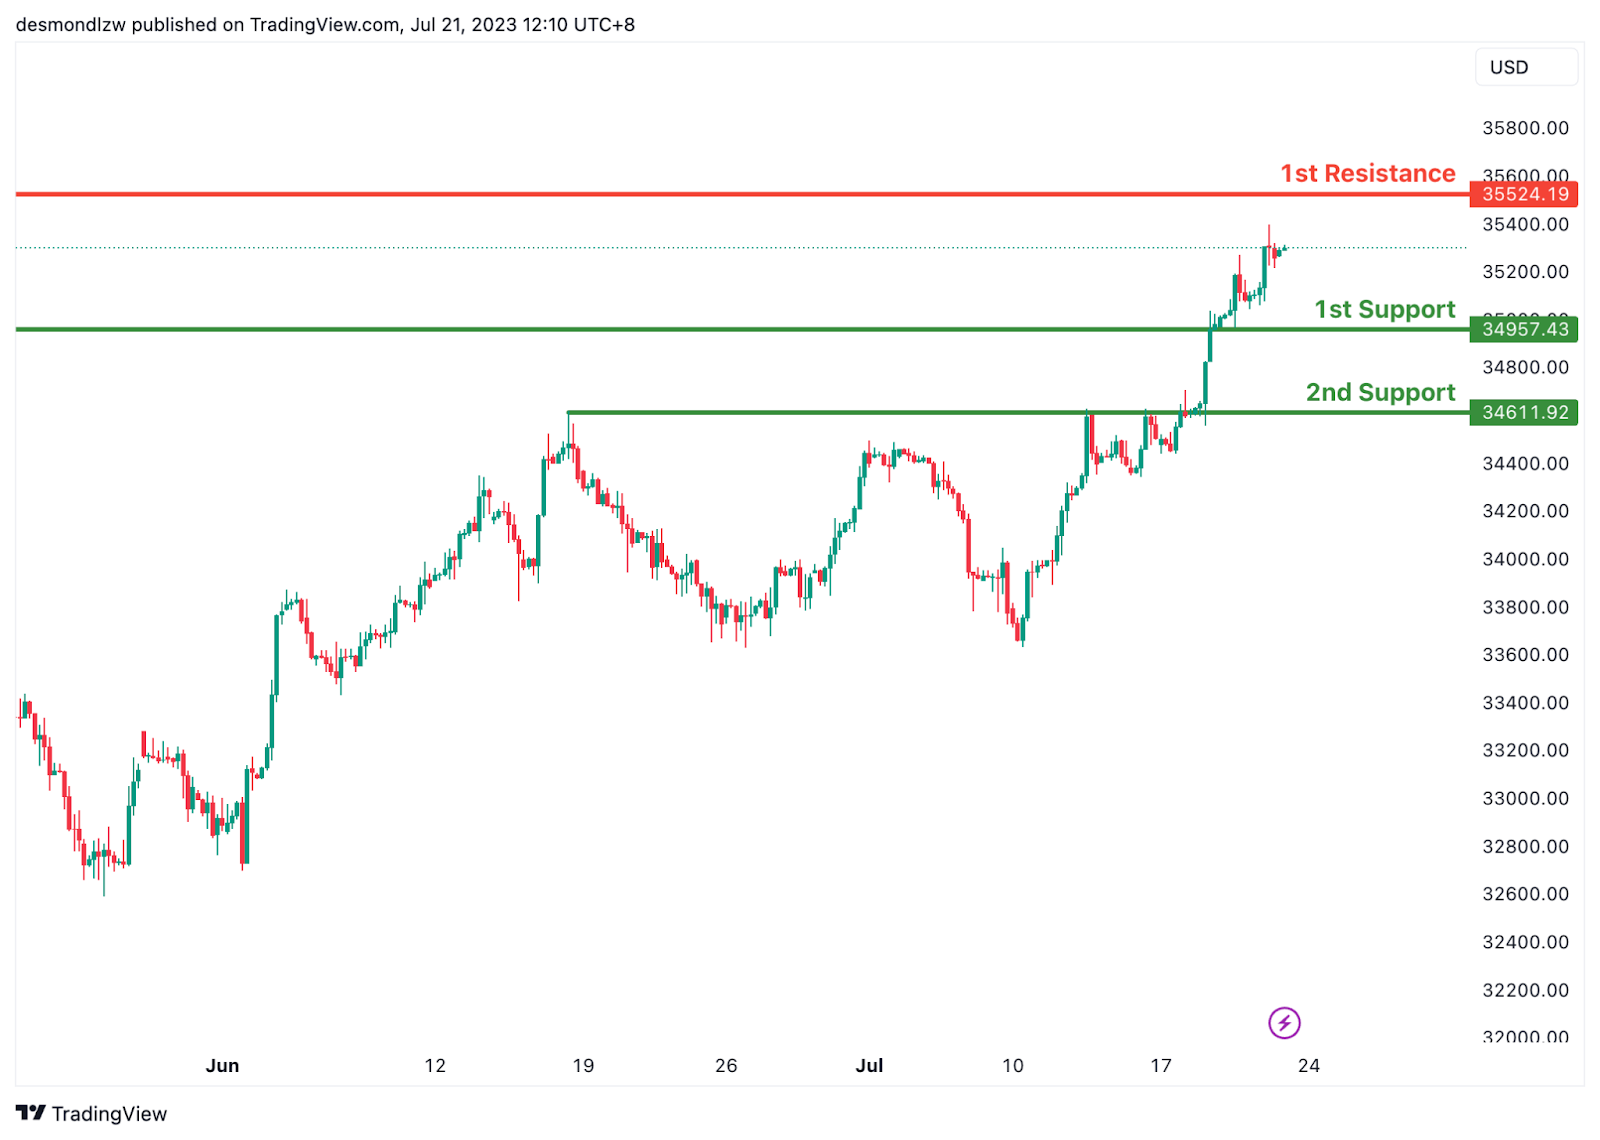
The DJ30 (Dow Jones Industrial Average) is exhibiting a bullish trend, suggesting a potential continuation of this upward momentum towards the first resistance level.
If the price declines, the first support is expected at 34957.43, which acts as a pullback support. If the price continues to fall further, the second support level at 34611.92 (another pullback support) could offer a strong barrier to prevent further decline.
On the other hand, if the bullish trend persists, the price could face resistance at 35524.19, which is a swing high resistance level. If the price manages to surpass this level, it might suggest further bullish momentum.
GER30:
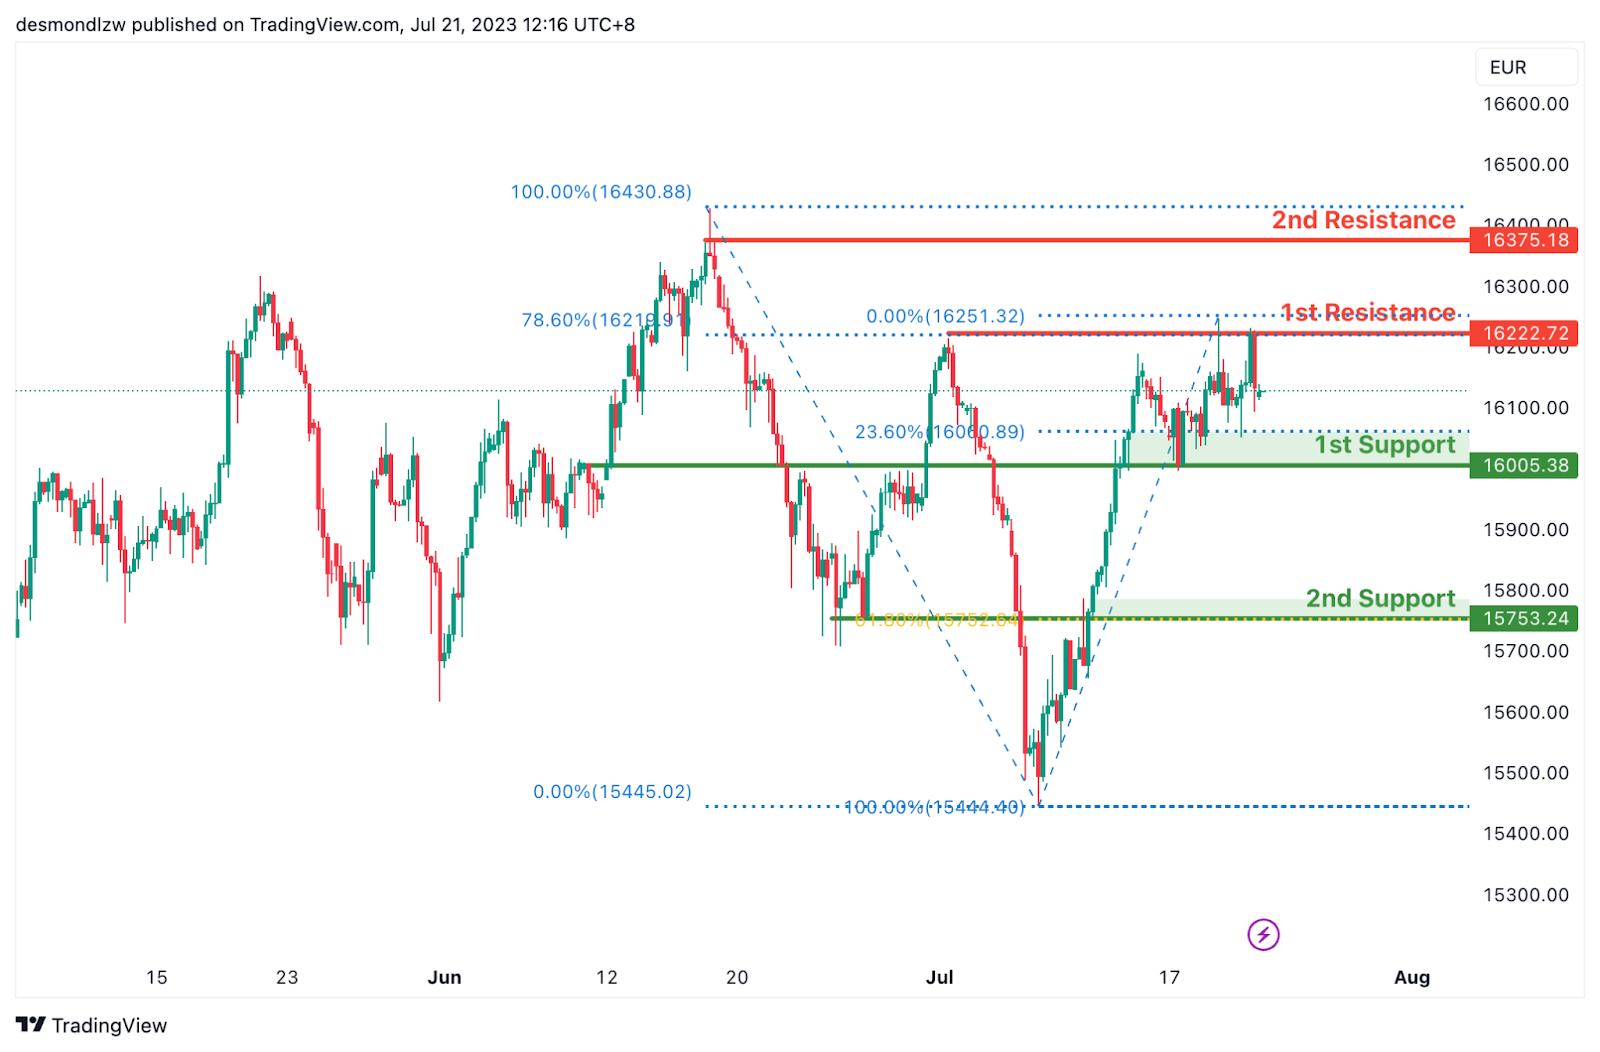
The GER30 (DAX) chart currently indicates a bearish overall momentum. There is a potential for a bearish continuation towards the 1st support level.
The 1st support level at 16005.38 is identified as an overlap support and coincides with the 23.60% Fibonacci Retracement level. Additionally, the 2nd support level at 15753.24 acts as an overlap support and aligns with the 61.80% Fibonacci Projection level.
On the upside, the 1st resistance level at 16222.72 represents a multi-swing high resistance and coincides with the 78.60% Fibonacci Retracement level. Furthermore, the 2nd resistance level at 16375.18 is identified as a swing high resistance. These resistance levels may limit further price advancement.
US500
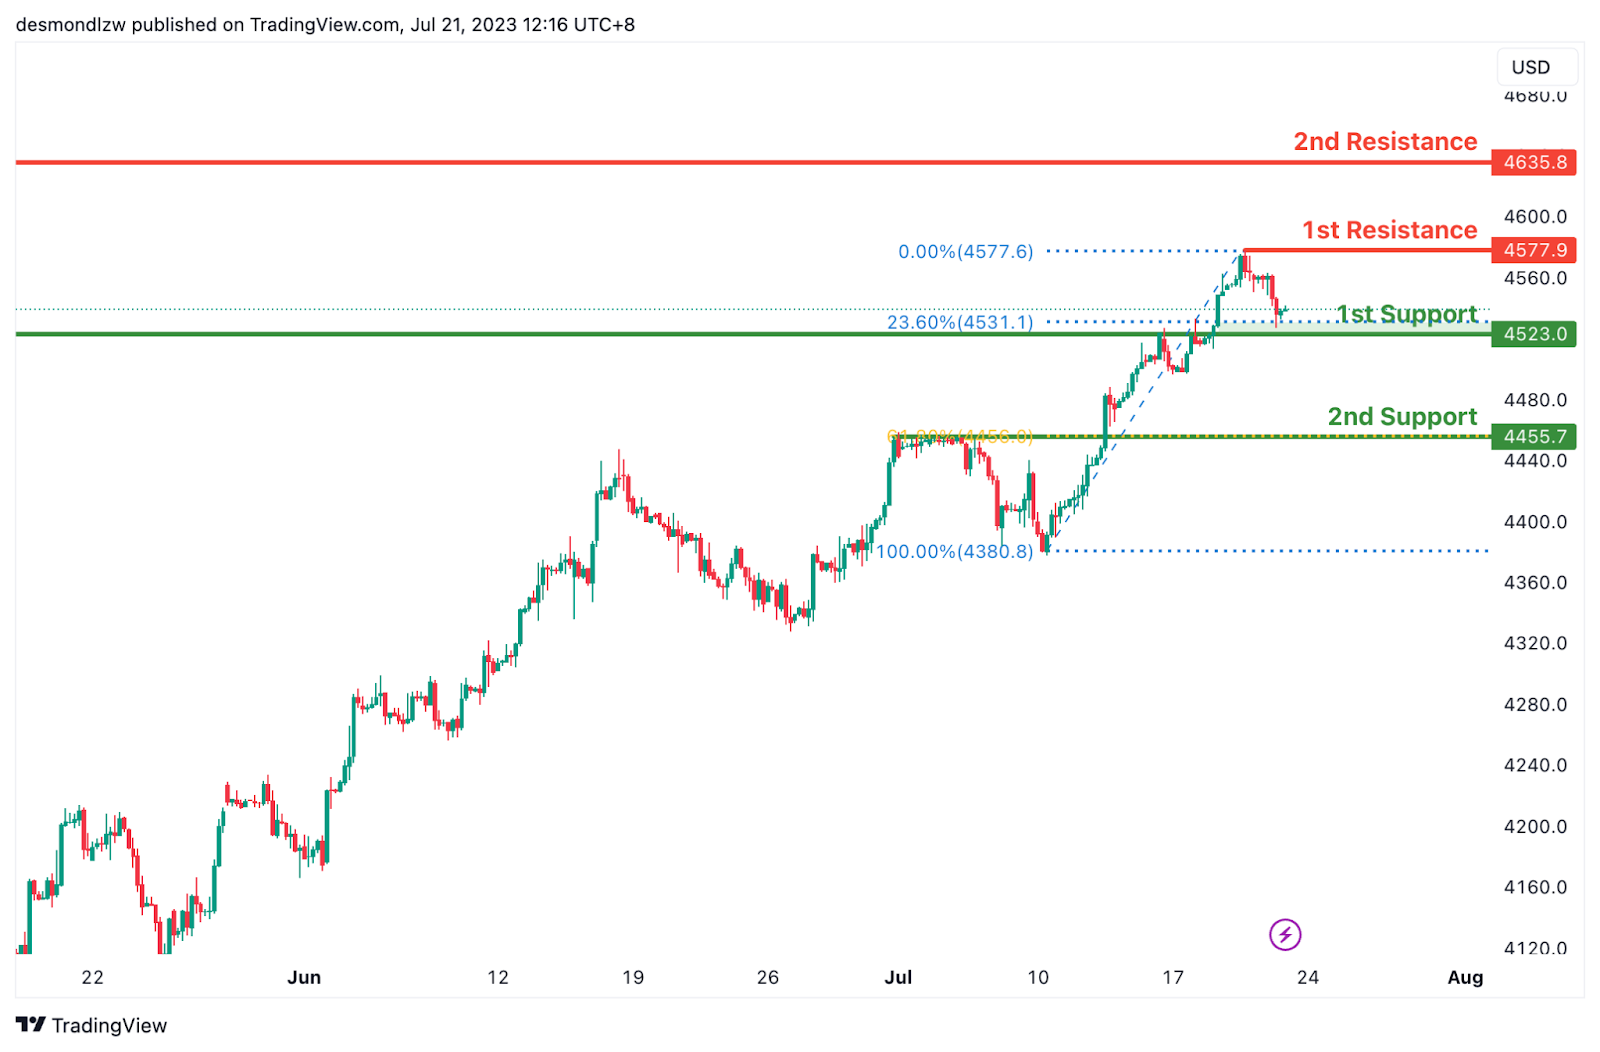
The US500 (S&P 500) is showing a bullish momentum. As such, there’s potential for a bullish bounce off the first support level, followed by an upward trend towards the first resistance level.
The 1st support level at 4523.0 is identified as a pullback support and coincides with the 23.60% Fibonacci Retracement level. Additionally, the 2nd support level at 4455.7 acts as an overlap support and aligns with the 61.80% Fibonacci Retracement level.
On the upside, the 1st resistance level at 4577.9 represents a swing high resistance. Furthermore, the 2nd resistance level at 4635.8 is also identified as a swing high resistance. These resistance levels may impede further price advancement.
BTC/USD:
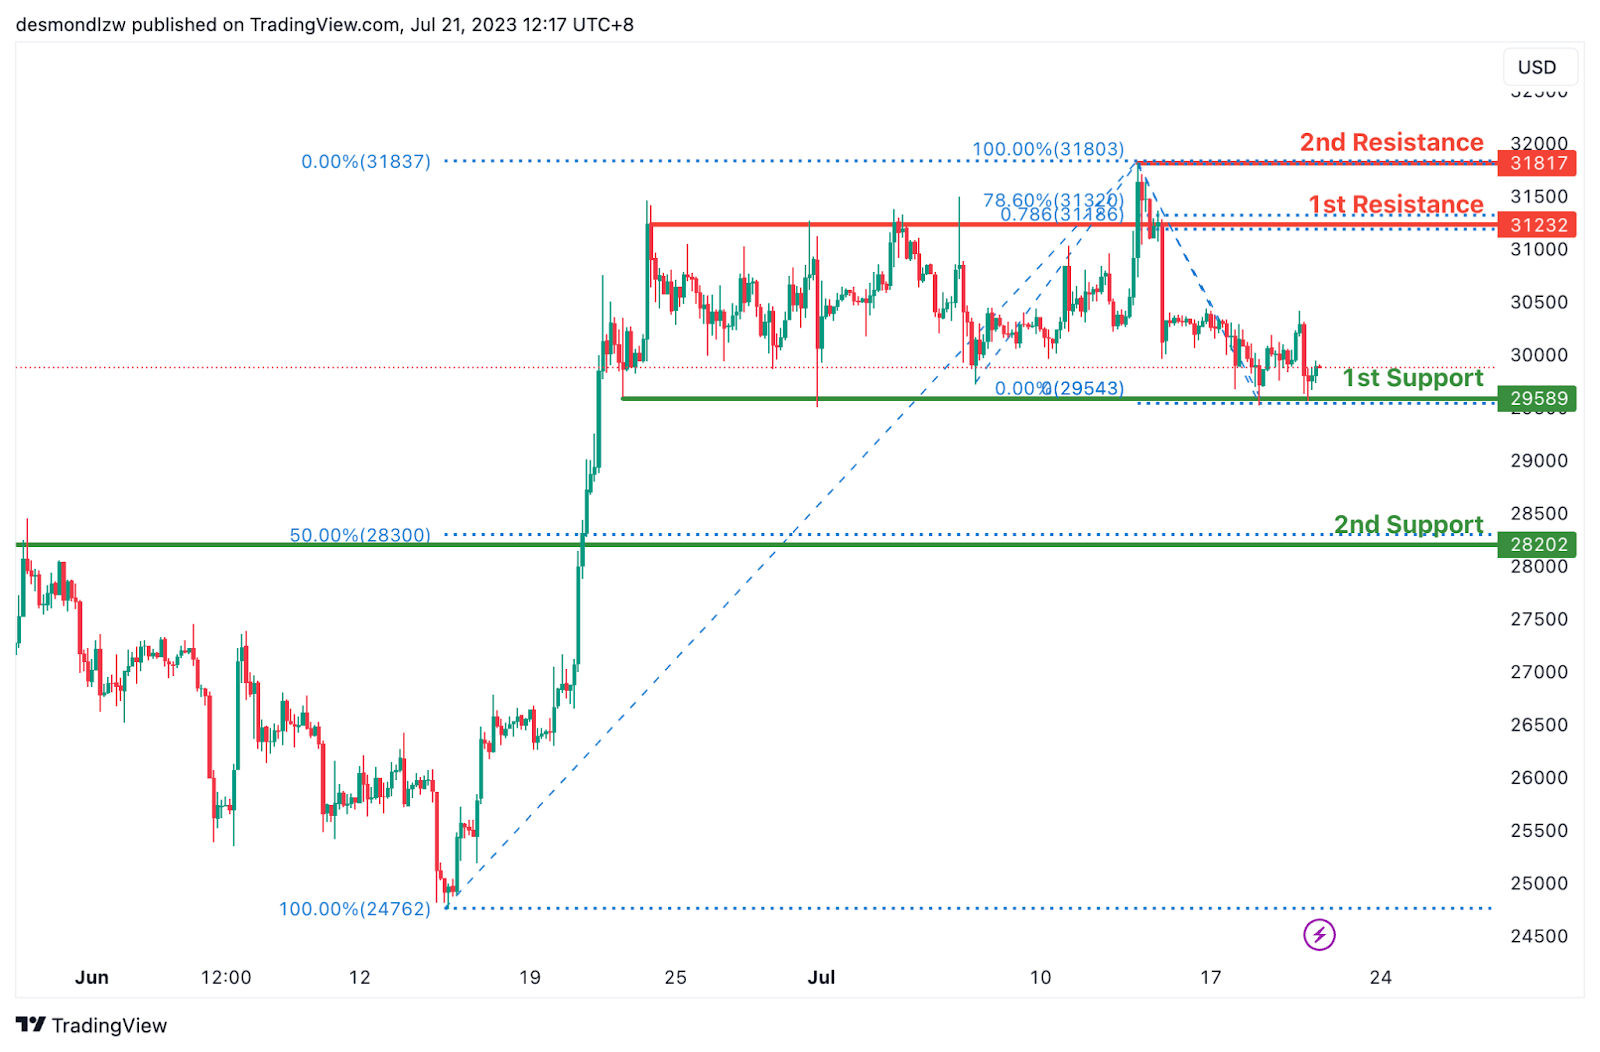
The BTC/USD chart is showing a bullish momentum. As such, there’s potential for a bullish bounce off the first support level, followed by an upward trend towards the first resistance level.
The first support level at 29,589 is identified as a multi-swing low support, indicating its significance in providing potential price stability. Additionally, the second support level at 28,202 is considered a pullback support, coinciding with the 50% Fibonacci Retracement.
On the upside, the first resistance level at 31,232 represents an overlap resistance and exhibits Fibonacci confluence with the 78.60% Fibonacci Projection and 78.60% Fibonacci Retracement, suggesting its importance as a potential barrier. Furthermore, the second resistance level at 31,817 is recognized as a swing high resistance.
ETH/USD:
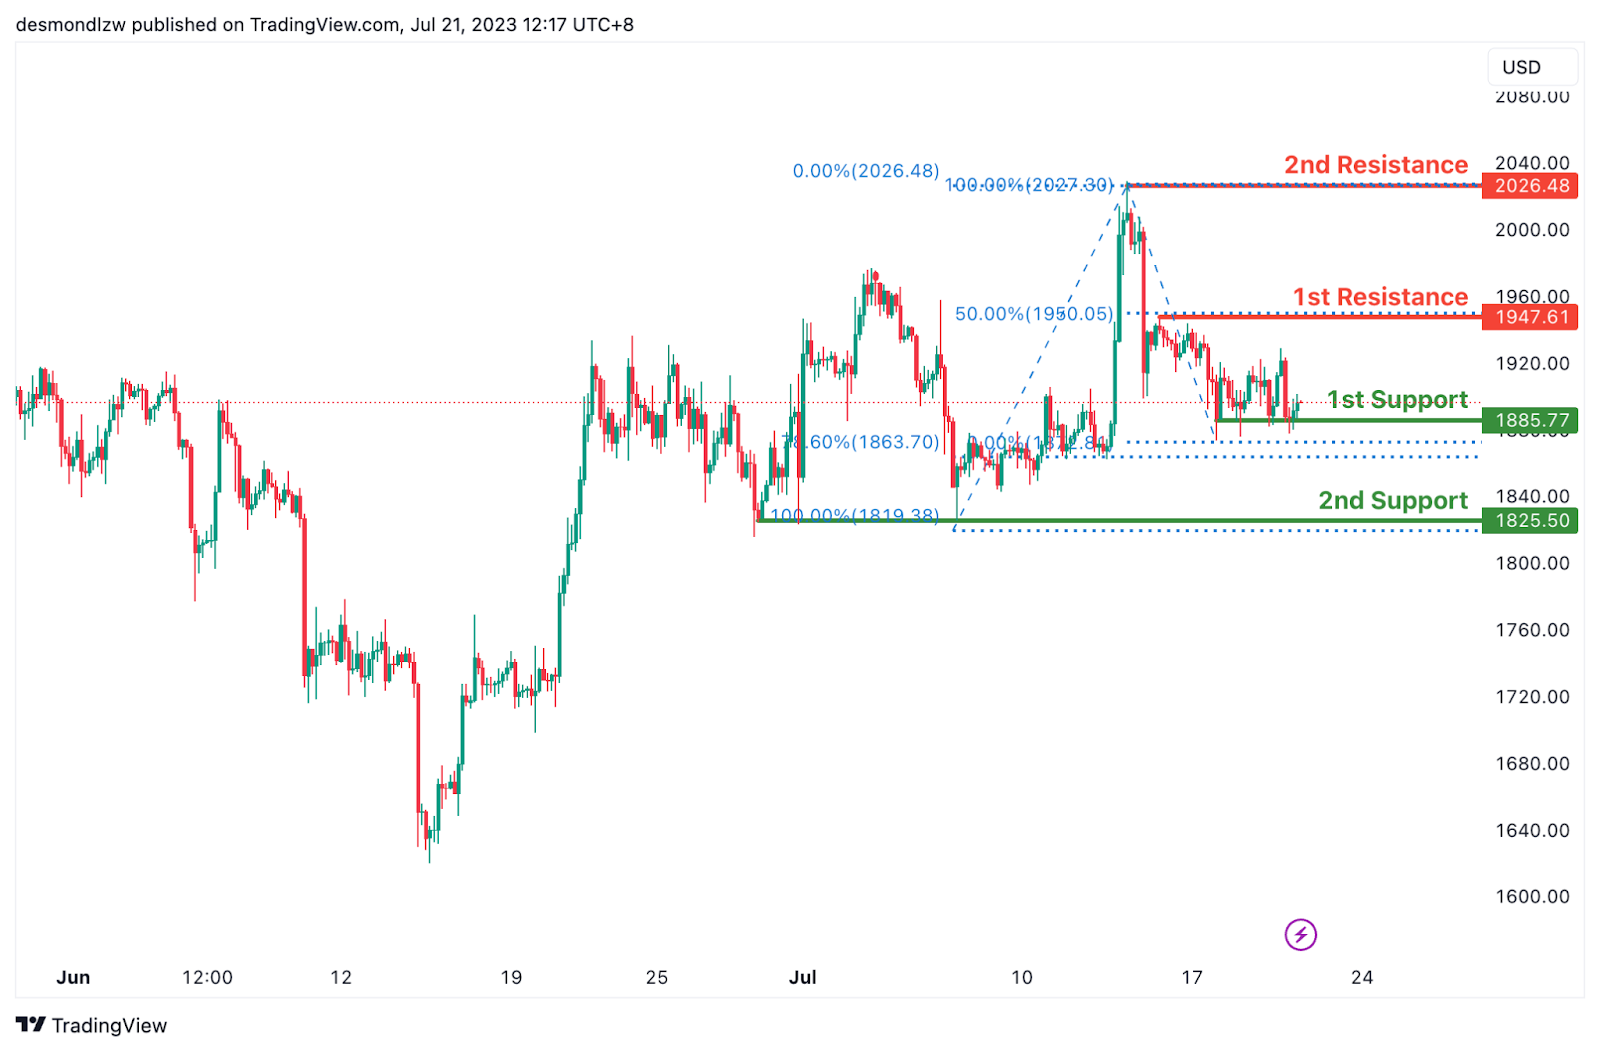
The ETH/USD chart is showing a bullish momentum. As such, there’s potential for a bullish bounce off the first support level, followed by an upward trend towards the first resistance level.
The 1st support level at 1872.11 is considered good due to its status as an overlap support and aligning with the 78.60% Fibonacci Retracement level. Additionally, the 2nd support at 1825.50 acts as a multi-swing low support.
On the upside, the 1st resistance level at 1947.61 represents a multi-swing high resistance and coincides with the 50% Fibonacci Retracement level. Furthermore, the 2nd resistance at 2026.48 is identified as a swing high resistance.
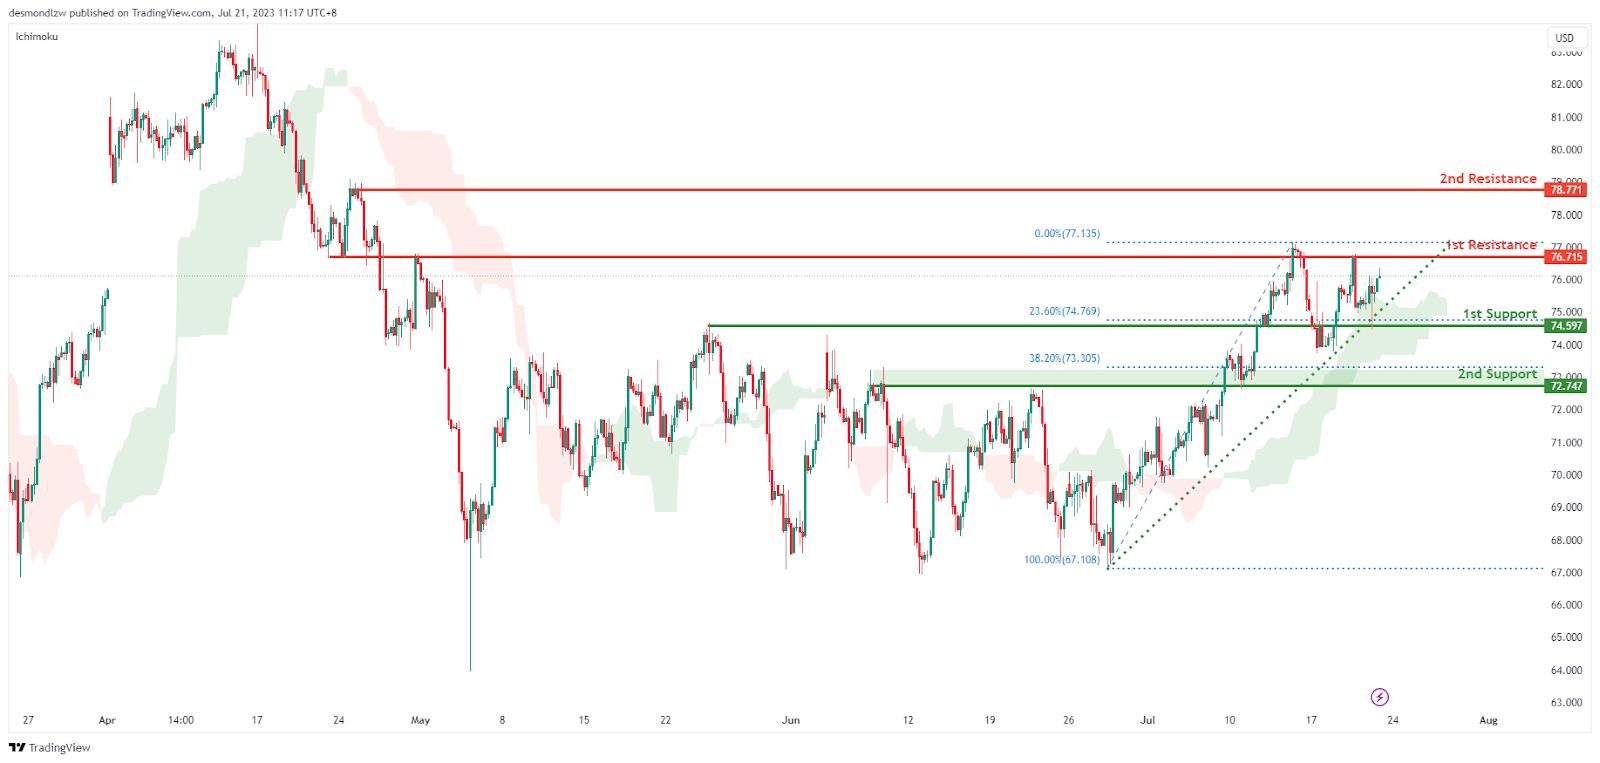
WTI/USD:
The WTI/USD pair is on a bullish trend, indicated by its position above the bullish Ichimoku cloud and a major ascending trend line, suggesting a potential continuation of this upward momentum.
If the price drops, the first support is expected at 74.59, an overlap support coinciding with the 23.6% Fibonacci retracement level. If the price continues to drop further, the second support level at 72.75 (an overlap support and the 38.2% Fibonacci retracement level) could act as a strong barrier to prevent further decline.
However, if the bullish trend continues, the price could face resistance at 76.72, an overlap resistance level. If the price continues to surge and surpasses this level, the next hurdle could be the second resistance level at 78.77, which is also an overlap resistance. These resistance levels might potentially hinder the price’s upward movement.
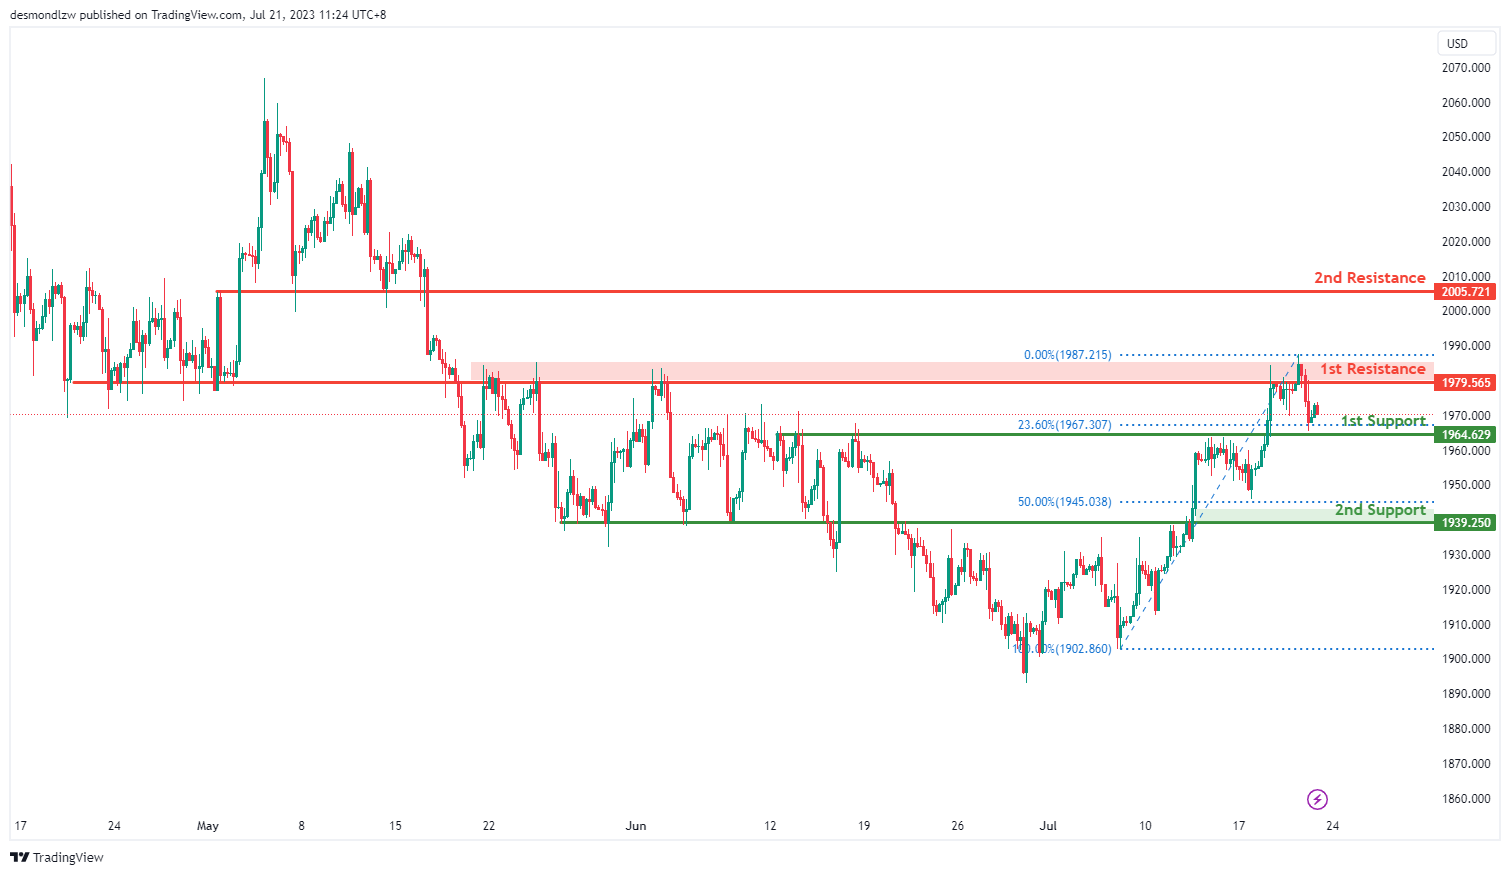
XAU/USD (GOLD):
The XAU/USD chart currently exhibits a neutral overall momentum, suggesting a potential fluctuation between the 1st resistance and 1st support level. The 1st support level at 1964.62 is identified as an overlap support, coinciding with the 23.60% Fibonacci retracement. Additionally, the 2nd support level at 1939.25 acts as a pullback support, aligning with the 50% Fibonacci retracement.
On the upside, the 1st resistance level at 1979.56 represents an overlap resistance. Furthermore, the 2nd resistance level at 2005.72 serves as a pullback resistance. As the overall momentum is neutral, the price may continue to fluctuate within these support and resistance levels.


