
DXY:
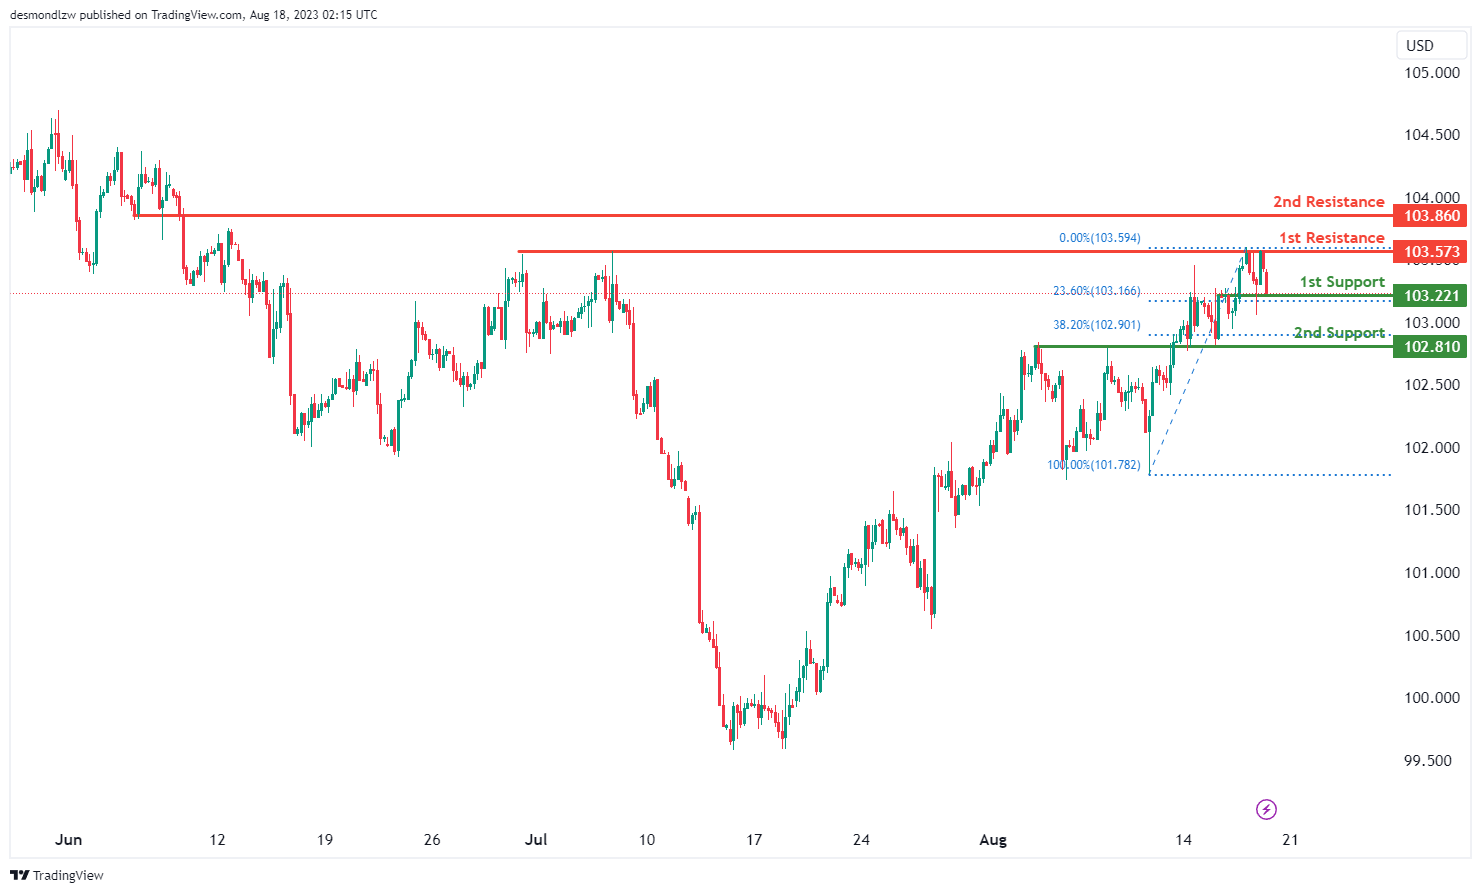
The DXY chart is currently demonstrating a bullish momentum, indicating a prevailing upward trend.
There’s a potential scenario where the price could experience a bullish bounce off the 1st support at 103.22 and advance towards the 1st resistance at 103.57.
The significance of the 1st support level at 103.22 is due to its classification as an overlap support, further reinforced by its alignment with a 23.60% Fibonacci Retracement. Similarly, the 2nd support at 102.81 gains strength as an overlap support, coinciding with a 38.20% Fibonacci Retracement.
On the resistance side, the 1st resistance level at 103.57 holds importance as a multi-swing high resistance. The 2nd resistance at 103.86 is noted as a pullback resistance.
Given the bullish momentum, a potential bounce off the support could lead the price towards the resistance levels.
EUR/USD:
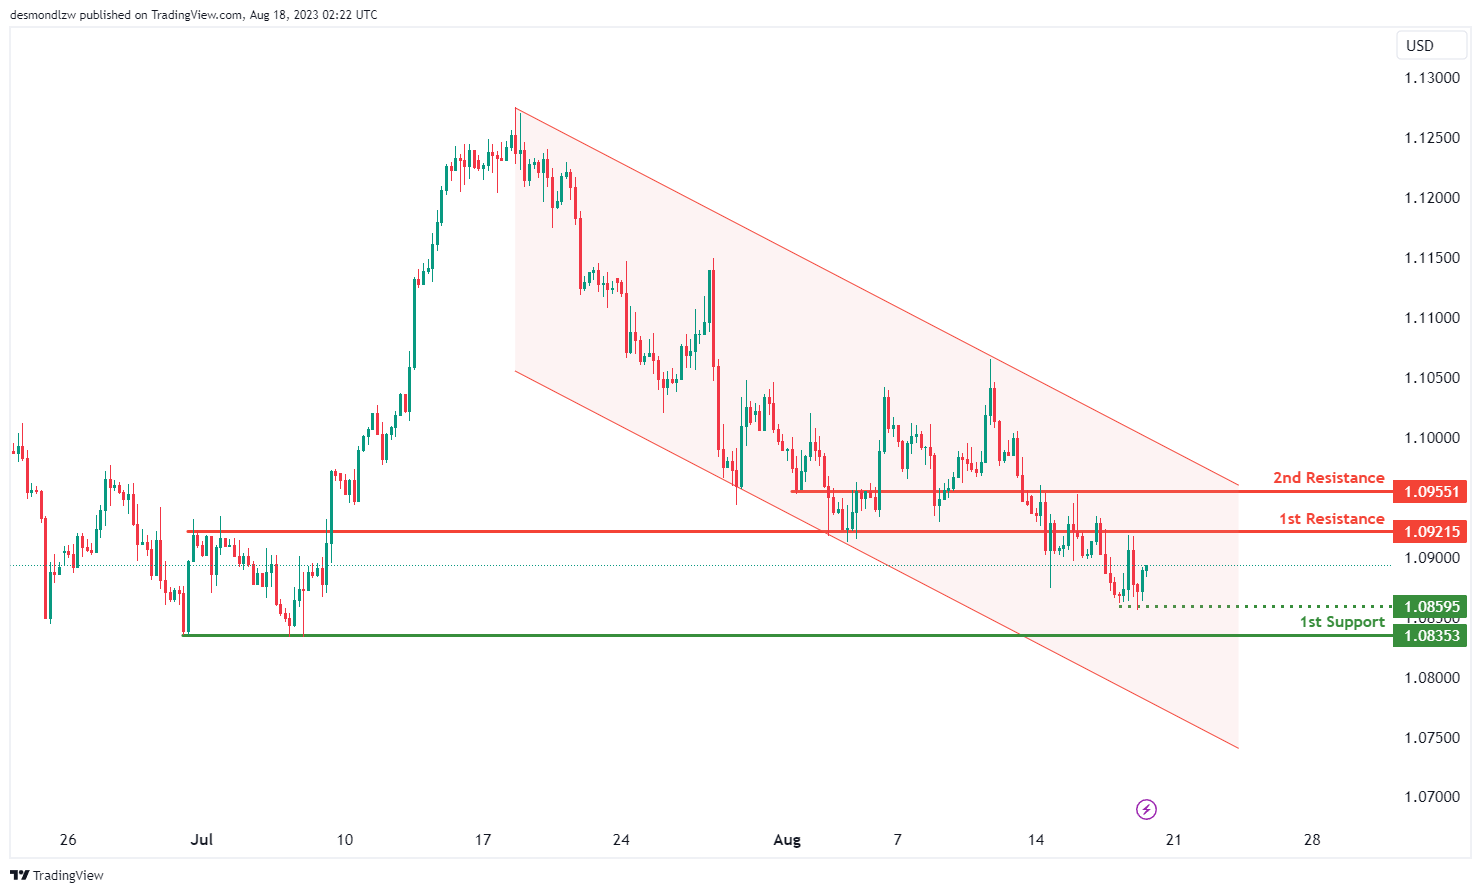
The EUR/USD chart is currently reflecting a bearish momentum, indicating a prevailing downward trend.
This bearish momentum is reinforced by the fact that the price is within a bearish descending channel, which suggests the potential for further downward movement.
In this context, there is a possibility that the price could continue its bearish trend towards the 1st support level at 1.0835. This support is considered significant due to its alignment with multi-swing low points.
Moreover, an intermediate support at 1.0859 adds further reinforcement as an overlap support.
On the resistance side, the 1st resistance level at 1.0921 is noted as an overlap resistance. Similarly, the 2nd resistance at 1.0955 holds significance as an overlap resistance.
EUR/JPY:
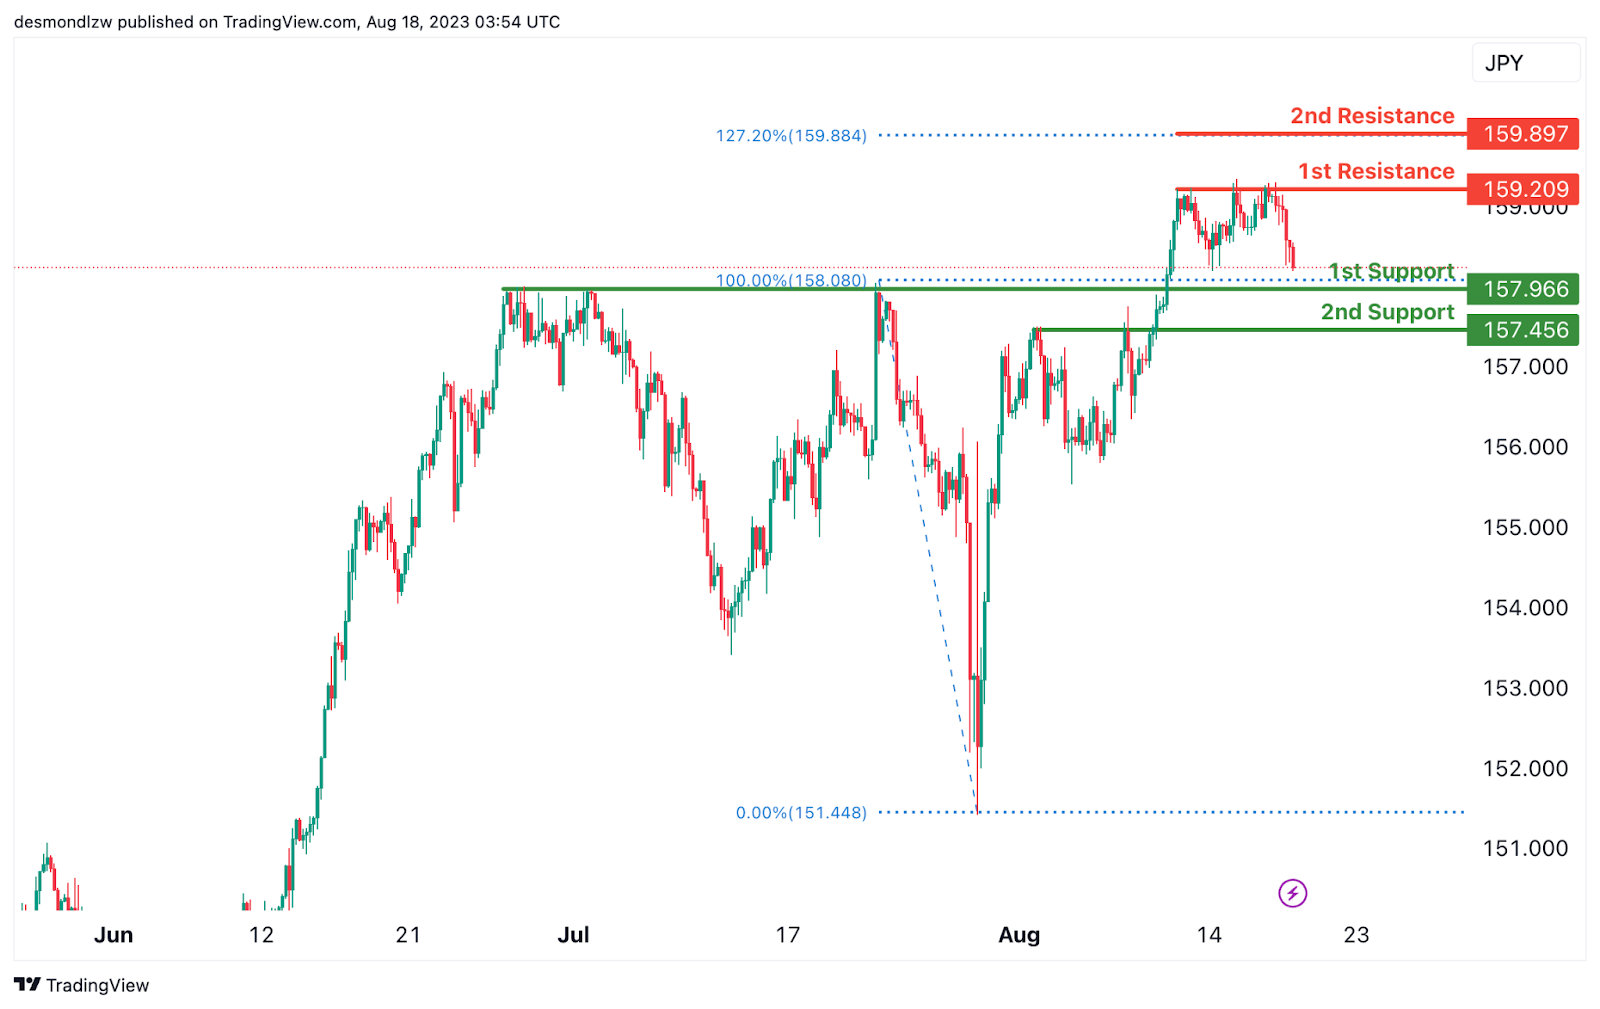
The EUR/JPY chart indicates a bearish overall momentum. There is a potential for a bearish continuation towards the 1st support level.
The 1st support is positioned at 157.96 and is considered advantageous due to its pullback support characteristics. Furthermore, the 2nd support at 157.45 is also seen as valuable because it represents a pullback support.
On the resistance side, the 1st resistance level at 159.20 is noteworthy as it represents a multi-swing high resistance. Additionally, the 2nd resistance at 159.89 is also significant due to its association with the 127.20% Fibonacci Extension.
EUR/GBP:
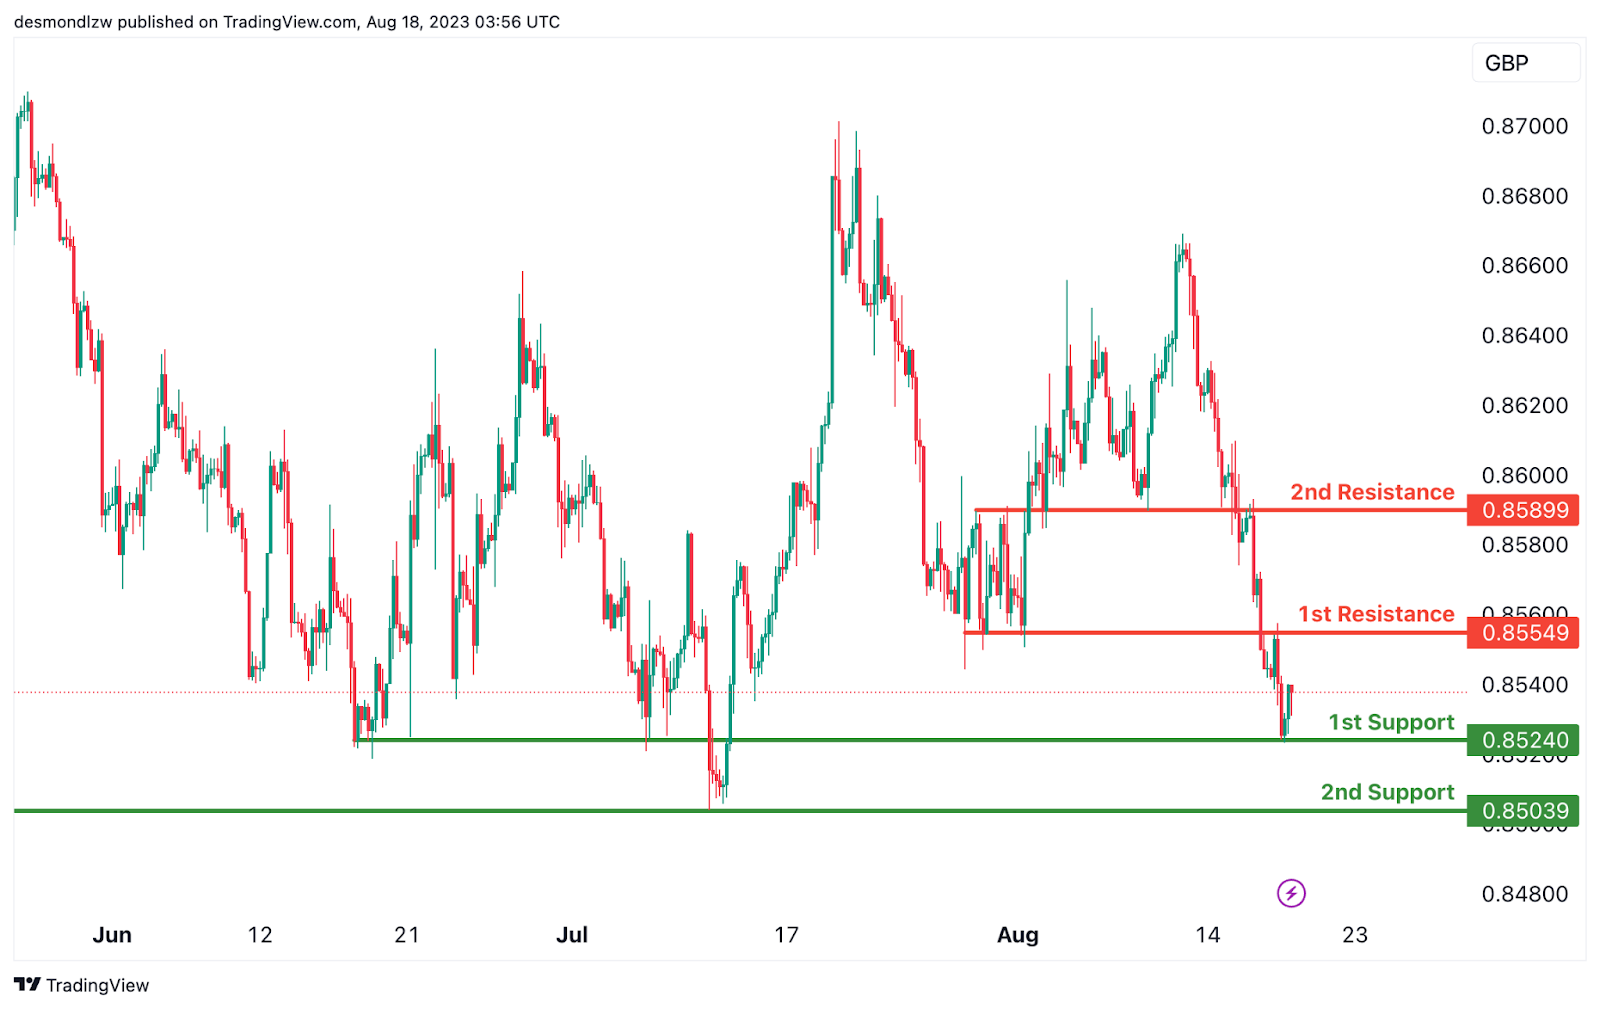
The EUR/GBP chart indicates a bullish overall momentum. There is a potential for a bullish continuation towards the 1st resistance level.
The 1st support is situated at 0.8524 and is considered advantageous due to its overlap support characteristics. Additionally, the 2nd support at 0.8503 is also seen as valuable because it represents an overlap support.
On the resistance side, the 1st resistance level at 0.8554 is noteworthy as it represents a pullback resistance. Furthermore, the 2nd resistance at 0.8589 is also significant due to its overlap resistance characteristics.
GBP/USD:
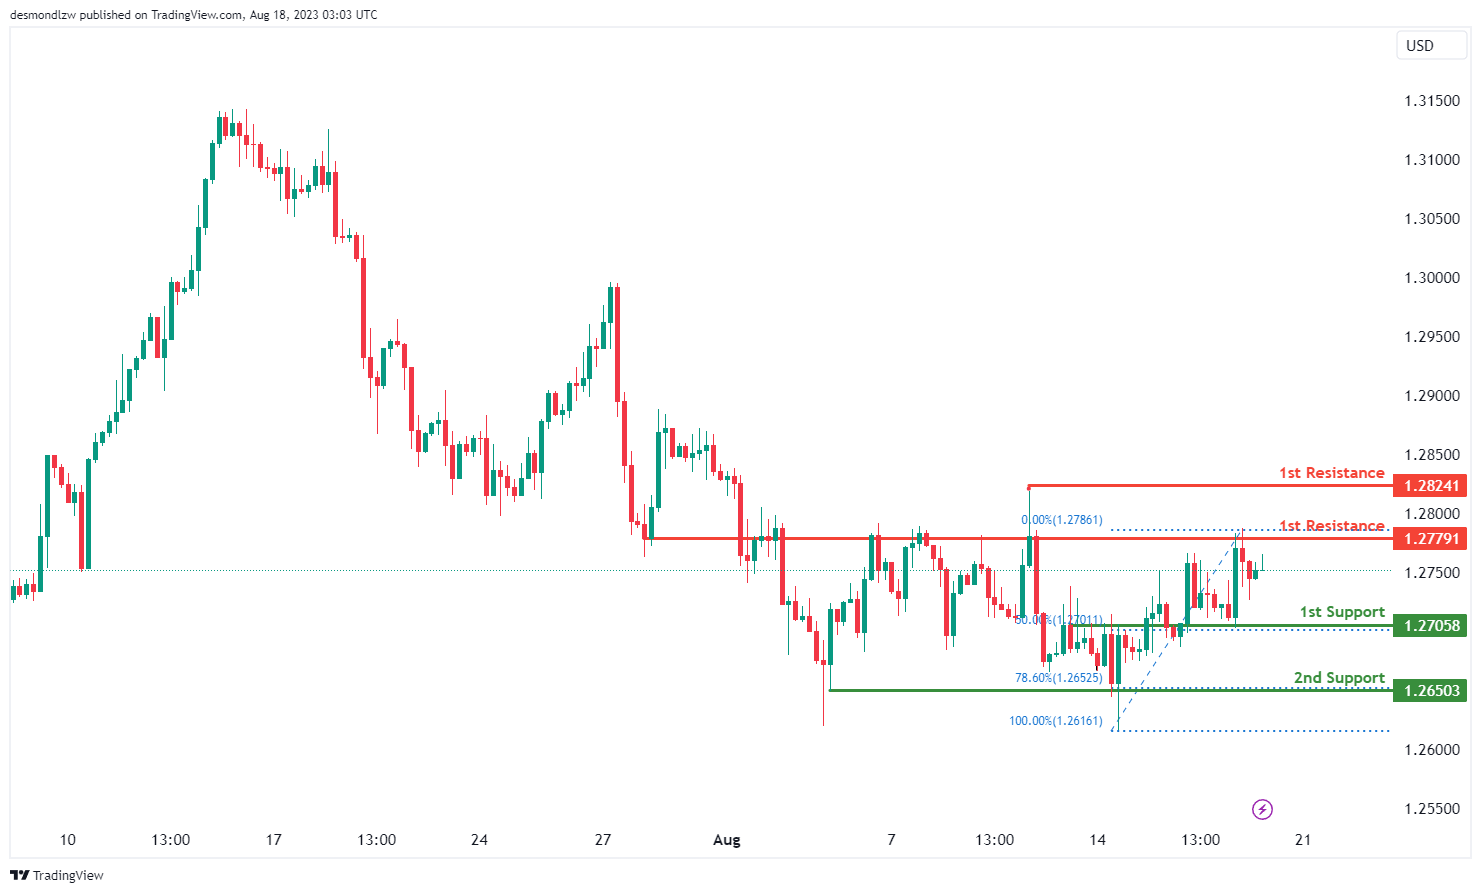
The GBP/USD chart is currently exhibiting a bearish momentum, indicating a prevalent downward trend.
In the context of this bearish momentum, there is a potential scenario where the price continues its bearish movement towards the 1st support level at 1.2705. This support level is considered significant as it aligns with a 50% Fibonacci retracement, enhancing its potential to provide support.
Furthermore, a 2nd support at 1.2650 gains importance due to its identification as a swing low support and its alignment with a 78.60% Fibonacci retracement.
On the resistance side, the 1st resistance level at 1.2779 is noted as an overlap resistance, indicating a potential area of resistance against upward movement.
Similarly, the 2nd resistance at 1.2824 is identified as a swing high resistance, reinforcing its potential to impede upward price action.
GBP/JPY:
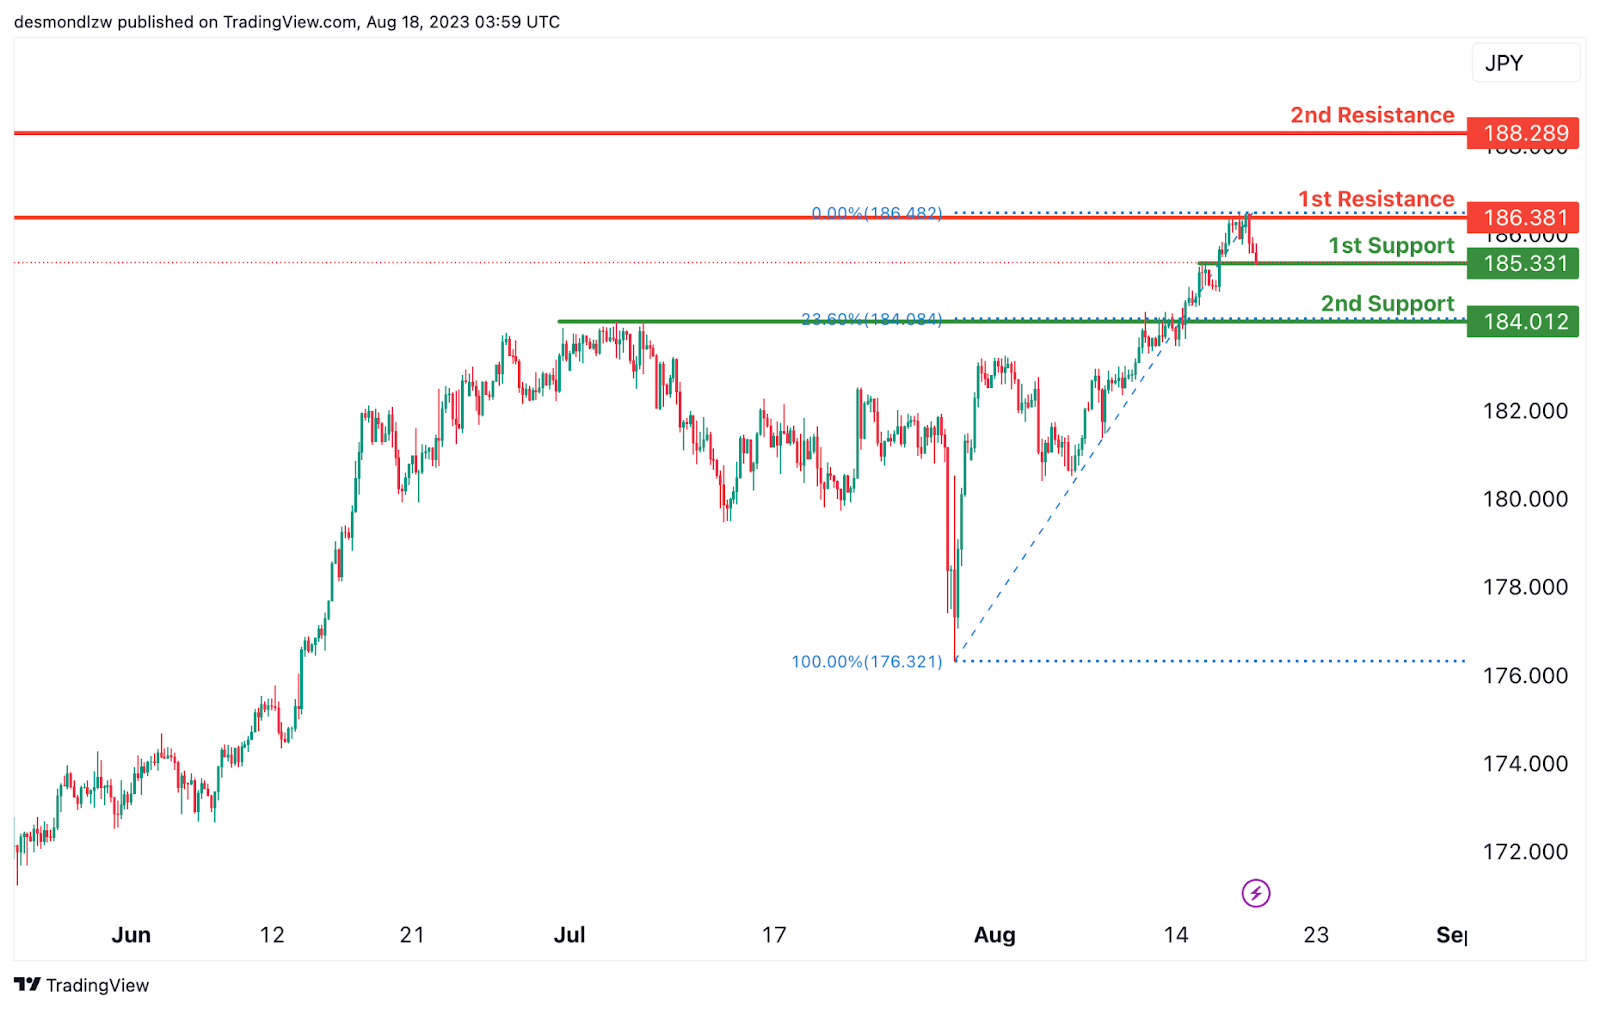
The GBP/JPY chart indicates a weak bullish momentum with low confidence. There is a potential for a bullish bounce off the 1st support level, leading the price towards the 1st resistance.
The 1st support is positioned at 185.33 and is considered advantageous due to its pullback support characteristics. Furthermore, the 2nd support at 184.01 is also seen as valuable because it represents a pullback support along with a 23.60% Fibonacci Retracement.
On the resistance side, the 1st resistance level at 186.38 is noteworthy as it represents a swing high resistance. Additionally, the 2nd resistance at 188.28 is also significant due to its multi-swing high resistance characteristics.
USD/CHF:
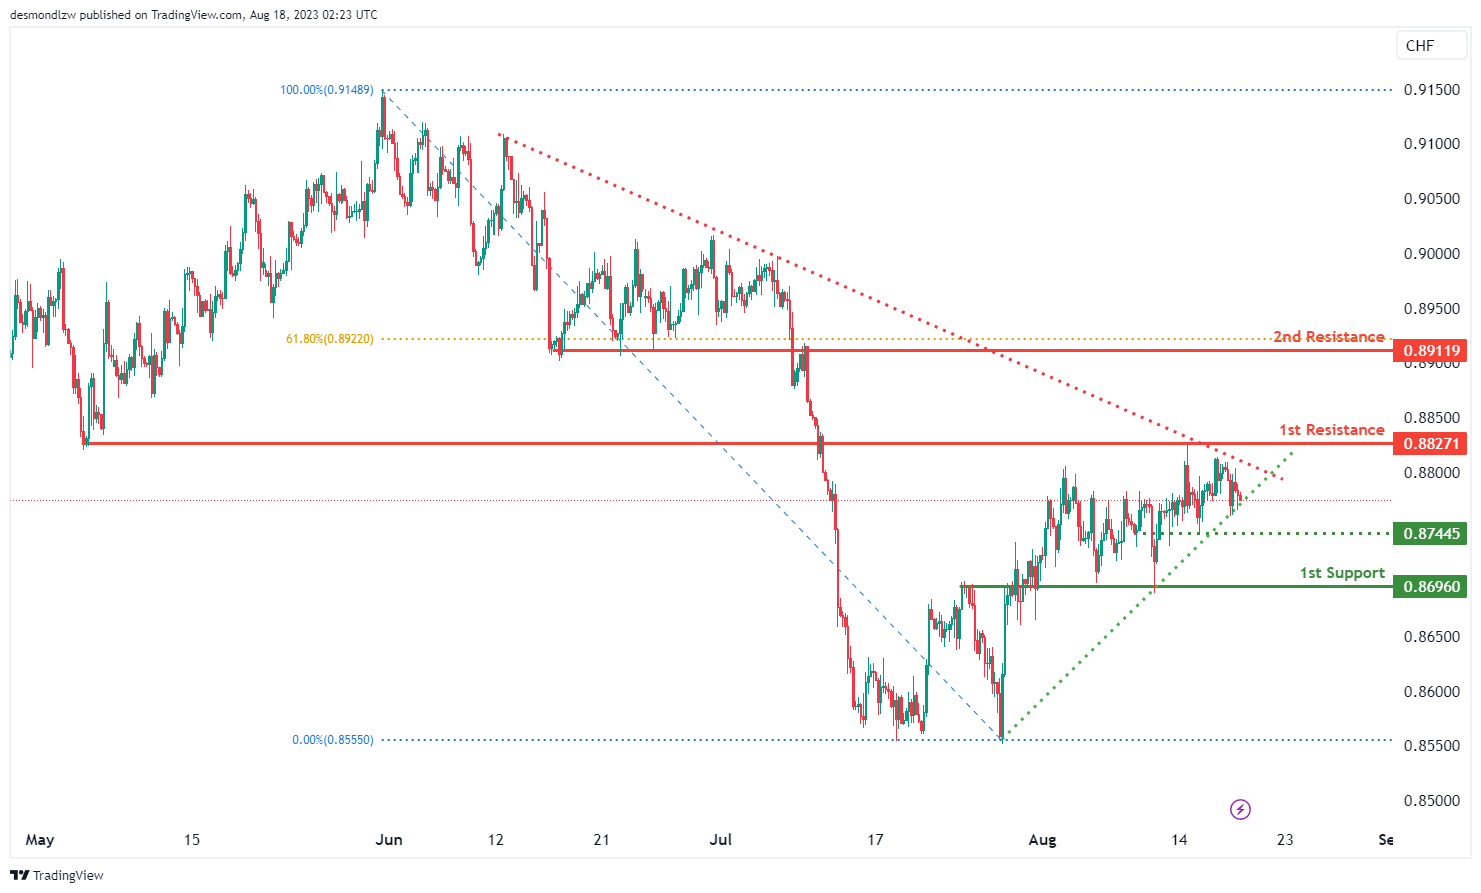
The USD/CHF chart currently presents a neutral momentum, suggesting a lack of a clear trend.
Considering this neutral momentum, there is a possibility that the price might exhibit fluctuations between the 1st resistance and 1st support levels.
The 1st support at 0.8696 is identified as an overlap support, potentially providing a level where price could find temporary stability.
An intermediate support at 0.8744 holds significance as a swing low support, reinforcing its potential to act as a point of temporary price reversal.
Conversely, the 1st resistance at 0.8827 is characterized as an overlap resistance, potentially causing price to face resistance when moving upwards.
Further resistance is found at the 2nd resistance level of 0.8911, which is marked as a pullback resistance, indicating a potential barrier to upward price movement.
Adding to the analysis, a symmetrical triangle chart pattern is observed. Such patterns represent periods of consolidation before a breakout or breakdown occurs. If the price breaks above the upper trendline of the pattern, it could signify a bullish breakout, while a break below the lower trendline might indicate a bearish breakdown. This pattern suggests that a significant price move might be on the horizon.
USD/JPY:
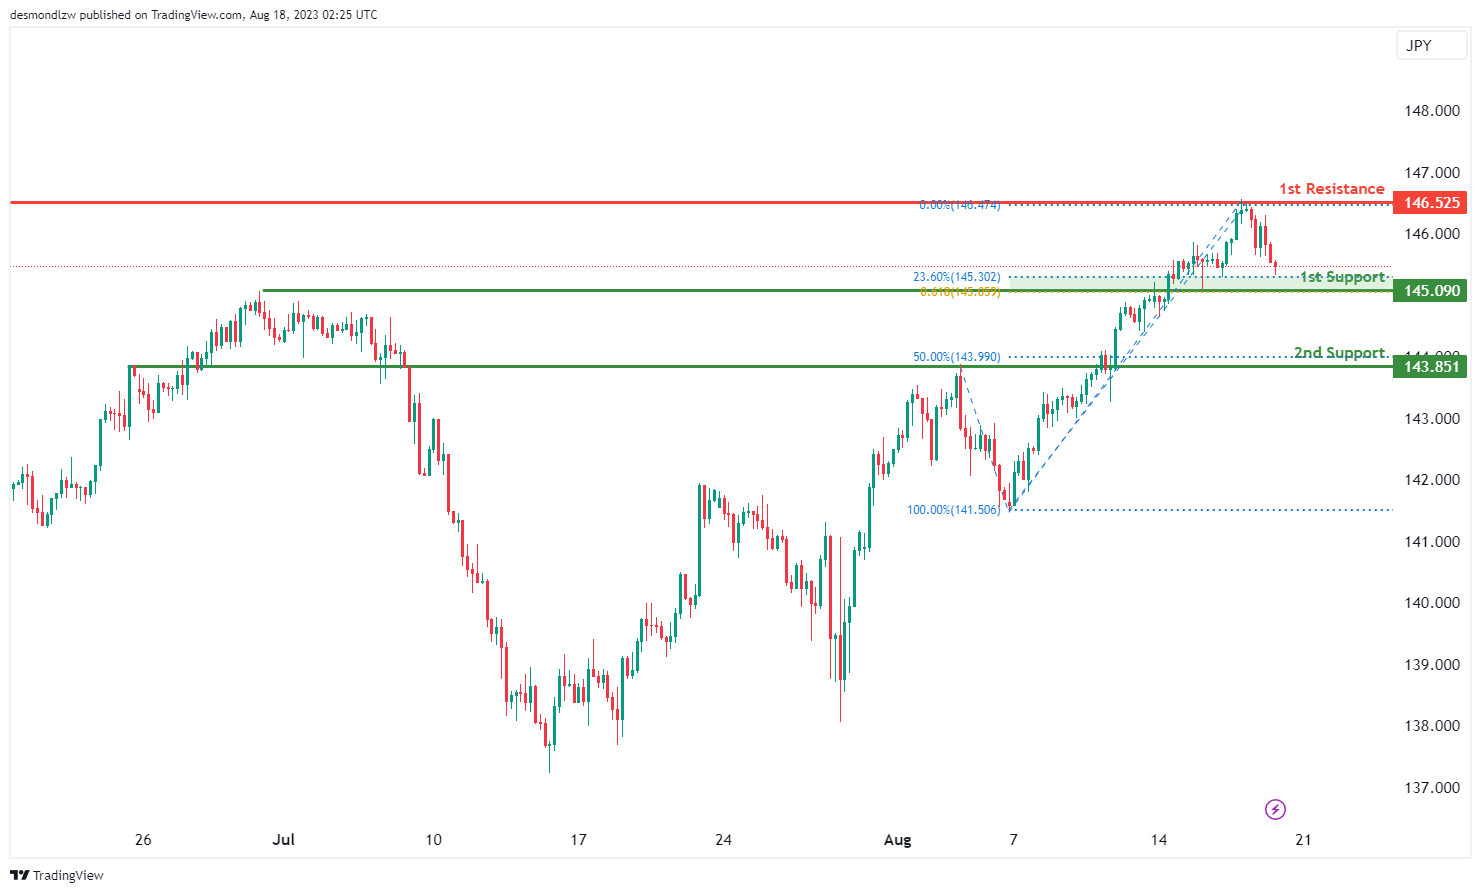
The USD/JPY chart currently exhibits a bullish momentum, indicating a prevalent upward trend.
Given this bullish momentum, there is a potential scenario where the price bounces off the 1st support level and continues its upward movement towards the 1st resistance.
The 1st support level at 145.09 gains significance due to its designation as an overlap support. This level is further reinforced by its alignment with both a 23.60% Fibonacci Retracement and a 61.80% Fibonacci Projection, indicating a notable Fibonacci confluence.
Additionally, a 2nd support level at 143.85 is identified as a pullback support, strengthened by its alignment with a 50% Fibonacci Retracement.
On the opposing side, the 1st resistance level at 146.52 is important as it represents a swing high resistance, possibly causing the price to face resistance when moving upwards.
USD/CAD:
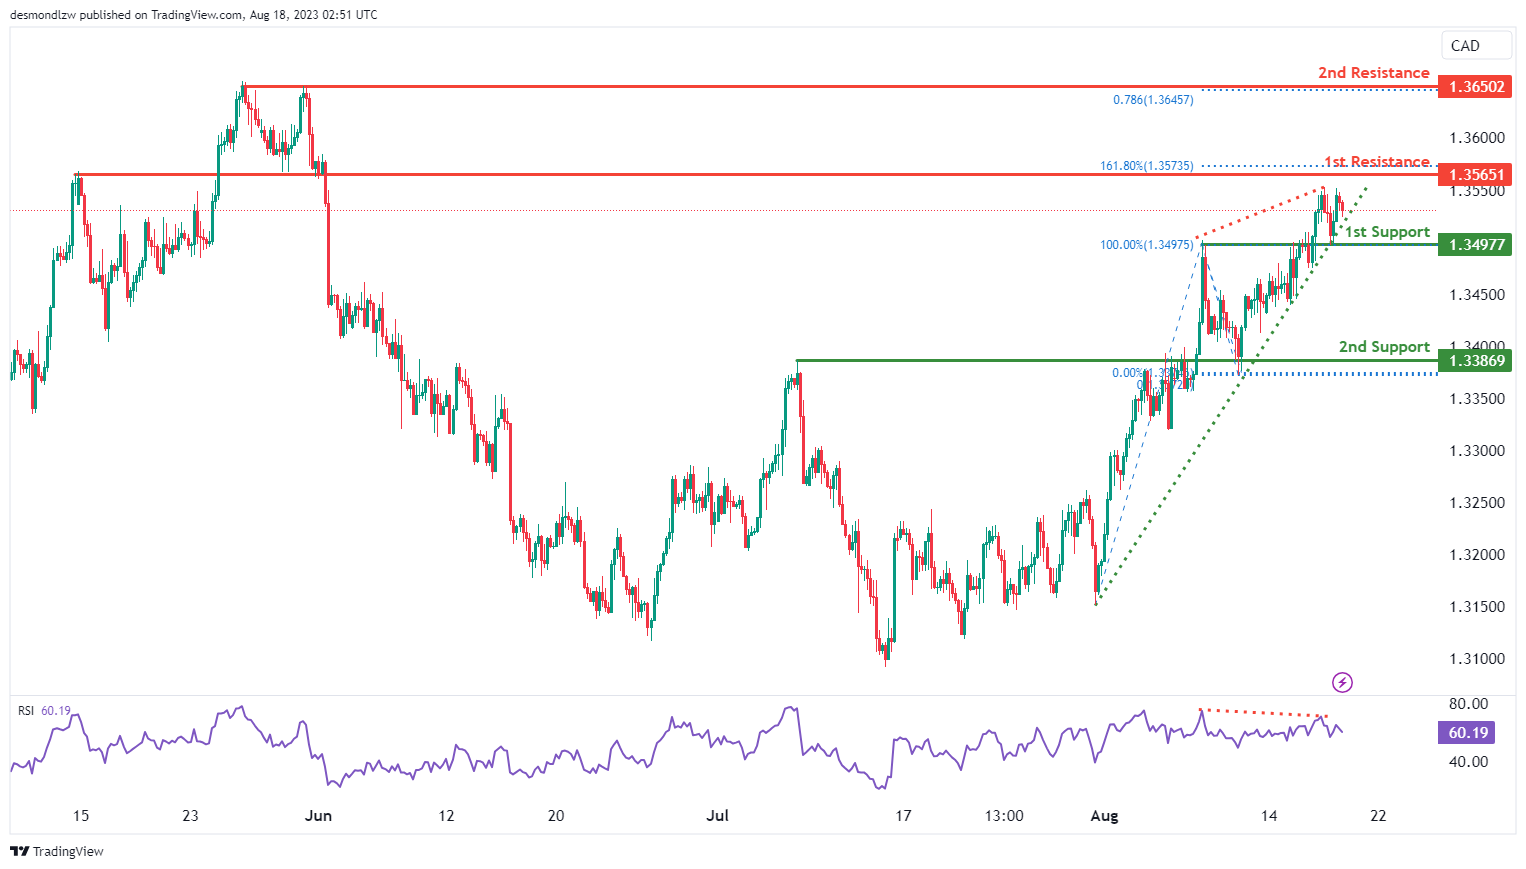
The USD/CAD chart currently exhibits a bearish momentum, implying a dominant downward trend. The RSI indicator is also contributing to the analysis by displaying bearish divergence versus the price, suggesting that the bearish reversal is already in play.
There is a possibility that the price could continue its downward movement towards the 1st support level at 1.3498, which is identified as an overlap support. Furthermore, the 2nd support level at 1.3387 is also identified as an overlap support.
To the upside, the 1st resistance level at 1.3565 is identified as an overlap resistance that aligns with the 161.80% Fibonacci extension level. Additionally, the 2nd resistance at 1.3650 is identified as a multi-swing high resistance that aligns with the 78.60% Fibonacci projection level.
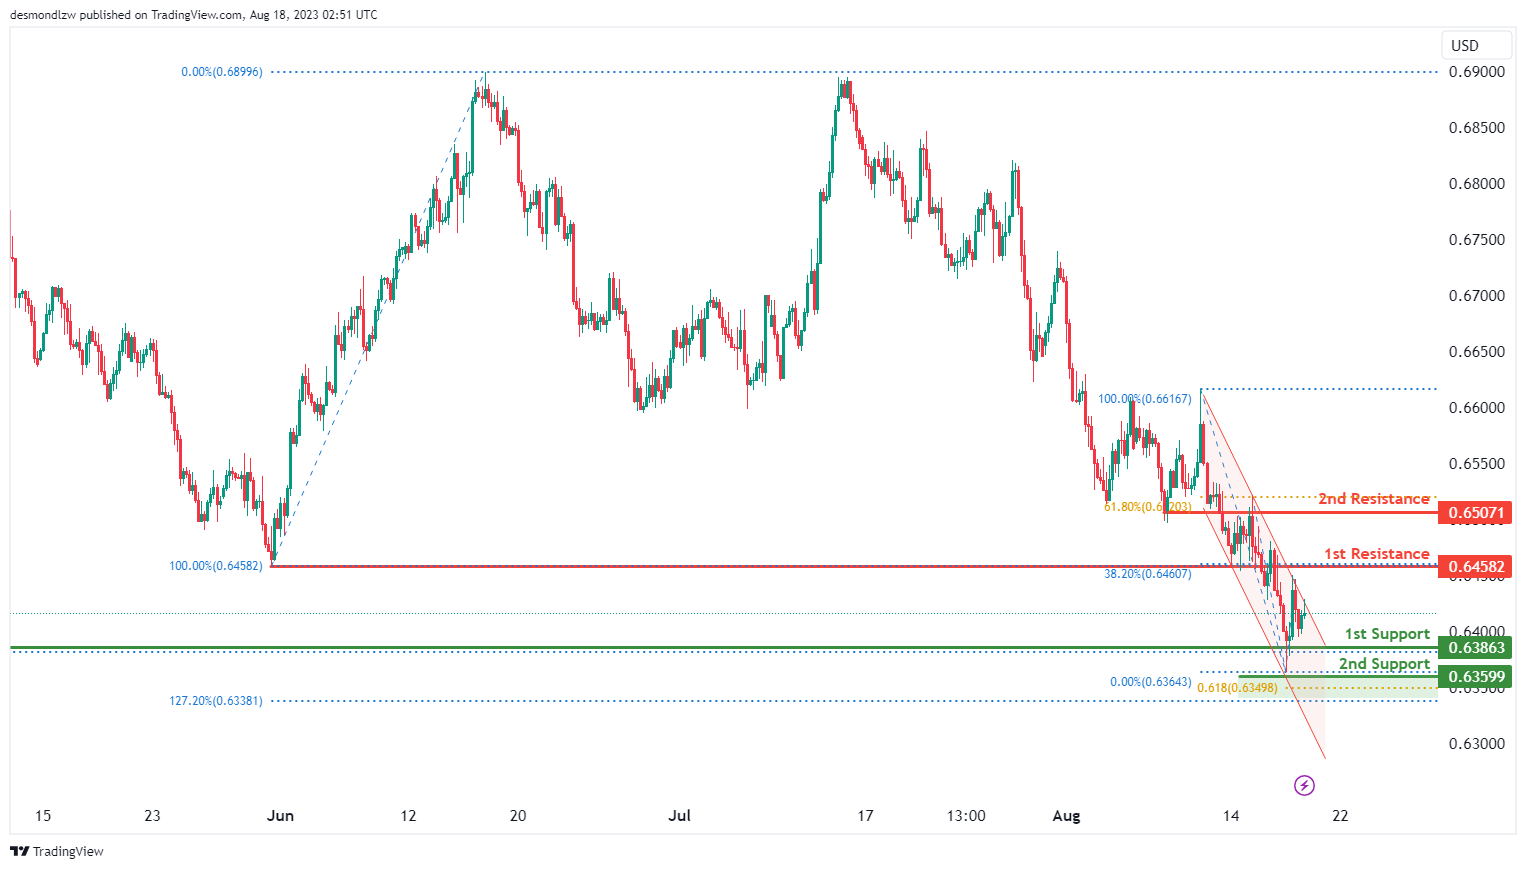
AUD/USD:
The AUD/USD chart currently displays a bearish momentum, indicating a predominant downward trend. This bearish momentum is influenced by the price’s movement within a descending channel pattern.
Considering this bearish context, there is a potential scenario where the price continues its downward trajectory towards the 1st support level at 0.6386 that is identified as an overlap support and aligns the 78.60% Fibonacci retracement level. Furthermore, the 2nd support at 0.6359 is identified as a swing-low support that aligns with the 61.80% Fibonacci projection level.
To the upside, the 1st resistance level at 0.6458 is identified as an overlap resistance that aligns with the 38.20% Fibonacci retracement level. Additionally, the 2nd resistance level at 0.6507 is also identified as an overlap resistance that aligns with the 61.80% Fibonacci retracement level.
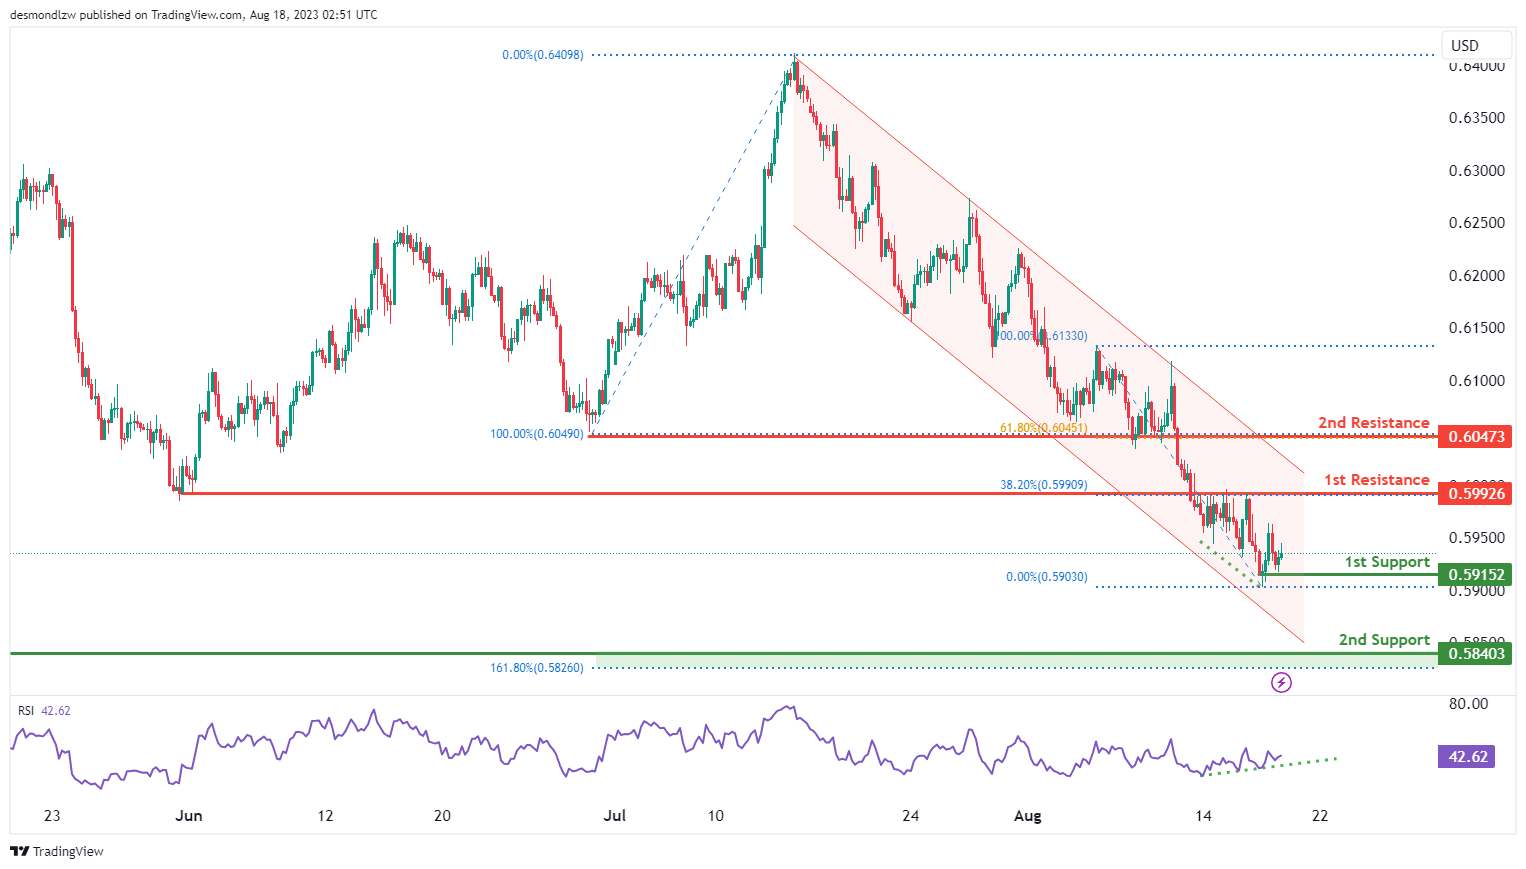
NZD/USD
The NZD/USD chart exhibits a bearish momentum, indicating a prevailing downward trend. This bearish momentum is supported by the price’s movement within a descending channel pattern.
The price could continue its downward movement towards the 1st support level at 0.5915 that is identified as a swing-low support. Additionally, the 2nd support at 0.5840 is also identified as a swing-low support that aligns with the 161.80% Fibonacci extension level.
To the upside, the 1st resistance level at 0.5993 is identified as an overlap resistance that aligns with the 38.20% Fibonacci retracement level. Furthermore, the 2nd resistance at 0.6047 is identified as an overlap resistance that aligns with the 61.80% Fibonacci retracement level.
It is also worth noting that the RSI is showing bullish divergence versus price, which could suggest a potential bounce in the near future. This divergence might influence a temporary reversal in the ongoing bearish trend.
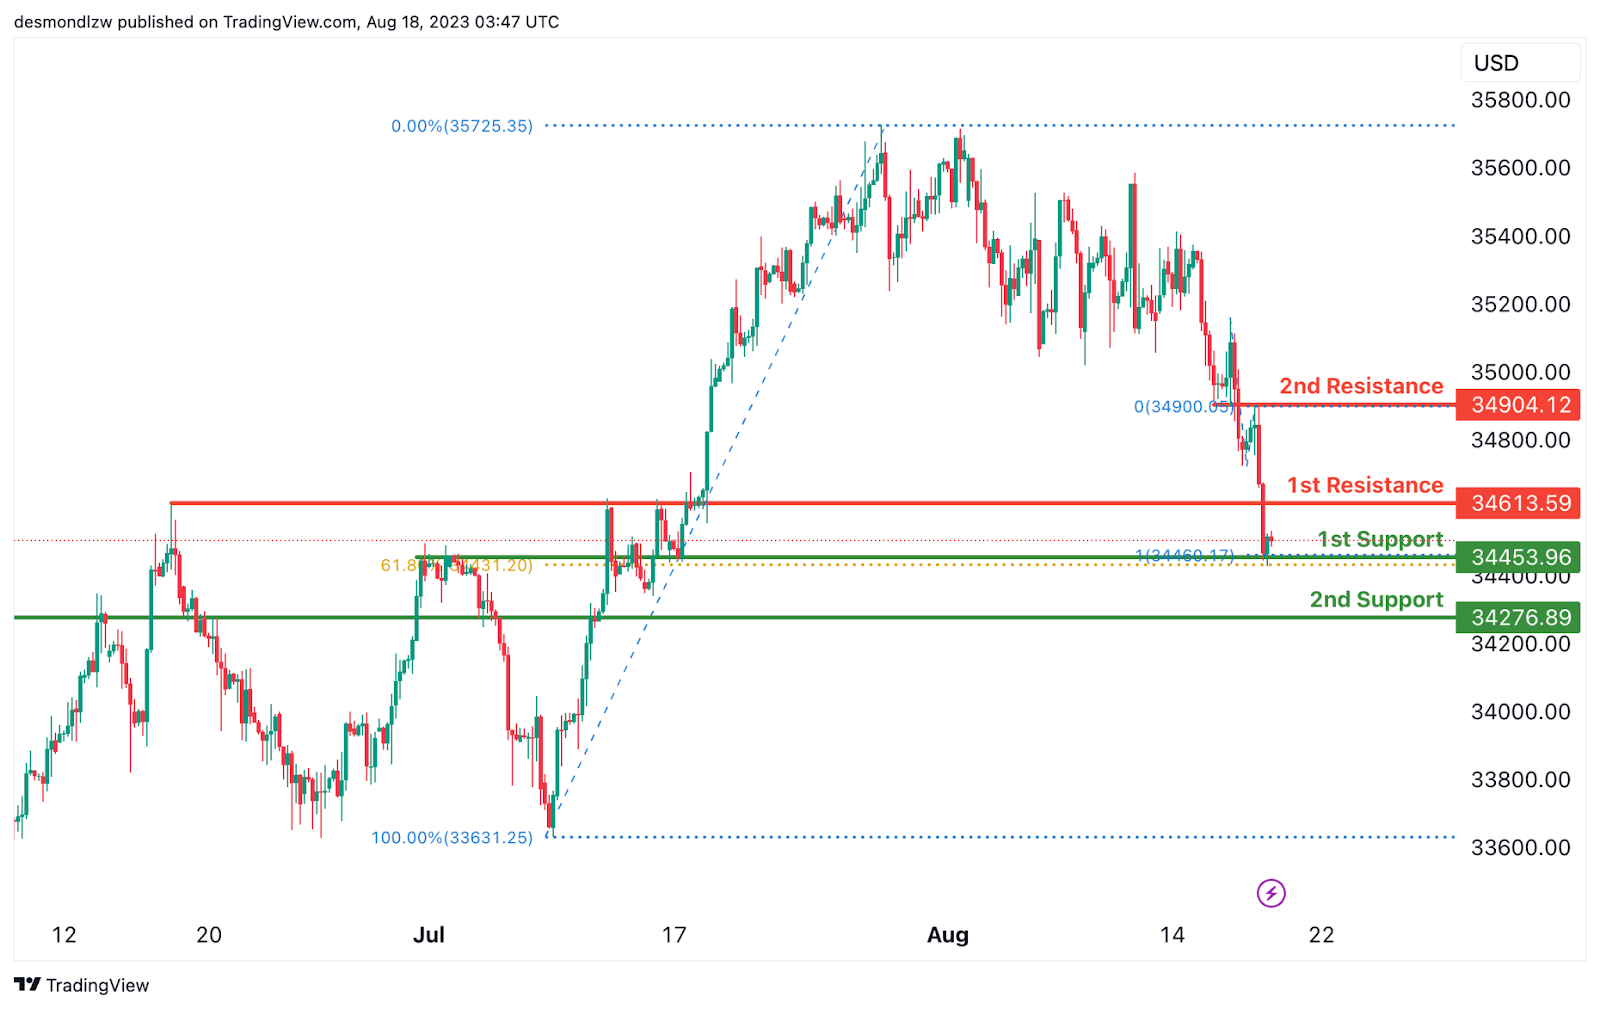
DJ30:
The DJ30 chart indicates a bullish overall momentum. There is a potential for a bullish bounce off the 1st support level, leading the price towards the 1st resistance.
The 1st support is positioned at 34453.96 and is considered advantageous due to its overlap support and a 61.80% Fibonacci Retracement. Furthermore, the 2nd support at 34276.89 is also seen as valuable because it represents an overlap support.
On the resistance side, the 1st resistance level at 34613.59 is noteworthy as it represents a pullback resistance. Additionally, the 2nd resistance at 34904.12 is also significant due to its pullback resistance characteristics.
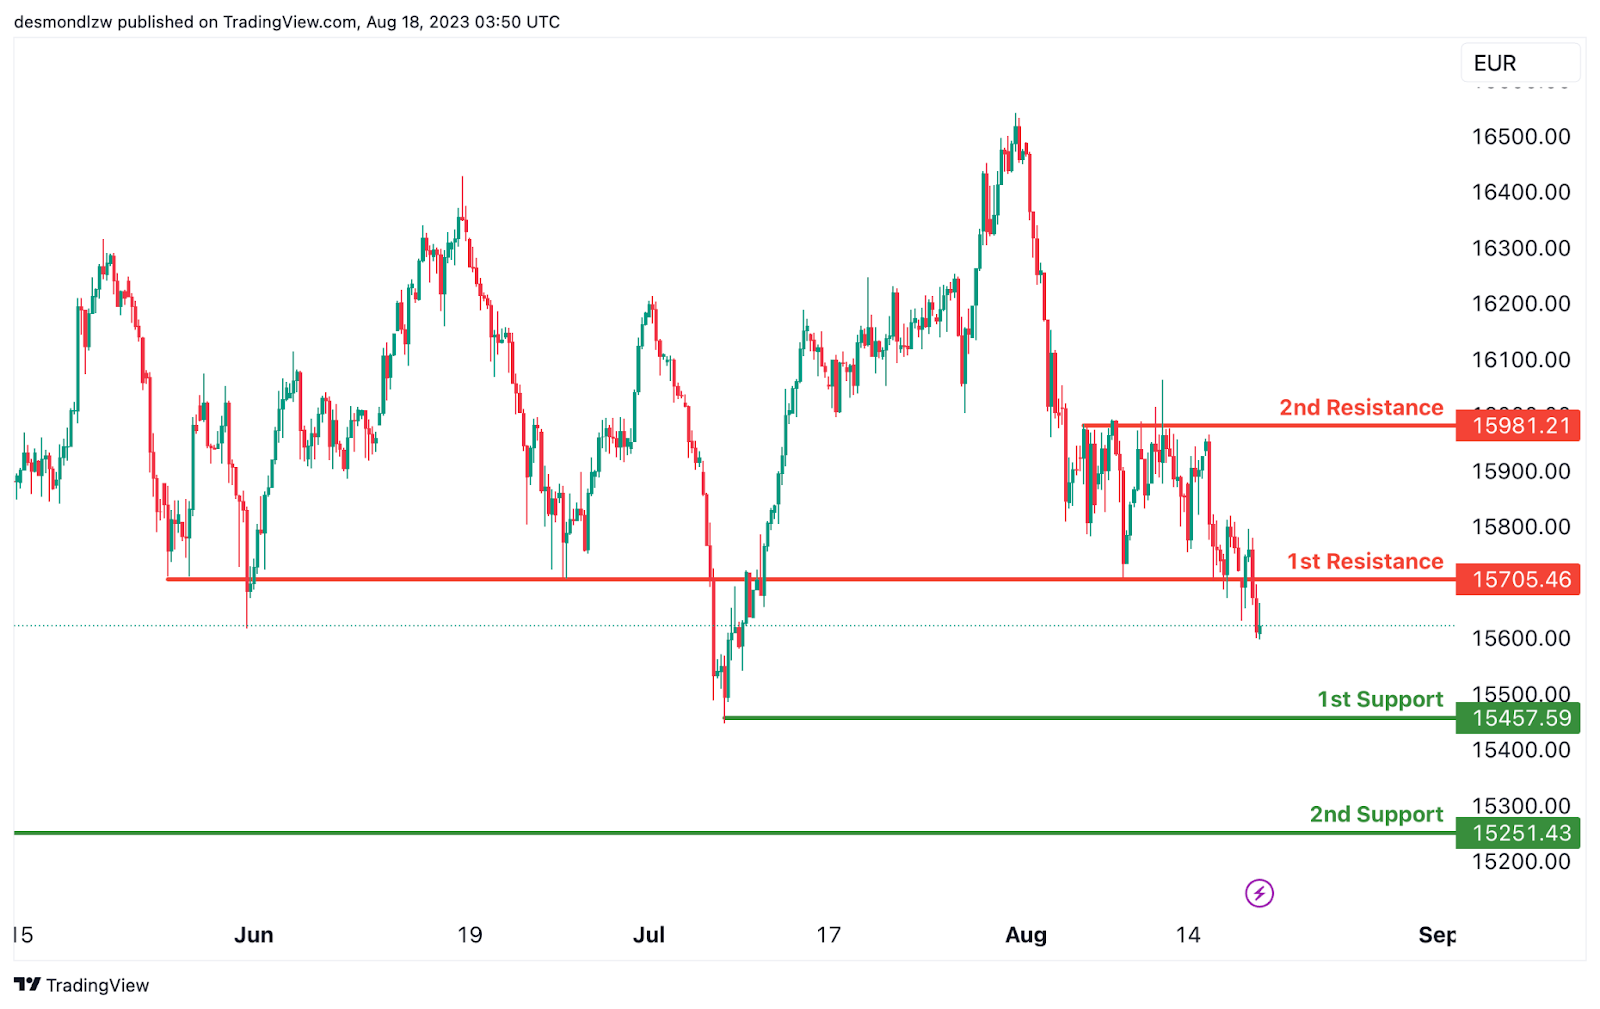
GER30:
The GER30 chart indicates a bearish overall momentum. There is a potential for a bearish continuation towards the 1st support level.
The 1st support is situated at 15457.59 and is considered advantageous due to its swing low support characteristics. Furthermore, the 2nd support at 15251.43 is also seen as valuable because it represents an overlap support.
On the resistance side, the 1st resistance level at 15705.46 is noteworthy as it represents an overlap resistance. Additionally, the 2nd resistance at 15981.21 is also significant due to its pullback resistance characteristics.
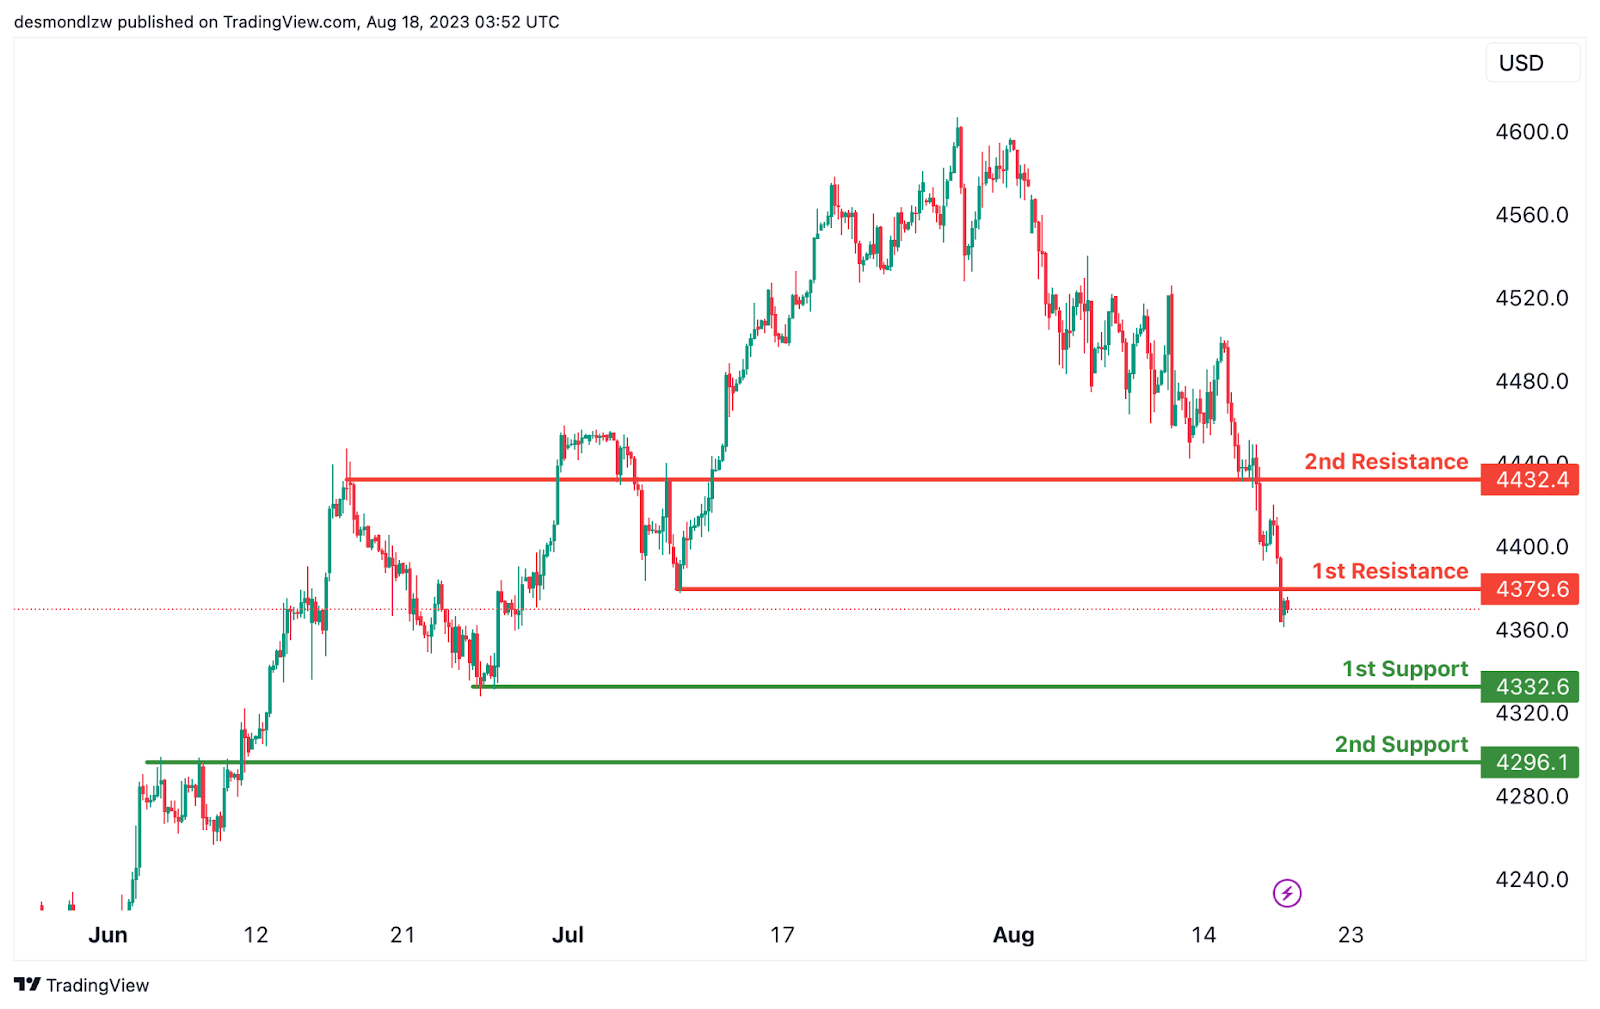
US500
The US500 chart indicates a bearish overall momentum. There is a potential for a bearish continuation towards the 1st support level.
The 1st support is located at 4332.6 and is considered advantageous due to its swing low support characteristics, along with a 100% Fibonacci Projection.
Furthermore, the 2nd support at 4296.1 is also seen as valuable as it represents a pullback support.
On the resistance side, the 1st resistance level at 4379.6 is noteworthy as it represents a pullback resistance. Additionally, the 2nd resistance at 4432.4 is also significant due to its overlap resistance characteristics.
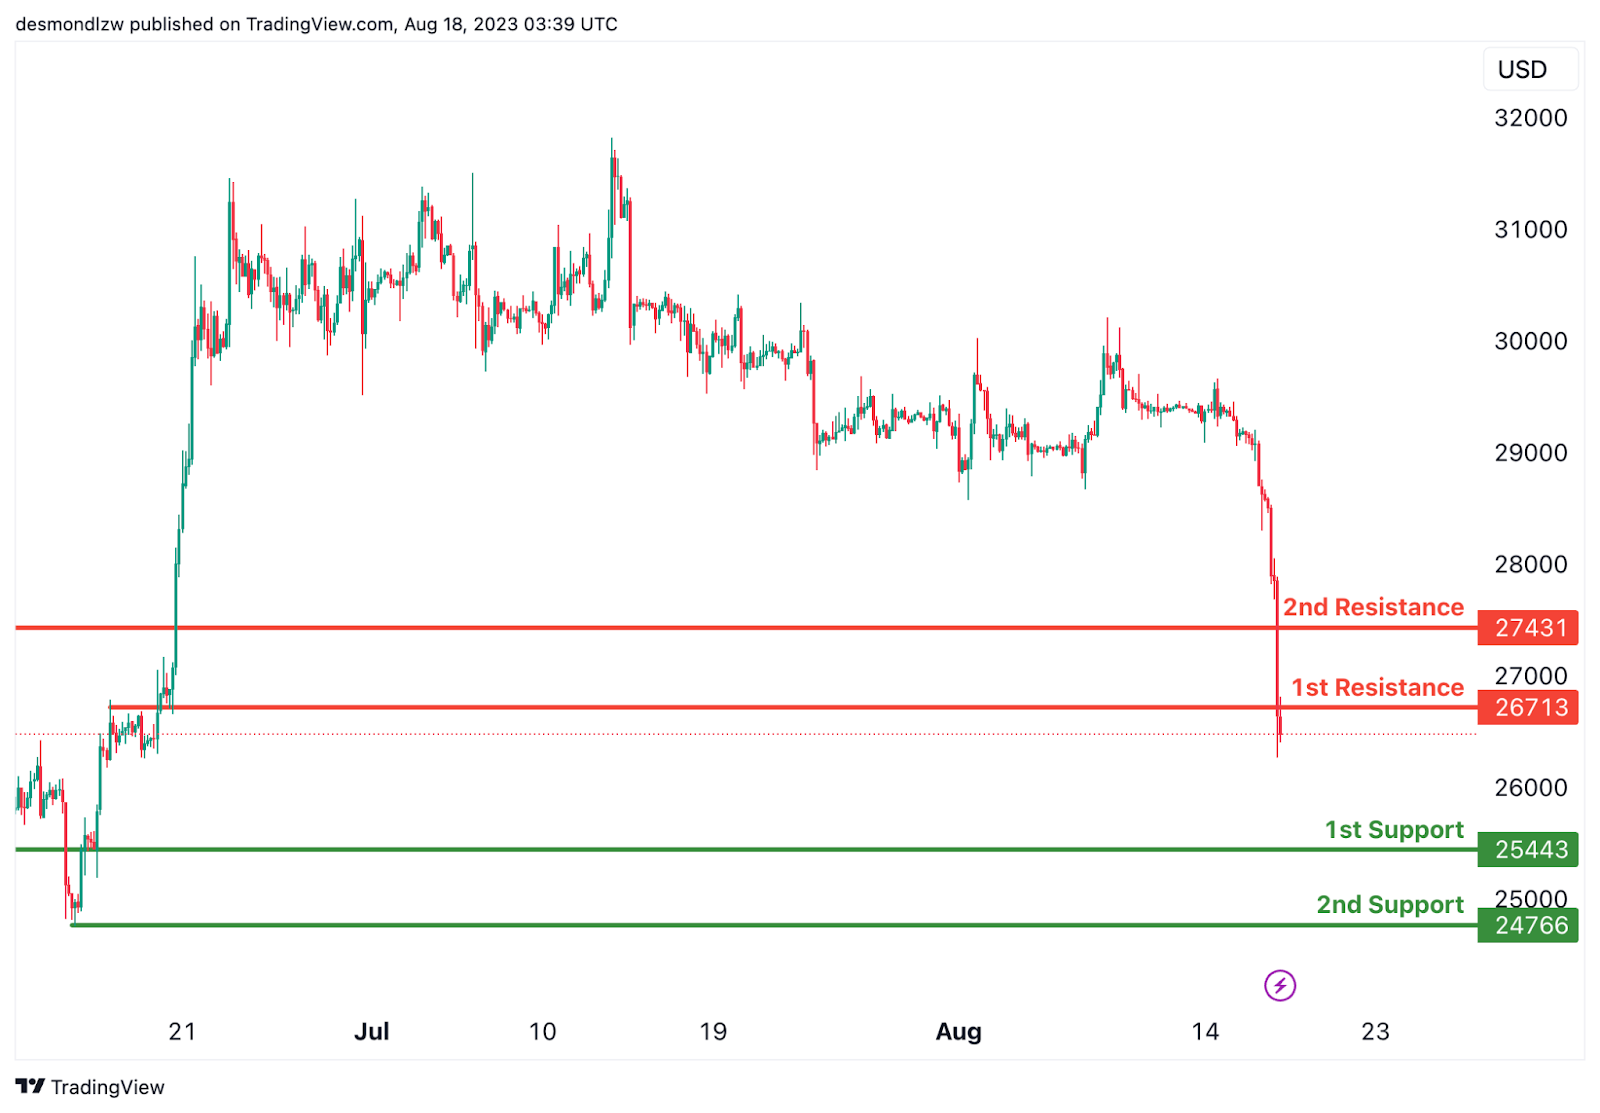
BTC/USD:
The BTC/USD chart indicates a bearish overall momentum. There is a potential for a bearish reaction off the 1st resistance level, leading to a drop towards the 1st support level.
The 1st support is situated at 25443 and is considered advantageous due to its overlap support characteristics. Additionally, the 2nd support at 24766 is viewed as valuable because it represents a swing low support.
On the resistance side, the 1st resistance level at 26713 is noteworthy as it represents an overlap resistance. Furthermore, the 2nd resistance at 27431 is also seen as significant due to its overlap resistance characteristics.
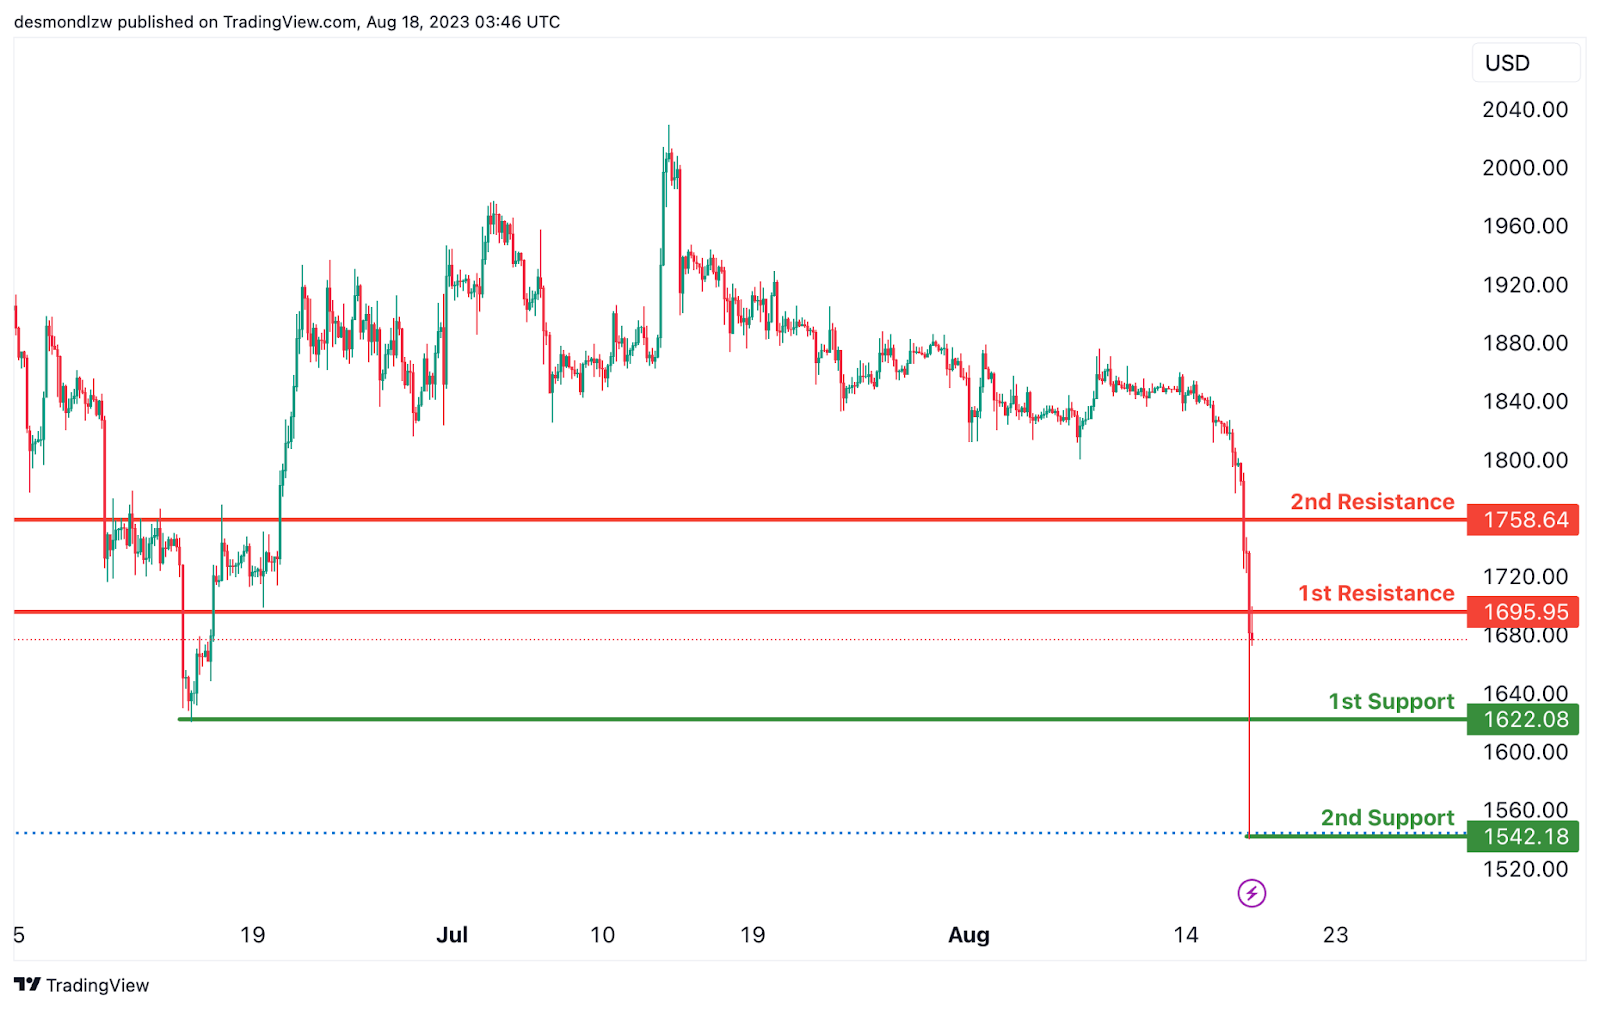
ETH/USD:
The ETH/USD chart shows a bearish overall momentum. There is a potential for a bearish reaction off the 1st resistance level, leading to a drop towards the 1st support level.
The 1st support is located at 1622.08 and is considered advantageous due to its pullback support characteristics. Furthermore, the 2nd support at 1542.18 is also seen as valuable because it represents a swing low support along with a 78.60% Fibonacci Retracement.
On the resistance side, the 1st resistance level at 1695.95 is noteworthy as it represents an overlap resistance. Additionally, the 2nd resistance at 1758.64 is also significant due to its overlap resistance characteristics.
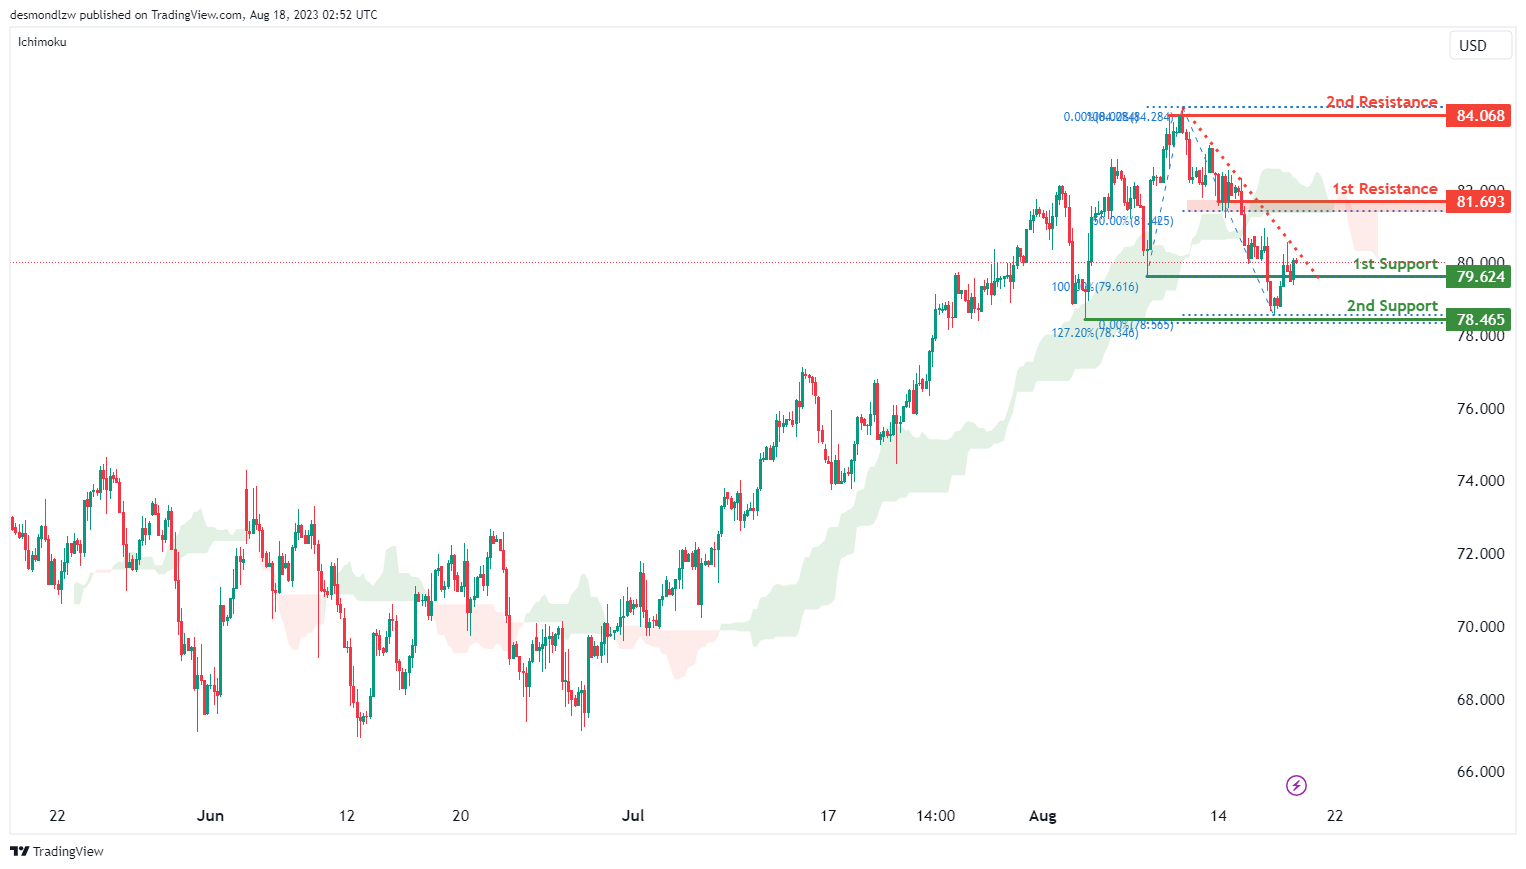
WTI/USD:
The WTI/USD chart is currently displaying a bearish momentum, suggesting a prevailing downward trend. This bearish momentum is supported by the price being below a significant descending trend line and also below the Ichimoku cloud.
Given this bearish momentum, there is a potential scenario where the price could continue its downward movement towards the 1st support level at 79.62 which is identified as an overlap support. The 2nd support at 78.47 is identified as an overlap support that aligns with the 127.20% Fibonacci extension level.
To the upside, the 1st resistance level at 81.69 is identified as a pullback resistance that aligns close to the 50.0% Fibonacci retracement level. Additionally, the 2nd resistance at 84.07 is notable for being a swing-high resistance.
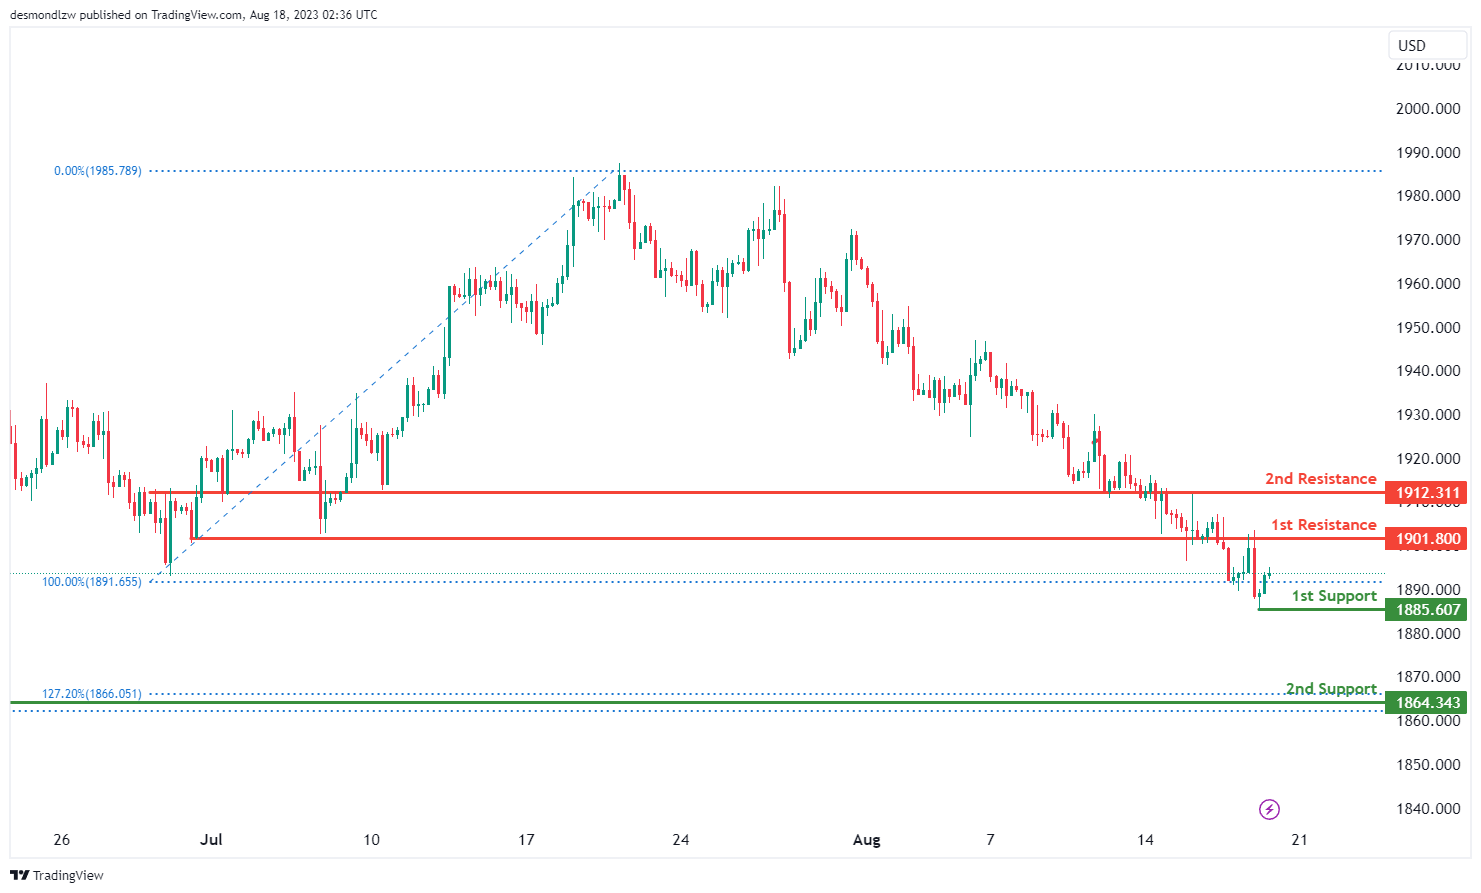
XAU/USD (GOLD):
The XAUUSD chart currently demonstrates a bearish momentum, indicating a prevailing downward trend.
Considering this bearish momentum, there is a possibility that the price might experience a temporary upward movement towards the 1st resistance level in the short term before reversing direction and dropping towards the 1st support.
The significance of the 1st support level at 1885.60 lies in its role as a swing low support. Similarly, the 2nd support at 1864.34 is reinforced as a pullback support, and its importance is further highlighted by its alignment with a 127.20% Fibonacci Extension.
Conversely, the 1st resistance level at 1901.80 is noted as an overlap resistance, possibly acting as a temporary barrier for the price during its upward movement. Furthermore, the presence of a 2nd resistance at 1912.31 adds to the potential resistance zones, where the price might face hurdles in its upward trajectory.


