
DXY:
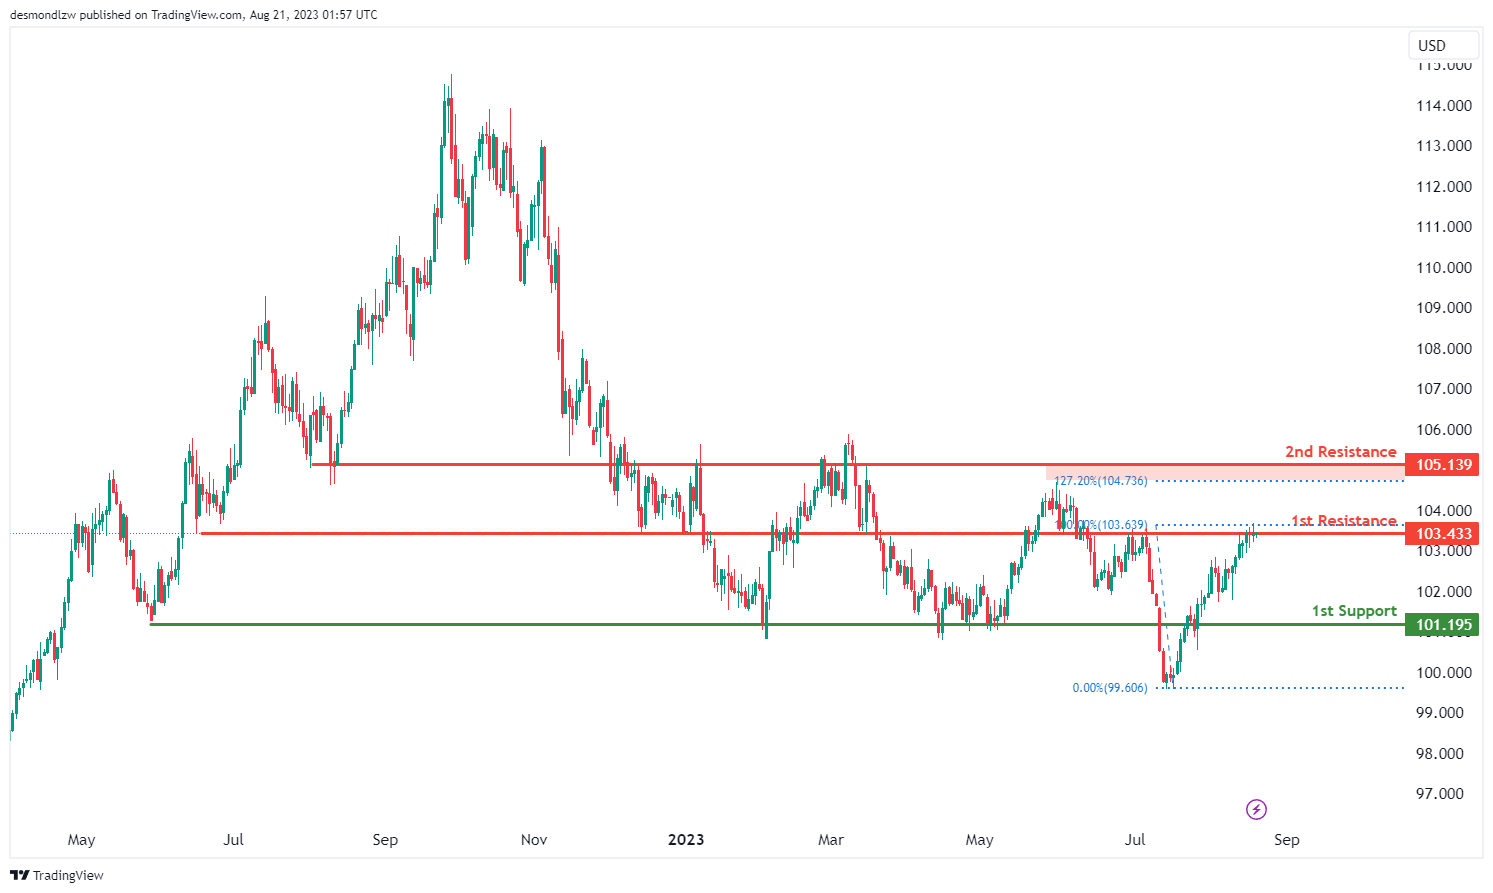
The DXY chart currently displays a bearish momentum, suggesting a prevailing downward trend.
Within this context, there’s a potential scenario where the price could experience a bearish reaction upon reaching the 1st resistance level at 103.43. This level is significant as an overlap resistance, potentially causing a downward movement.
On the support side, the 1st support at 101.19 gains importance due to its classification as an overlap support. It could potentially provide a floor for any potential price decline.
Moreover, the 2nd resistance level at 105.13 is noted as an overlap resistance and is further reinforced by its alignment with a 127.20% Fibonacci Extension, adding to its potential as a resistance level.
EUR/USD:
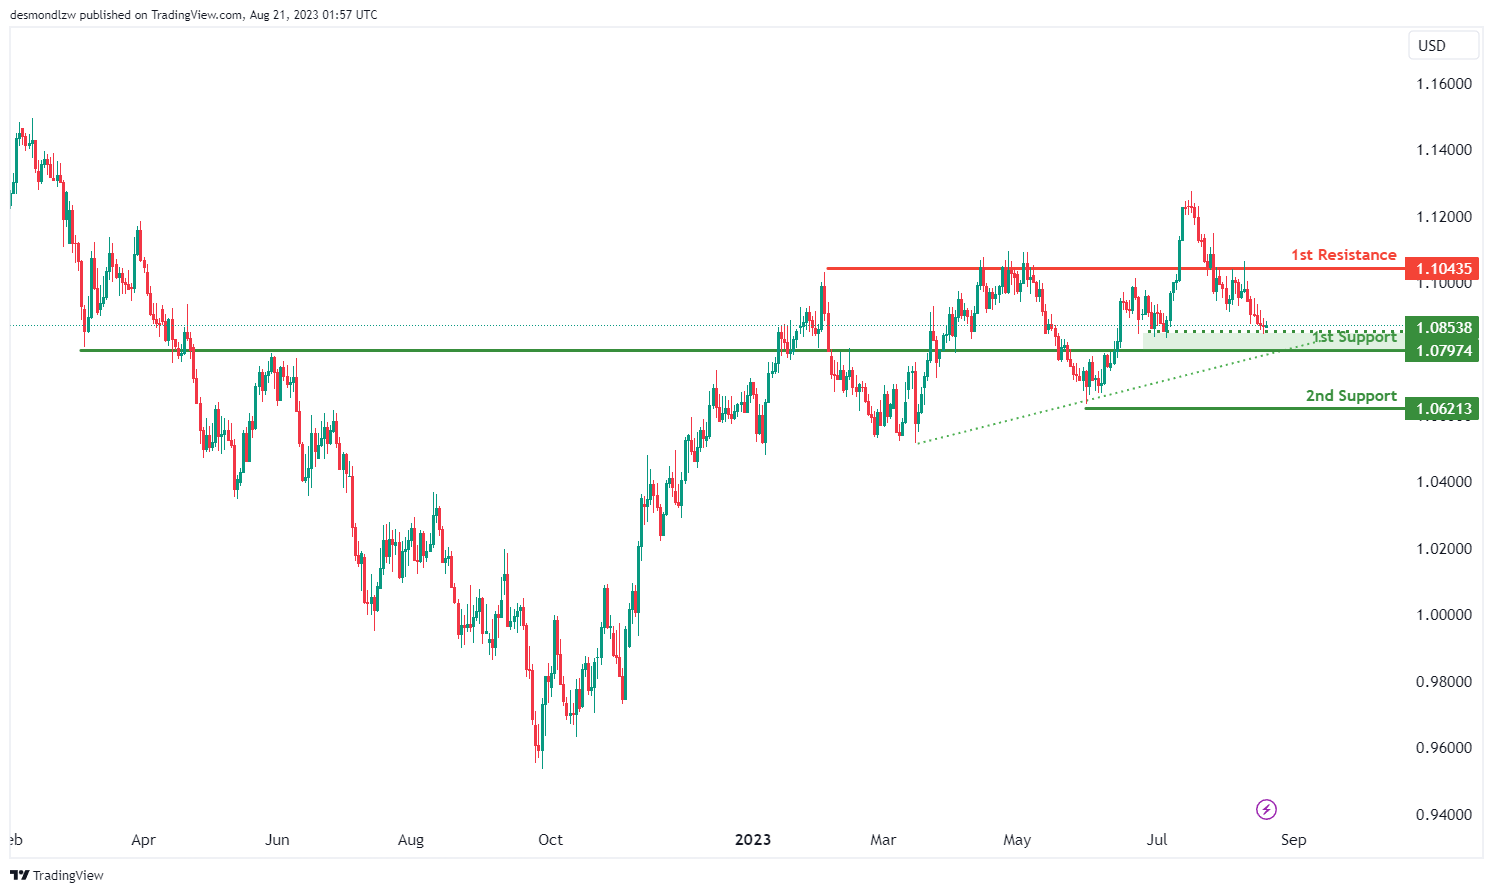
The EUR/USD chart is currently exhibiting a bullish momentum, with the presence of a major ascending trend line suggesting the potential for further upward movement.
Within this momentum context, there’s a potential scenario where the price could experience a bullish rebound upon reaching the 1st support level at 1.0797, possibly driving it towards the 1st resistance at 1.1043. The significance of the 1st support at 1.0797 lies in its role as a pullback support, potentially serving as a foundation for a potential price increase. Similarly, the identification of the 2nd support at 1.0621 as a swing low support adds to its significance.
Additionally, the intermediate support level at 1.0853 gains importance due to its classification as a multi-swing low support. This collective analysis contributes to the overall bullish outlook.
EUR/JPY:
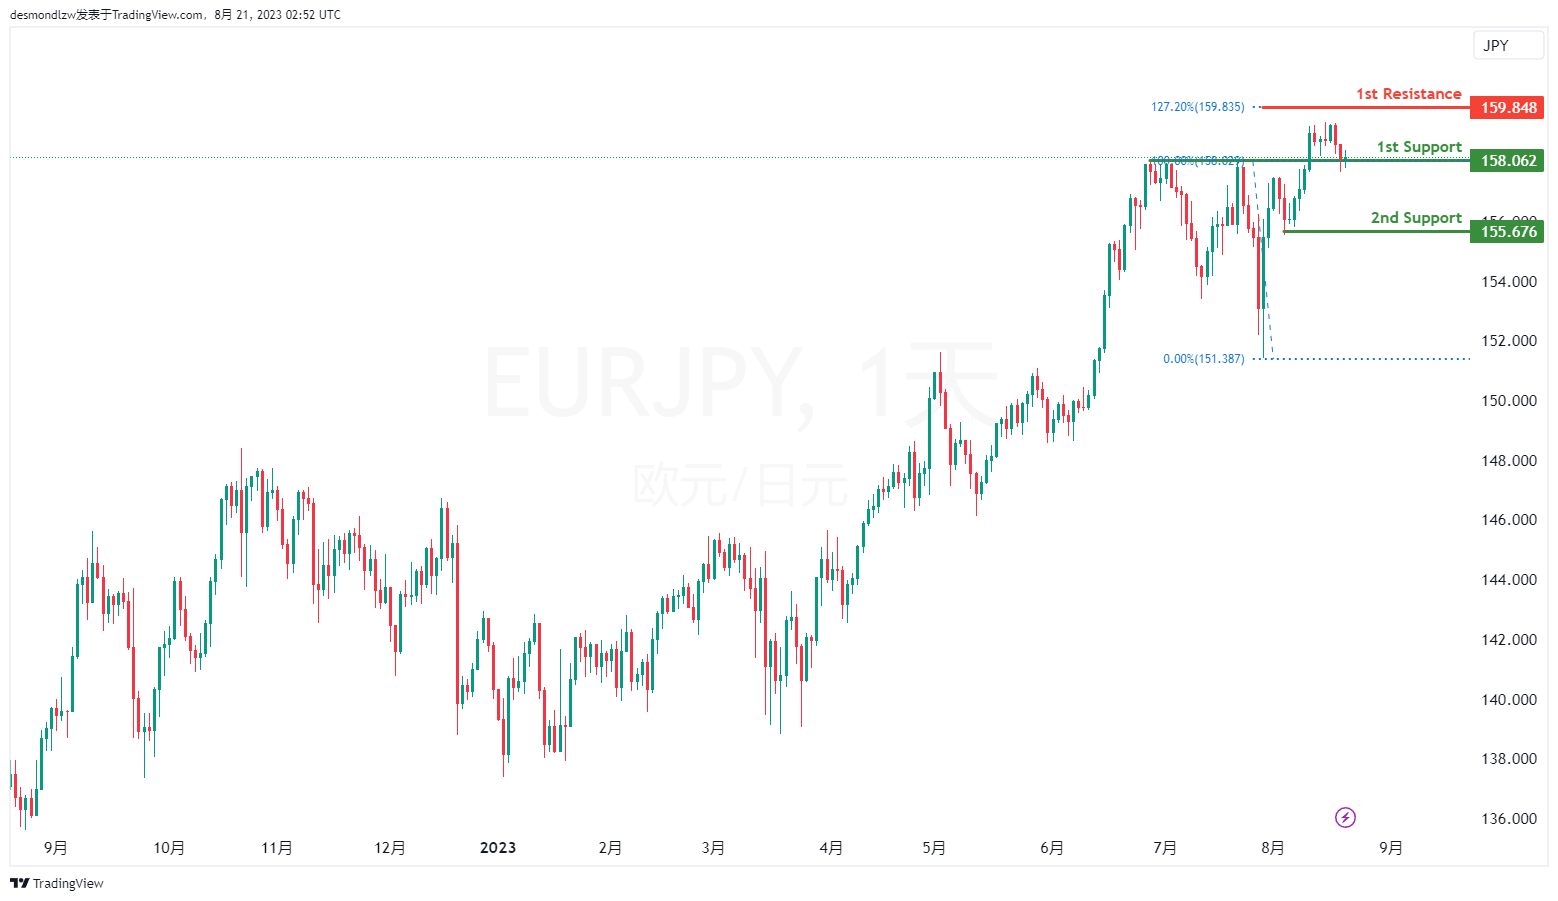
The EUR/JPY chart indicates a bullish overall momentum. There is a potential for a bullish bounce off the 1st support level, leading the price towards the 1st resistance.
The 1st support is located at 158.06 and is considered advantageous due to its pullback support characteristics. Additionally, the 2nd support at 155.67 is seen as valuable because it represents a swing low support.
On the resistance side, the 1st resistance level at 159.84 is significant due to its association with the 127.20% Fibonacci Extension.
EUR/GBP:
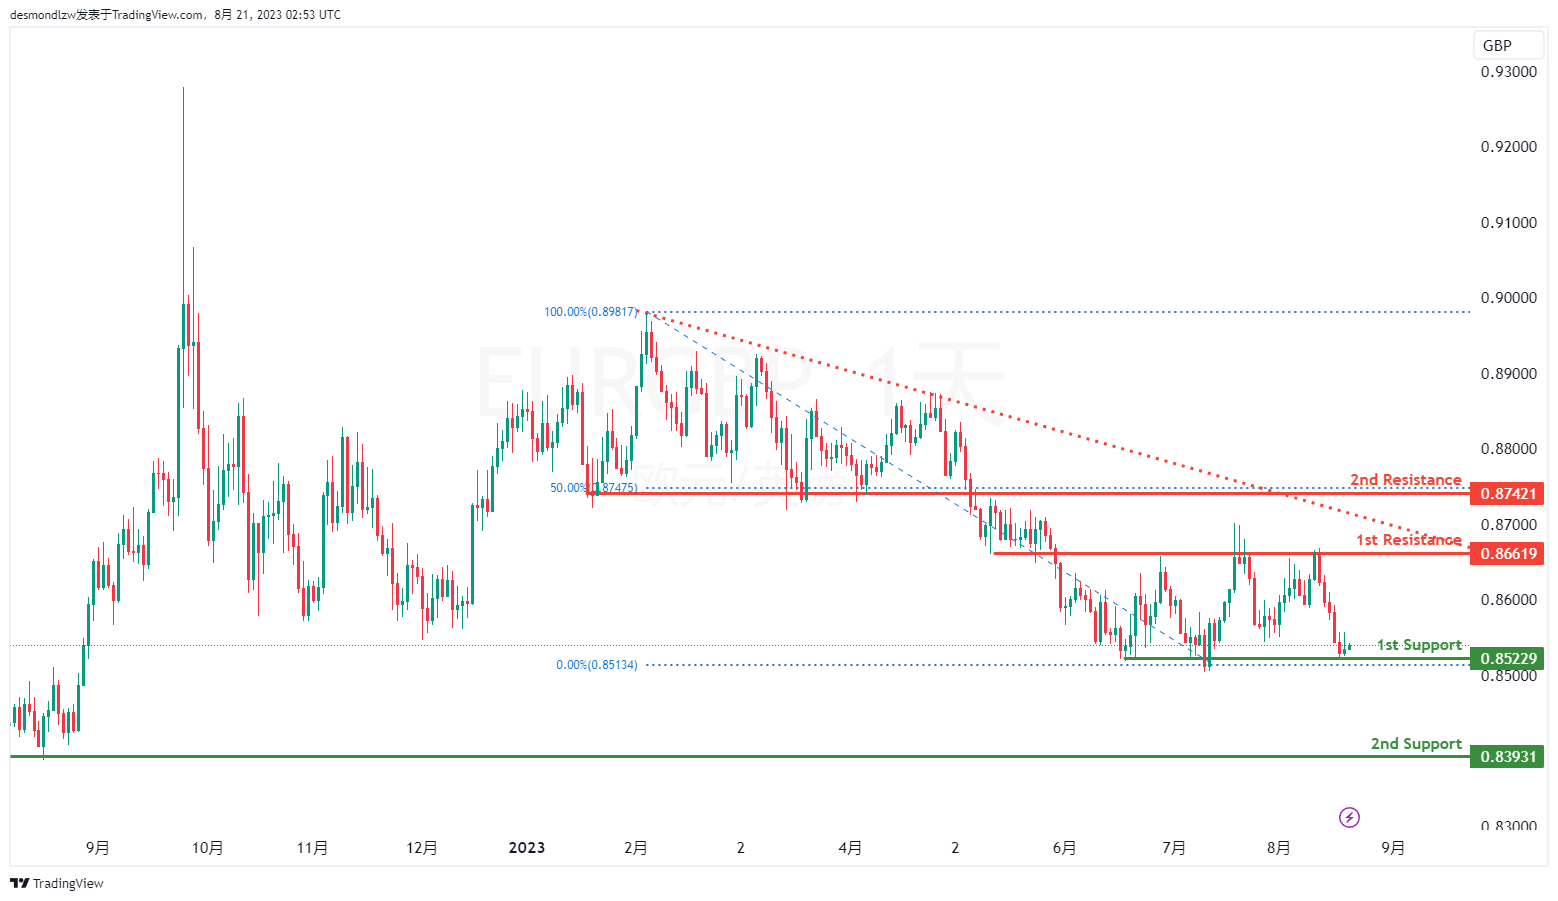
The EUR/GBP chart indicates a bullish overall momentum. There is a potential for a bullish bounce off the 1st support level, leading the price towards the 1st resistance.
The 1st support is positioned at 0.8522 and is considered advantageous due to its multi-swing low support characteristics. Additionally, the 2nd support at 0.8393 is valuable as it represents an overlap support.
On the resistance side, the 1st resistance level at 0.8661 is noteworthy as it represents a pullback resistance. Furthermore, the 2nd resistance at 0.8742 is also significant due to its pullback resistance characteristics, along with its association with the 50% Fibonacci Retracement.
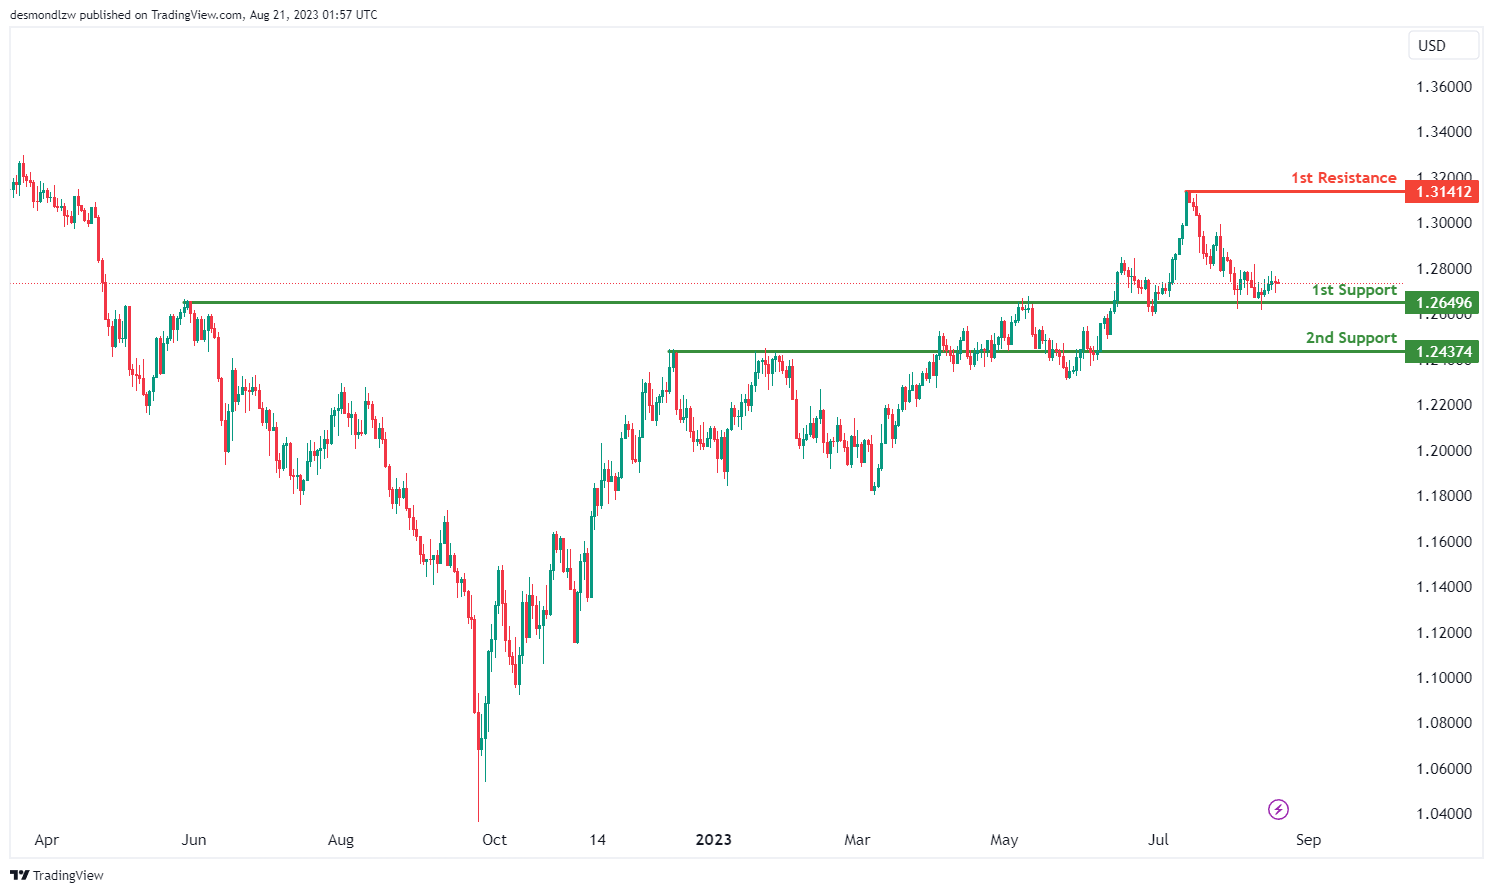
GBP/USD:
The GBP/USD chart currently displays a bullish momentum, indicating a prevalent upward trend.
Within this context, there’s a potential scenario in which the price could experience a bullish rebound upon reaching the 1st support level at 1.2649, potentially leading to an upward movement towards the 1st resistance level at 1.3141. The 1st support at 1.2649 holds significance as an overlap support, possibly providing a foundation for a potential upward price reversal. Similarly, the 2nd support at 1.2437 is noted as an overlap support, reinforcing its role in supporting the price.
On the other hand, the 1st resistance level at 1.3141 is considered a swing high resistance, which could pose a potential obstacle to upward price movement.
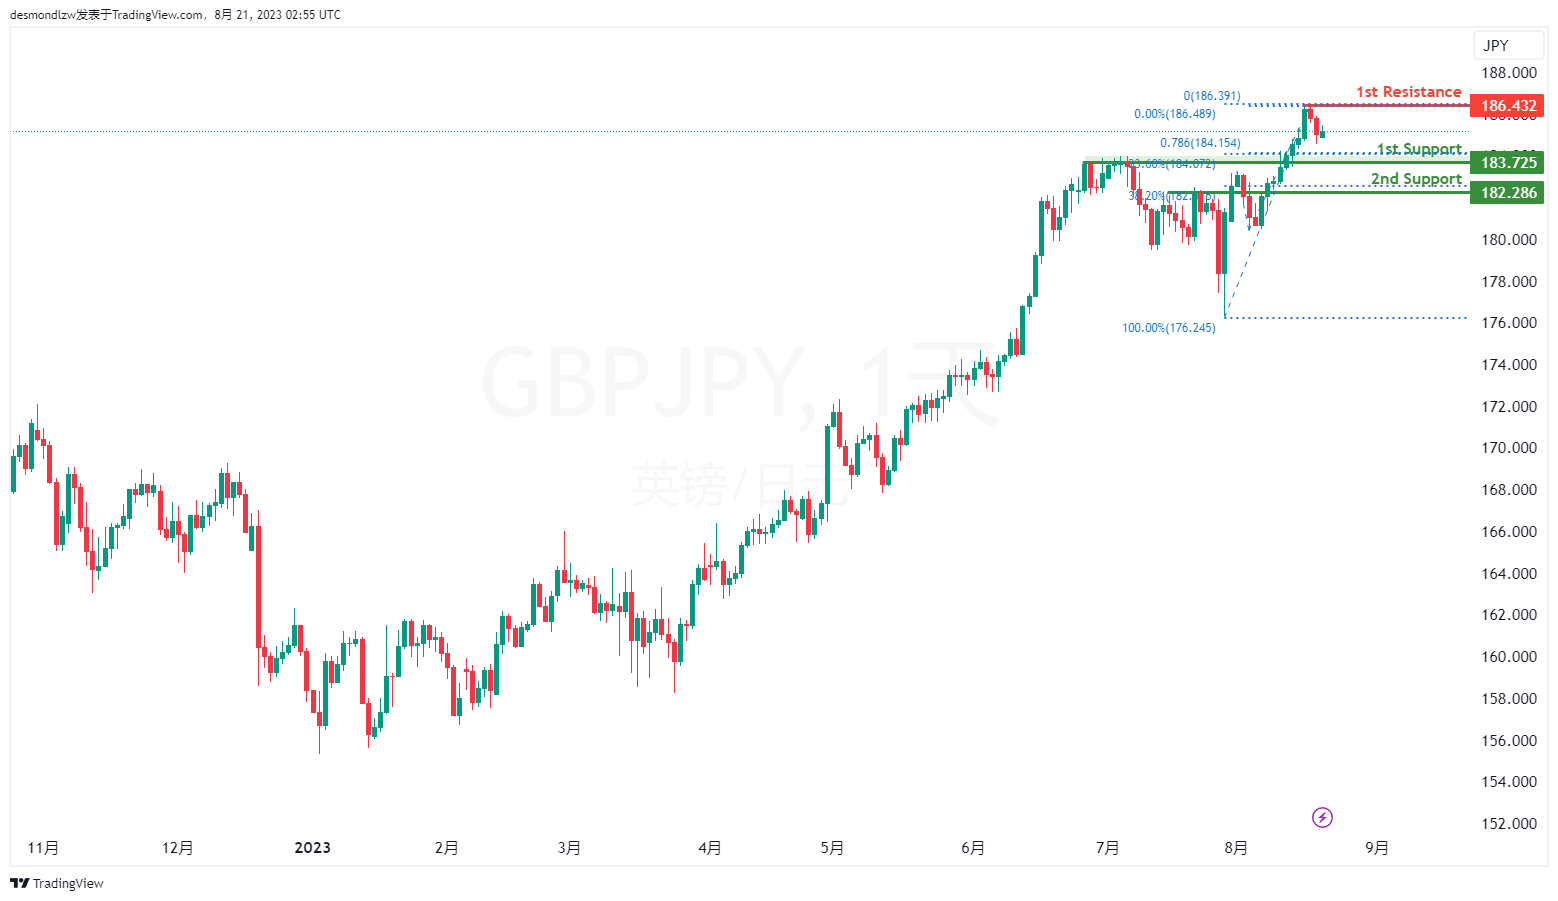
GBP/JPY:
The GBP/JPY chart indicates a bearish overall momentum. There is a potential for a bearish continuation towards the 1st support level.
The 1st support is located at 183.72 and is considered advantageous due to its pullback support characteristics. Additionally, the 1st support exhibits a Fibonacci confluence with a 78.60% Fibonacci Projection and a 23.60% Fibonacci Retracement.
Furthermore, the 2nd support at 182.28 is seen as valuable because it represents an overlap support, along with a 38.20% Fibonacci Retracement.
On the resistance side, the 1st resistance level at 186.43 is noteworthy as it represents a swing high resistance.
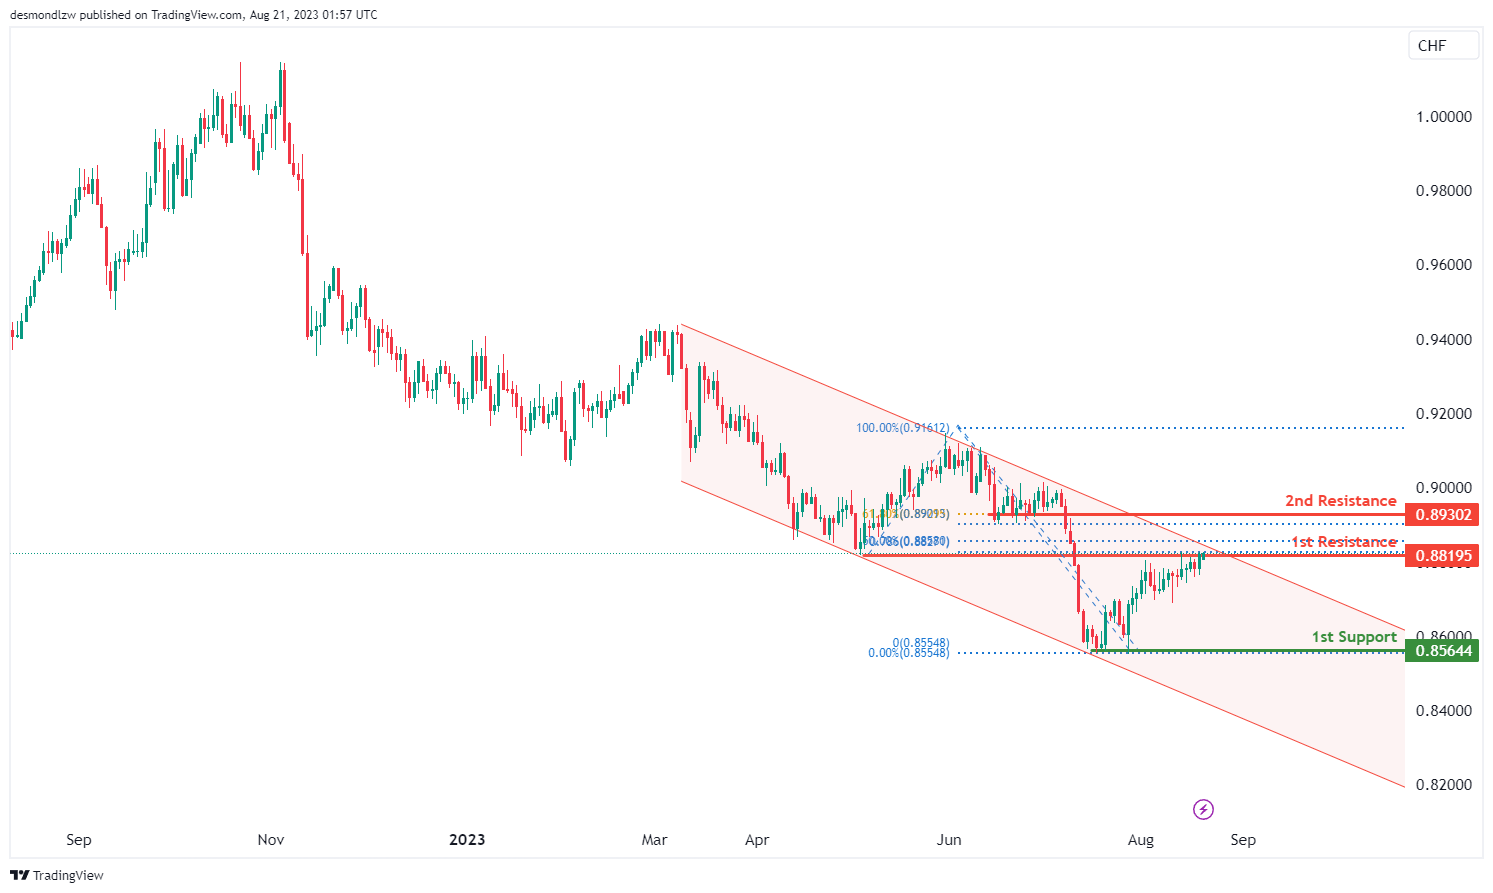
USD/CHF:
The USD/CHF chart’s overall momentum reflects a bearish trend, which is supported by the fact that the price is confined within a descending channel, indicating a persistent downward movement.
Within this context, there is a potential scenario in which the price reacts bearishly upon reaching the 1st resistance level at 0.8819, possibly resulting in a drop towards the 1st support level at 0.8564. The significance of the 1st support lies in its identification as a multi-swing low support, suggesting a potential area where the price might find temporary stability.
Conversely, the 1st resistance level at 0.8819 holds importance as an overlap resistance, potentially acting as a barrier to upward price movement. Further reinforcing potential resistance, the 2nd resistance at 0.8930 is noted as a pullback resistance and aligns with a 61.80% Fibonacci retracement level, which adds to its significance.
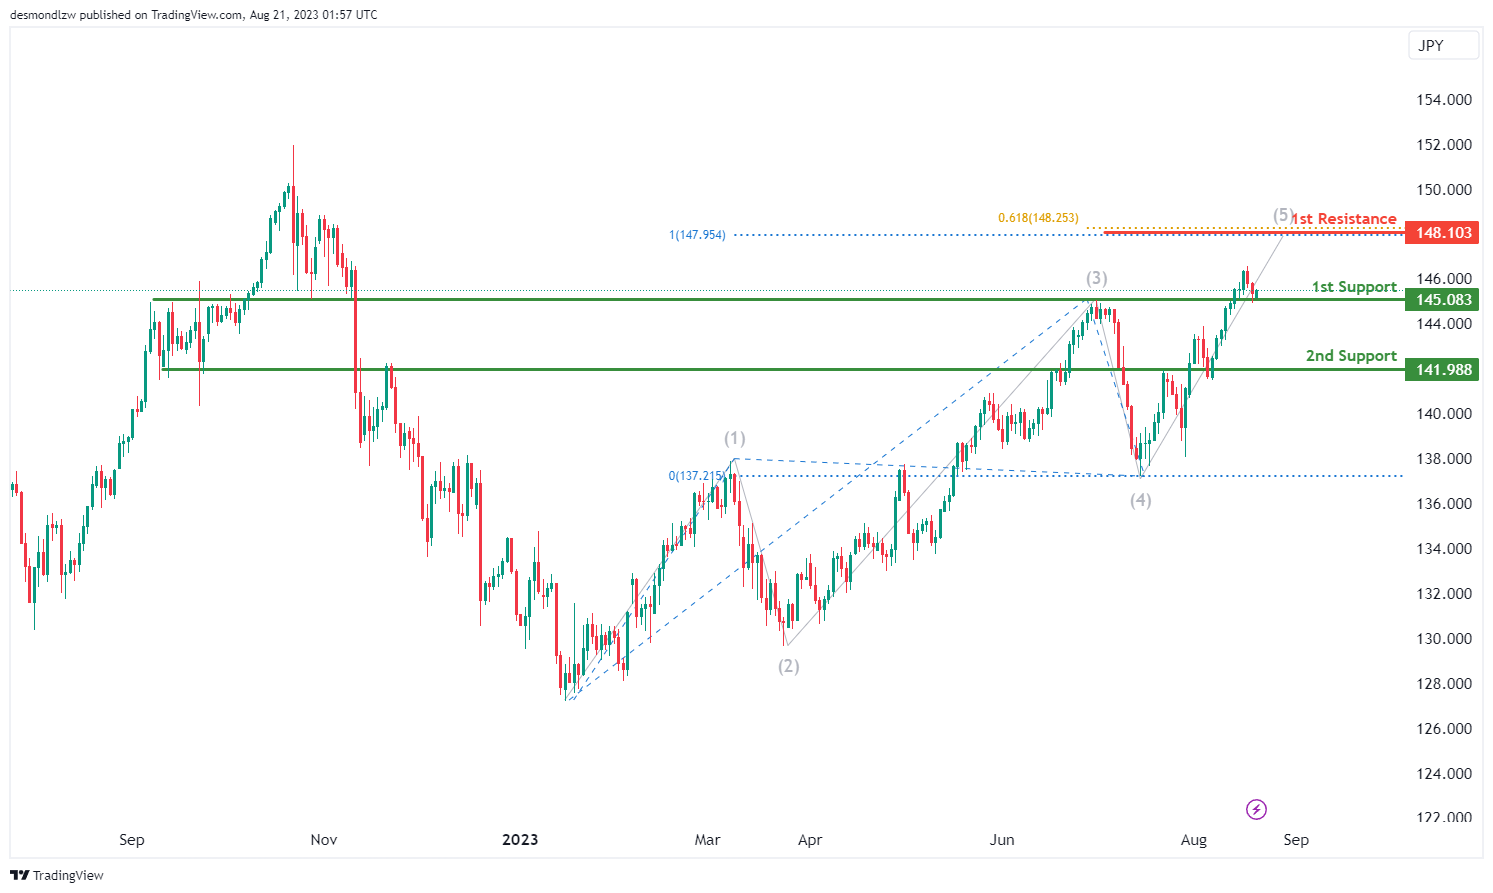
USD/JPY:
The USD/JPY chart currently exhibits a bullish momentum, suggesting a prevailing upward trend.
In light of this momentum, a potential scenario arises in which the price experiences a bullish rebound upon reaching the 1st support level at 145.08, possibly leading to an upward movement towards the 1st resistance at 148.10.
The significance of the 1st support at 145.08 is attributed to its identification as an overlap support, indicating a potential area where buyers might step in to drive the price higher. Additionally, the 2nd support level at 141.98 reinforces the support structure as a pullback support, potentially offering a stronger foundation for the price.
On the other side, the 1st resistance at 148.10 gains importance due to its alignment with both a 61.80% Fibonacci Projection and a 100% Fibonacci Projection. This confluence of Fibonacci levels enhances its potential as a significant resistance level where selling pressure might increase.
USD/CAD:
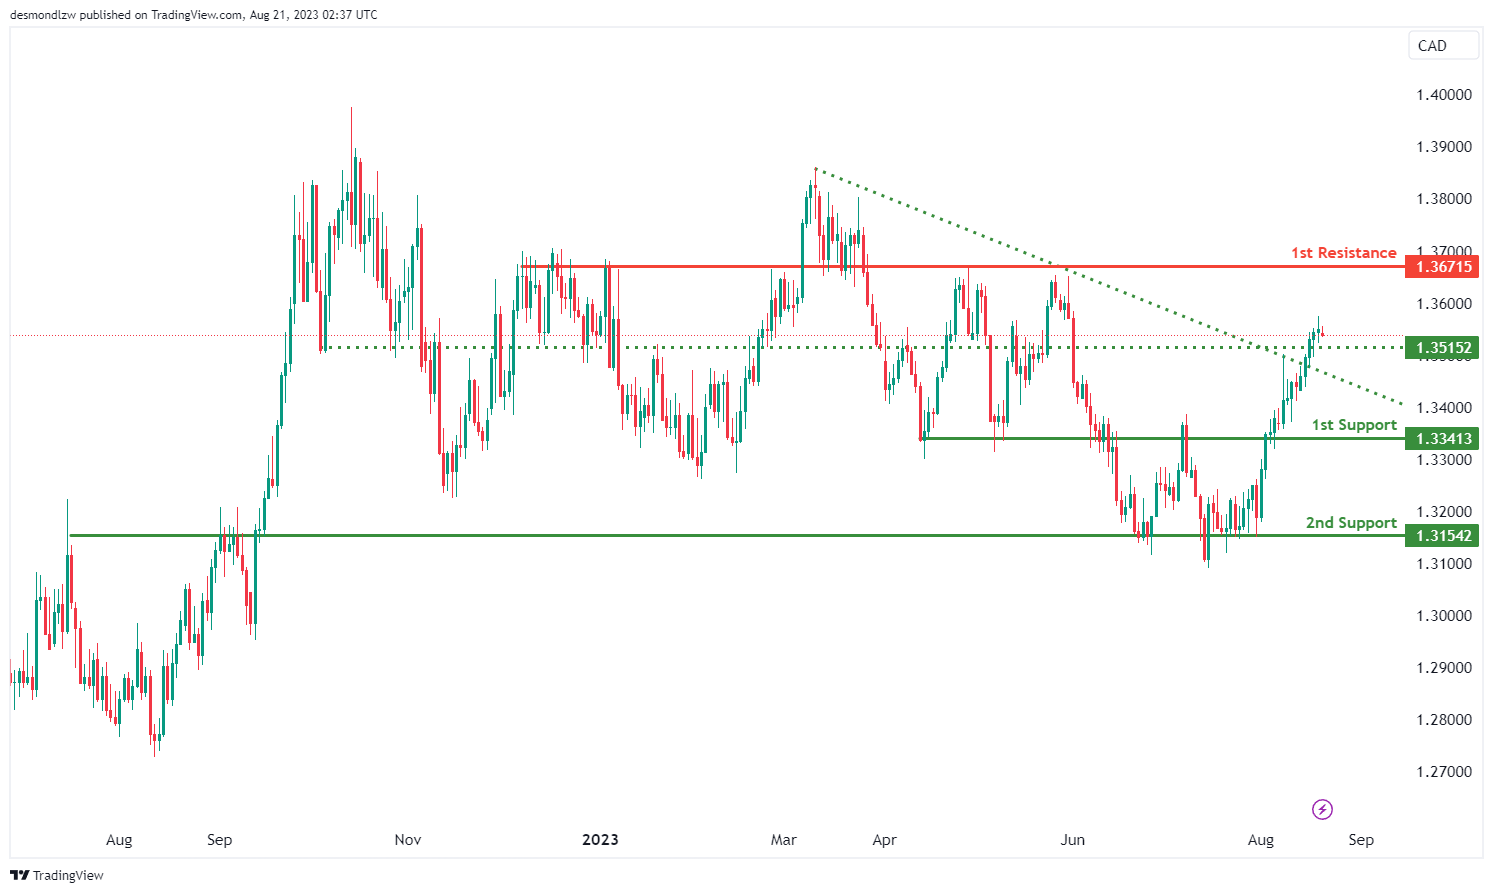
The USD/CAD chart currently shows a bullish momentum, indicating a potential upward trend.
Contributing to this momentum is the fact that the price has broken above a descending resistance line, suggesting the potential for a bullish move.
In the context of this bullish momentum, there’s a possibility that the price could continue its upward movement towards the 1st resistance level at 1.3671.
The importance of the 1st support level at 1.3341 is due to its designation as an overlap support. Similarly, the 2nd support at 1.3154 reinforces the support structure as another overlap support.
Additionally, the intermediate support at 1.3515 strengthens the pullback support zone, potentially providing a significant area for price to find support.
AUD/USD:
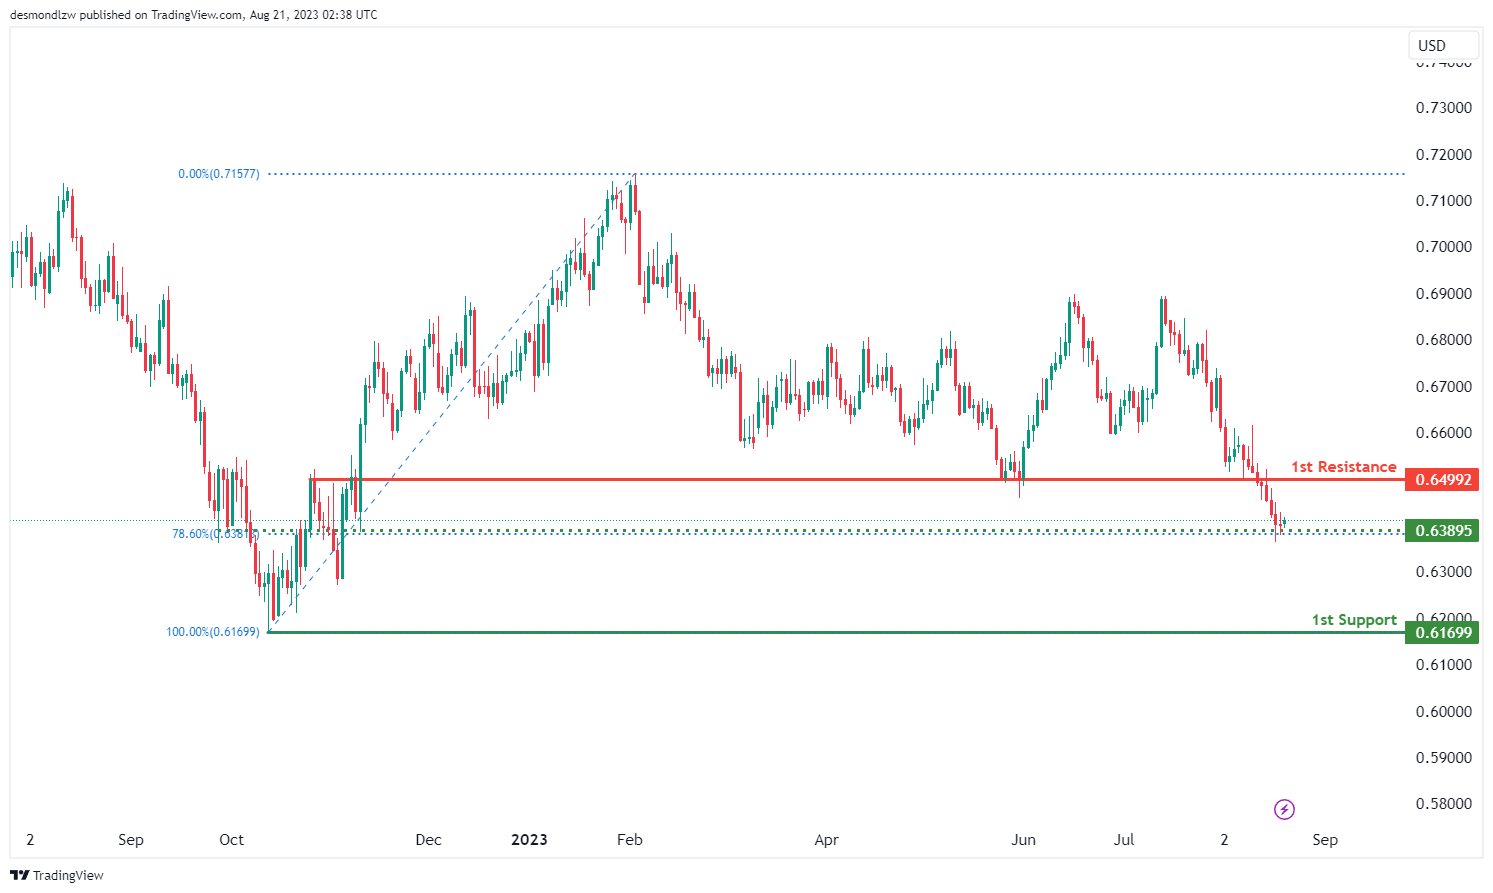
The AUD/USD chart is currently displaying a bearish momentum, indicating a potential downward trend.
Considering this bearish momentum, there’s a possibility that the price might continue its downward movement towards the 1st support level at 0.6169, which is bolstered by its role as a swing low support.
Furthermore, the intermediate support at 0.6389 adds to the support structure, as it aligns with a pullback support level and the 78.60% Fibonacci Retracement.
On the resistance side, the 1st resistance level at 0.6499 is significant due to its categorization as a pullback resistance.
These technical aspects help to provide insight into the potential price movement dynamics of the AUD/USD chart, highlighting key support and resistance levels.
NZD/USD
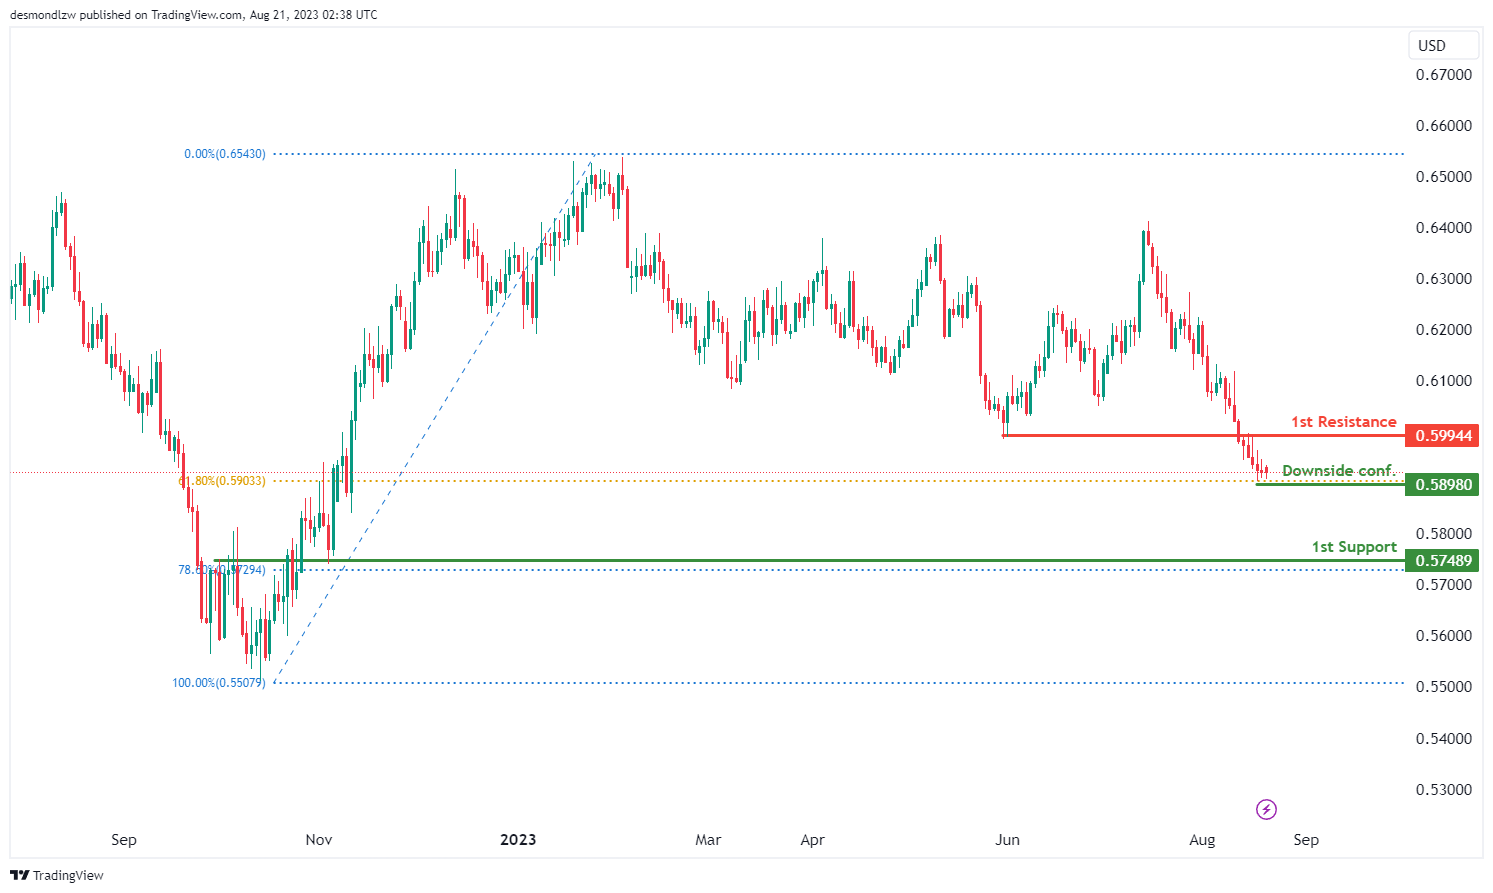
The NZD/USD chart currently displays a bearish momentum, indicating a prevailing downward trend in the market.
Considering this bearish momentum, there’s a potential scenario in which the price continues its downward movement towards the 1st support level at 0.5748. This level gains significance as a swing low support, indicating a possible area of price consolidation or reversal.
Additionally, the intermediate support at 0.5898 that aligns with the 61.8% Fibonacci retracement reinforces the potential support structure by aligning with a swing low support as well. Waiting for downside confirmation if the body closes below this level could provide further insight.
On the resistance side, the 1st resistance level at 0.5994 is notable due to its classification as an overlap resistance.
DJ30:
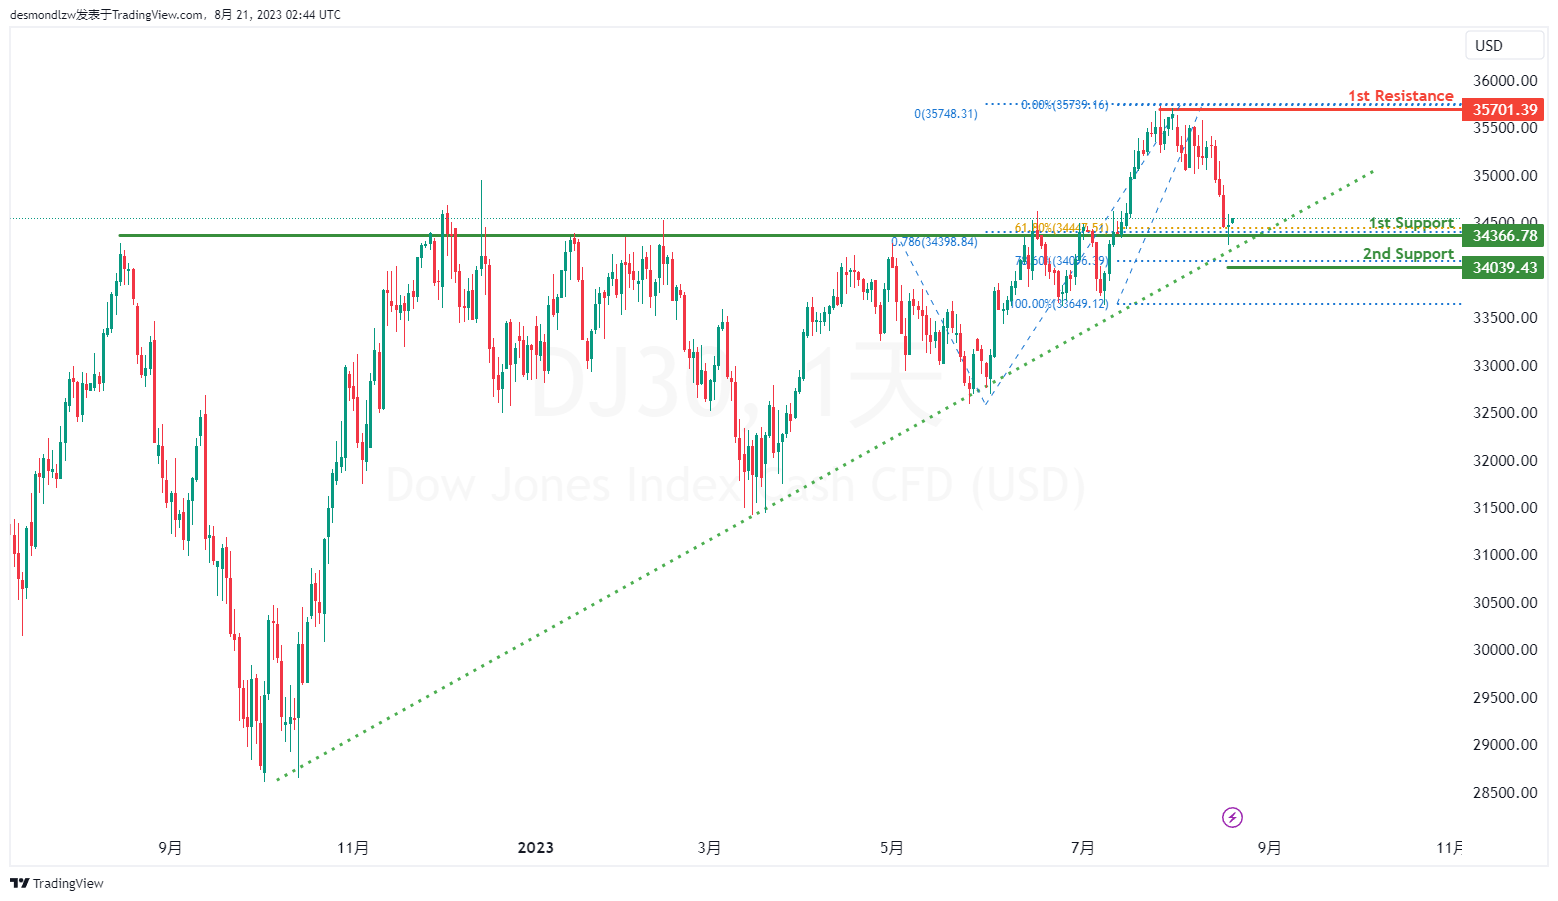
The DJ30 chart indicates a bullish overall momentum, and this is further supported by the fact that the price is above a major ascending trend line, which suggests the potential for further bullish momentum. There is a possibility for a bullish bounce off the 1st support level, leading the price towards the 1st resistance.
The 1st support is located at 34366.78 and is considered advantageous due to its overlap support characteristics, along with a Fibonacci confluence of a 61.80% Fibonacci Retracement and a 78.60% Fibonacci Projection. Additionally, the 2nd support at 34039.43 is also seen as valuable due to its association with a 78.60% Fibonacci Retracement.
On the resistance side, the 1st resistance level at 35701.39 is noteworthy as it represents a swing high resistance.
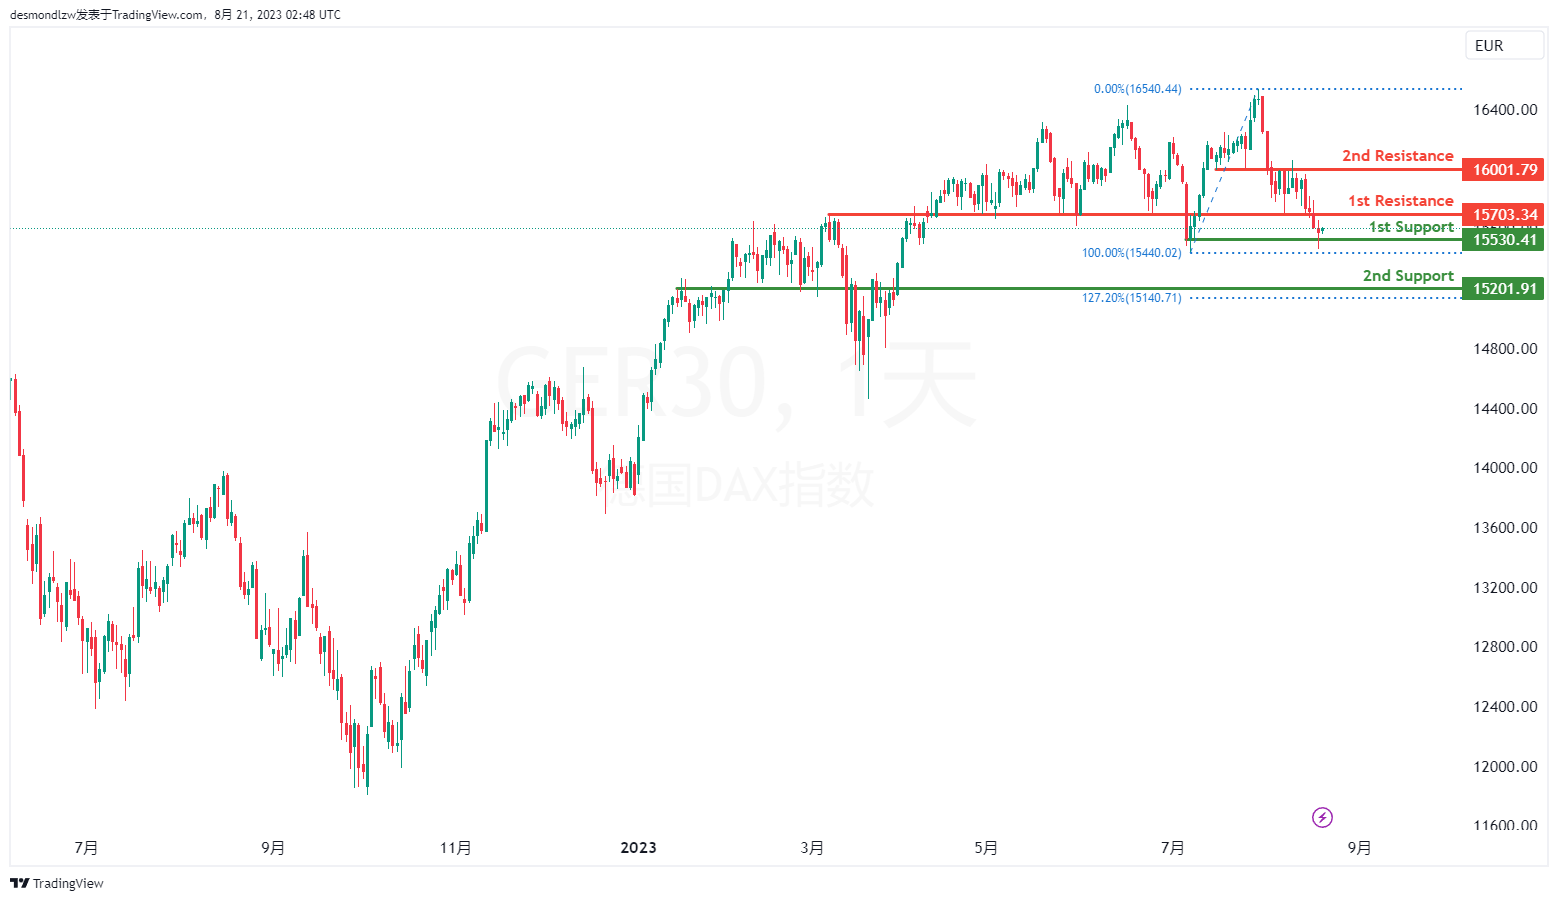
GER30:
The GER30 chart indicates a bullish overall momentum. There is a potential for a bullish bounce off the 1st support level, leading the price towards the 1st resistance.
The 1st support is situated at 15530.41 and is considered advantageous due to its swing low support characteristics. Furthermore, the 2nd support at 15201.91 is also seen as valuable because it represents an overlap support.
On the resistance side, the 1st resistance level at 15703.34 is noteworthy as it represents an overlap resistance. Additionally, the 2nd resistance at 16001.79 is also significant due to its pullback resistance characteristics.
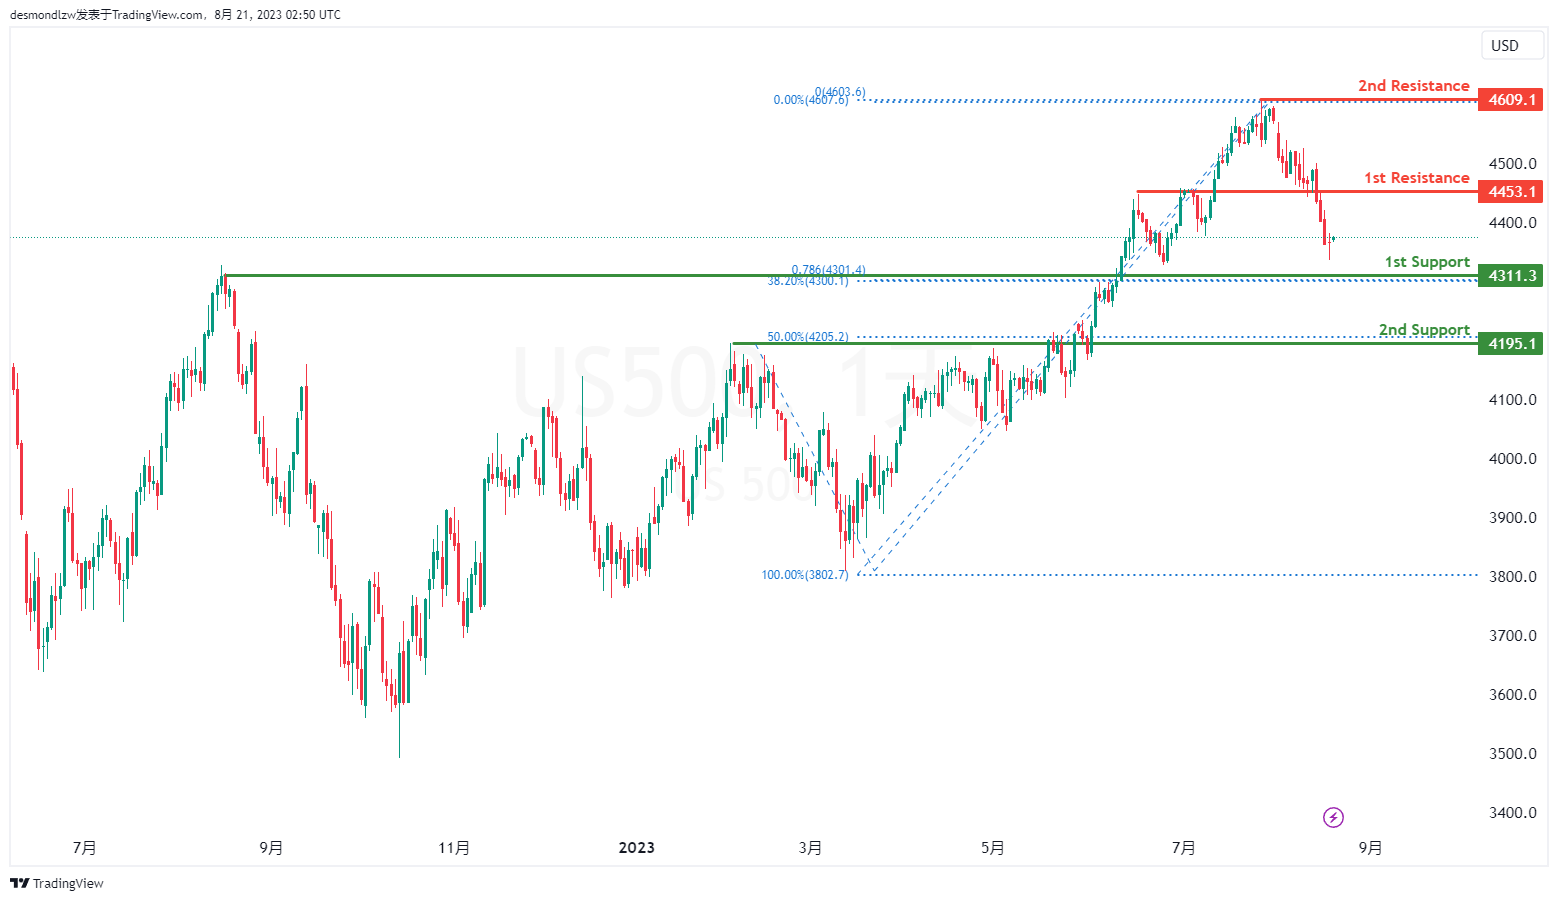
US500
The US500 chart indicates a bearish overall momentum. There is a potential for a bearish continuation towards the 1st support level.
The 1st support is positioned at 4311.30 and is considered advantageous due to its pullback support characteristics. Furthermore, the 1st support exhibits a Fibonacci confluence with a 78.60% Fibonacci Projection and a 38.20% Fibonacci Retracement.
Additionally, the 2nd support at 4195.10 is also seen as valuable due to its pullback support attributes, as well as its association with a 50% Fibonacci Retracement.
On the resistance side, the 1st resistance level at 4453.10 is noteworthy as it represents an overlap resistance. Furthermore, the 2nd resistance at 4609.10 is significant due to its swing high resistance characteristics.
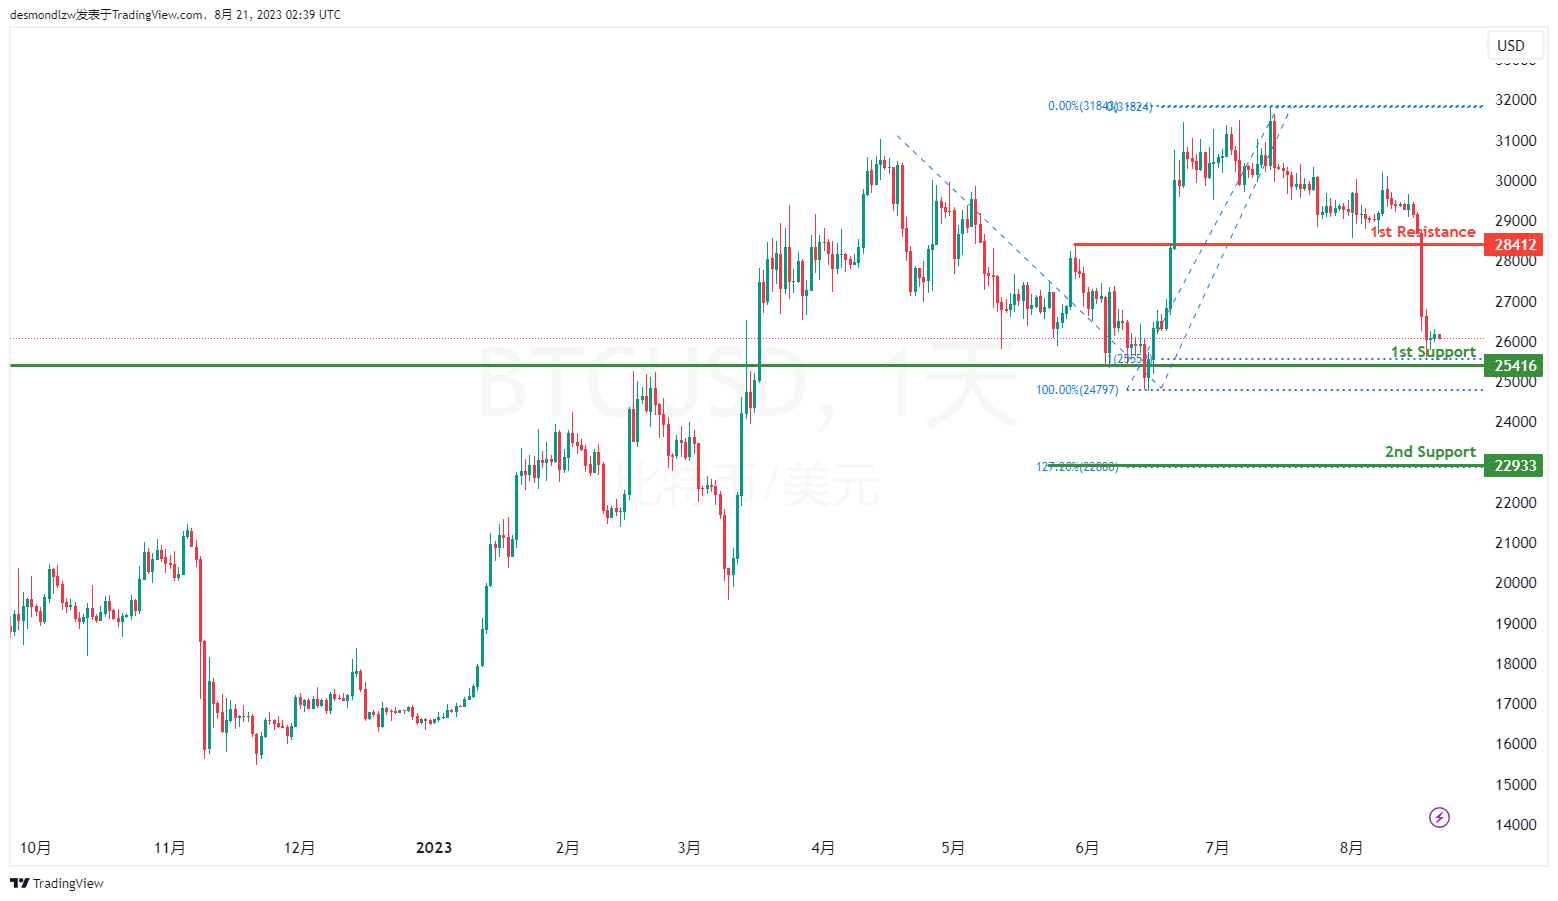
BTC/USD:
The BTC/USD chart indicates a bearish overall momentum. There is a potential for a bearish continuation towards the 1st support level.
The 1st support is located at 25416 and is considered advantageous due to its overlap support characteristics along with a 100% Fibonacci Projection. Furthermore, the 2nd support at 22933 is also seen as significant due to its association with the 127.20% Fibonacci Extension.
On the resistance side, the 1st resistance level at 28412 is noteworthy as it represents an overlap resistance.
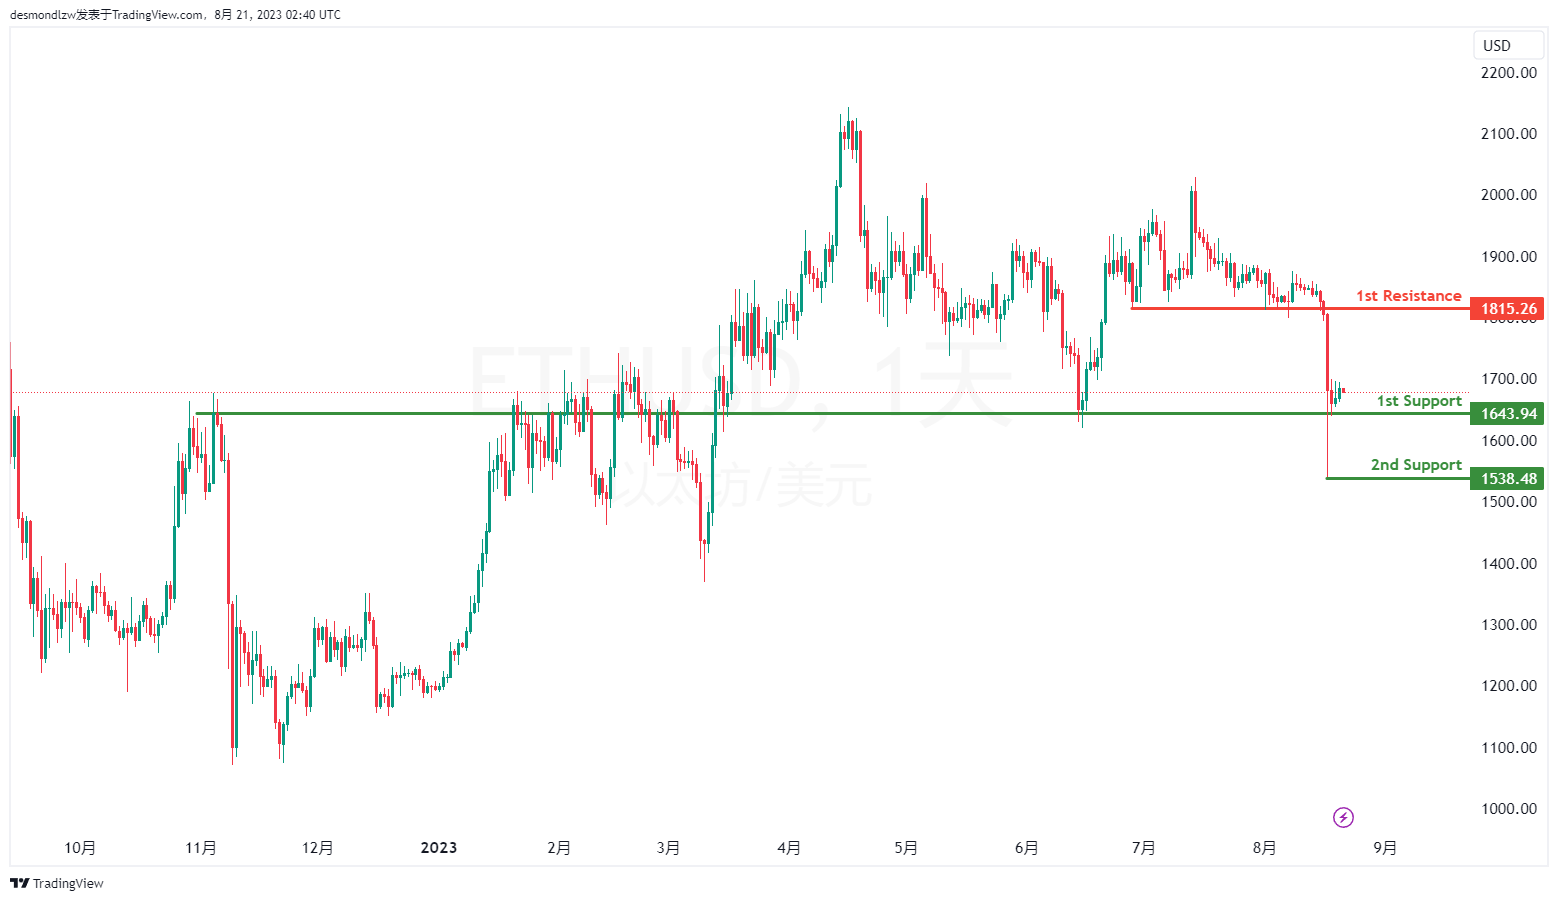
ETH/USD:
The ETH/USD chart indicates a bearish overall momentum. There is a potential for a bearish continuation towards the 1st support level.
The 1st support is positioned at 1643.94 and is considered advantageous due to its overlap support characteristics. Additionally, the 2nd support at 1538.48 is viewed as valuable because it represents a swing low support.
On the resistance side, the 1st resistance level at 1822.21 is noteworthy as it represents a pullback resistance, along with a 61.80% Fibonacci Retracement.
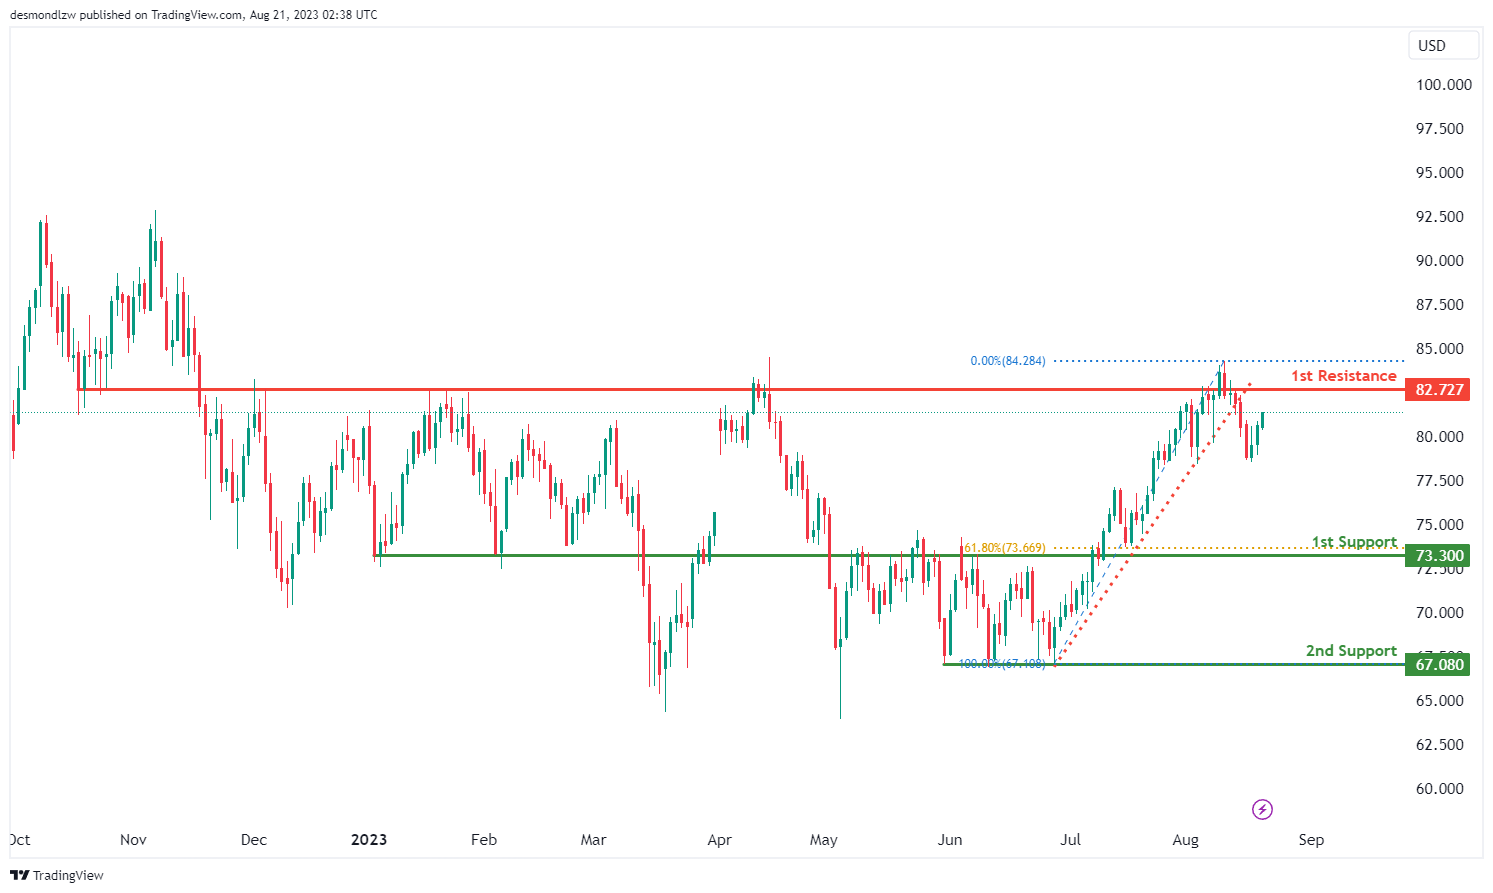
WTI/USD:
The WTI/USD chart currently exhibits a bullish momentum, indicating a prevailing upward trend in the market.
Considering this bullish momentum, there’s a possibility that the price might experience a continuation of its upward movement towards the 1st resistance level at 82.73. This level gains significance as an overlap resistance, suggesting a potential area where the price could face resistance.
On the support side, the 1st support level at 73.30 is notable due to its identification as an overlap support that aligns with the 61.80% Fibonacci retracement level. Additionally, the 2nd support level at 67.08 is reinforced by its association with multiple swing-lows, enhancing its support potential.
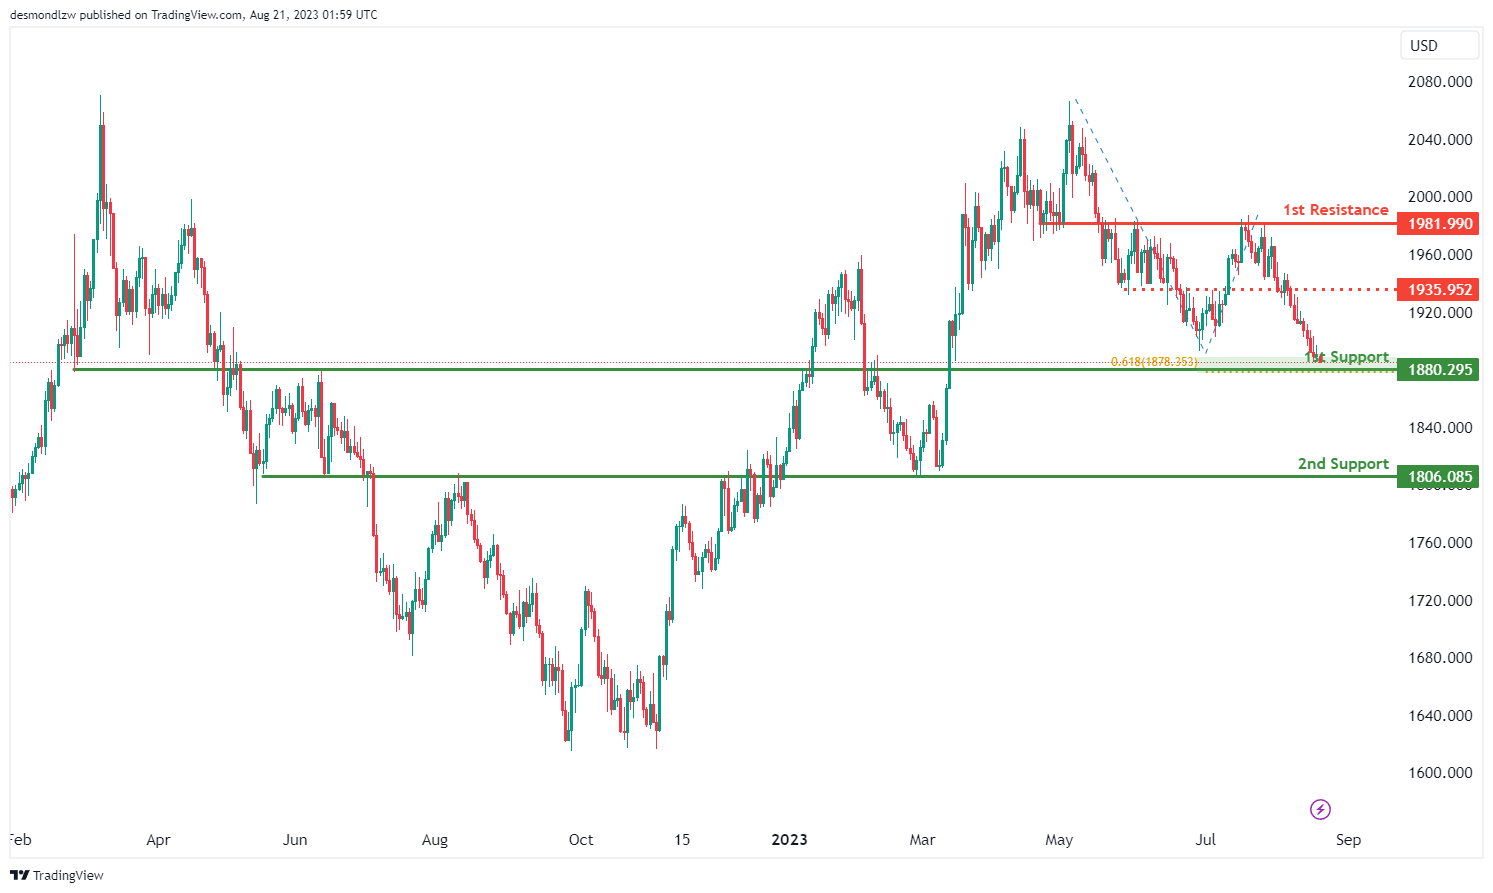
XAU/USD (GOLD):
The XAU/USD chart currently indicates a bullish momentum, signifying a prevailing upward trend.
Within this momentum context, there’s a potential scenario where the price undergoes a bullish rebound upon reaching the 1st support level at 1880.29. This rebound might drive the price towards the 1st resistance at 1981.99.
The significance of the 1st support at 1880.29 lies in its identification as a pullback support, further reinforced by its alignment with a 61.80% Fibonacci Projection. Additionally, the 2nd support level at 1806.08 adds to the support structure as an overlap support, potentially providing a strong base for price movements.
Conversely, the 1st resistance level at 1981.99 is notable due to its designation as an overlap resistance, suggesting a potential area where selling interest might arise. Similarly, the 2nd resistance at 1935.95 strengthens the resistance zone as another overlap resistance.


