
DXY:
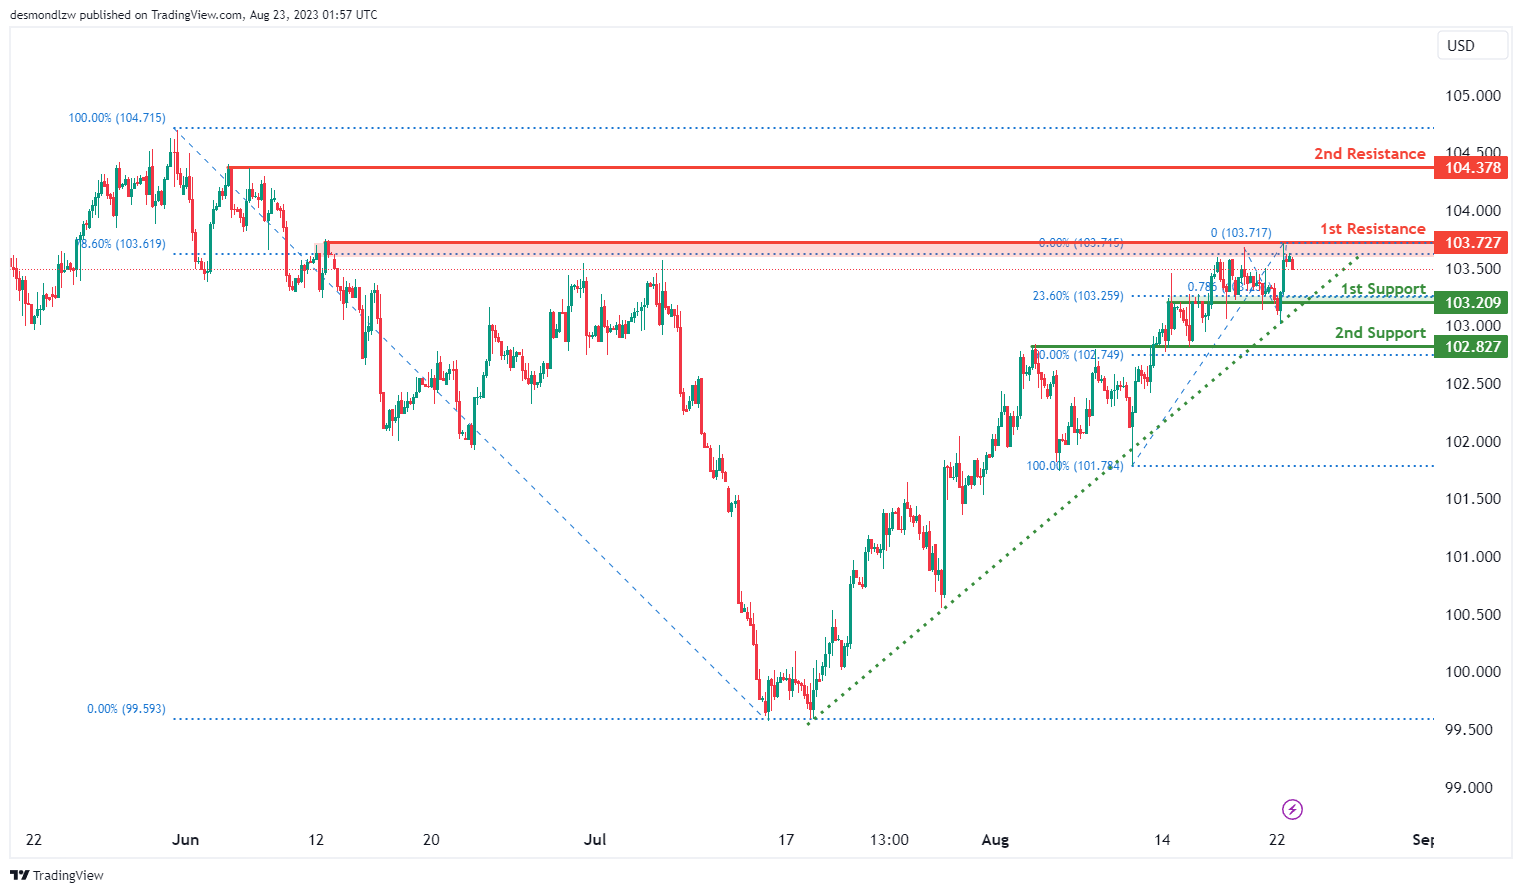
The DXY chart currently displays a bullish momentum, supported by the price being above a major ascending trend line, suggesting the potential for further upward movement.
In this context, a short-term scenario could unfold where the price drops towards the 1st support level at 103.20 before rebounding from there and rising towards the 1st resistance at 103.72.
The 1st support at 103.20 holds significance as an overlap support and aligns with a 23.60% Fibonacci Retracement level. Similarly, the 2nd support at 102.82 is identified as an overlap support and coincides with a 50% Fibonacci Retracement level.
Conversely, the 1st resistance at 103.72 is notable due to its classification as a swing high resistance and its alignment with a 78.60% Fibonacci Retracement level. Additionally, the 2nd resistance at 104.37 is recognized as a multi-swing high resistance.
This analysis collectively points to the potential for a short-term drop to the 1st support before a bounce and subsequent rise towards the 1st resistance, aligned with the overall bullish momentum.
EUR/USD:
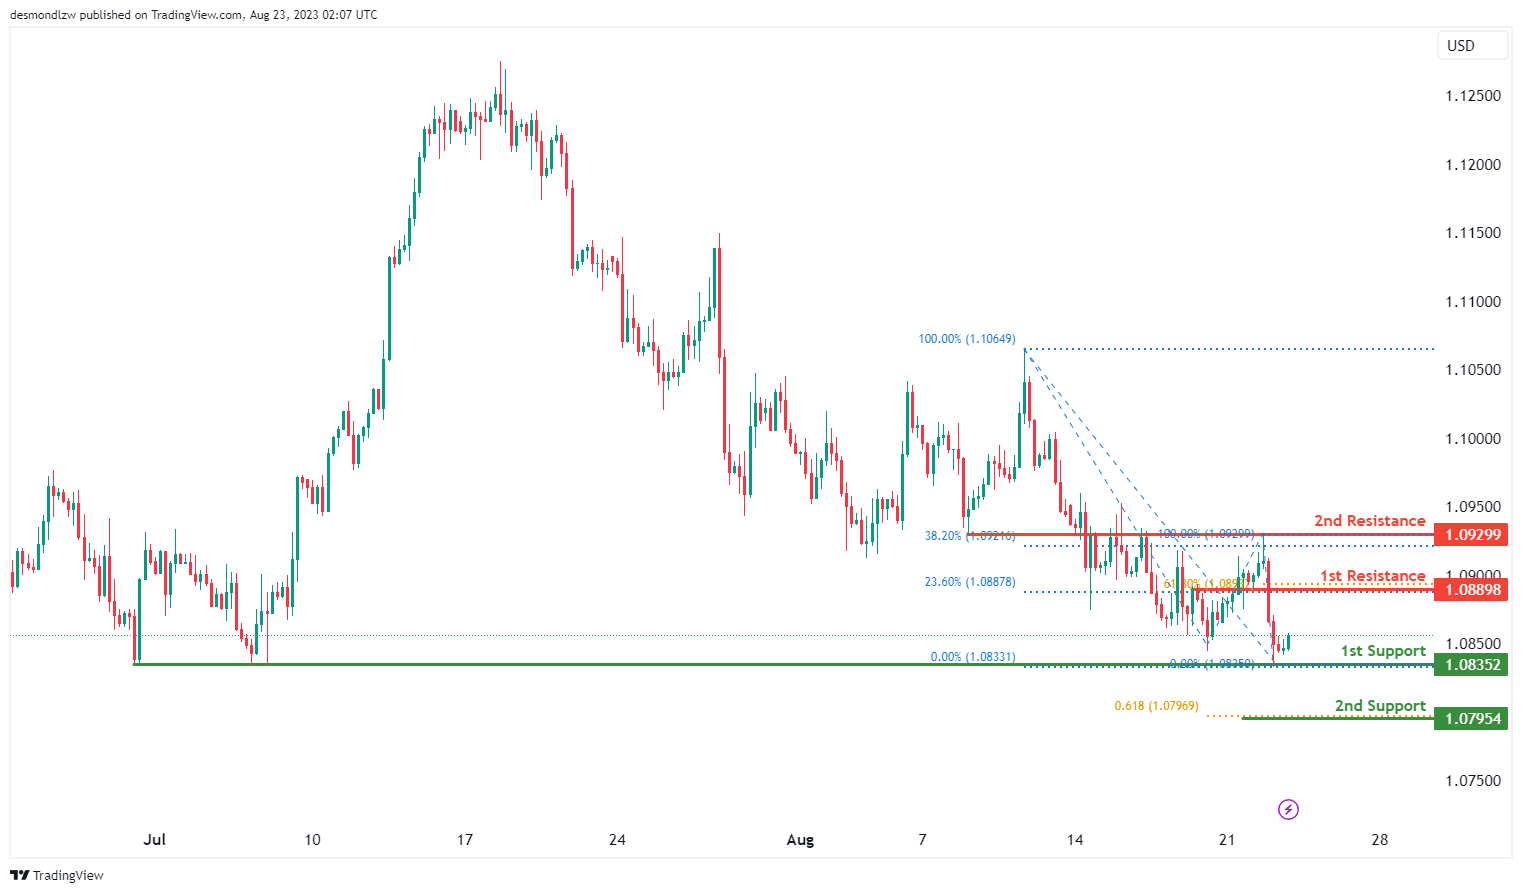
The current momentum on the EUR/USD chart suggests a bullish trend.
Within this context, there’s a potential scenario in which the price experiences a bullish rebound upon reaching the 1st support level at 1.0835, potentially leading to an upward movement towards the 1st resistance at 1.0890.
The 1st support at 1.0835 gains significance due to its identification as a multi-swing low support. Furthermore, the presence of the 2nd support at 1.0795 aligns with a 61.80% Fibonacci Projection, adding to its relevance.
On the resistance side, the 1st resistance at 1.0890 is notable as a pullback resistance, with the added confluence of a 61.80% Fibonacci Retracement and a 23.60% Fibonacci Retracement. Similarly, the 2nd resistance at 1.0929 is recognized as an overlap resistance, coinciding with a 38.20% Fibonacci Retracement.
These factors collectively contribute to the potential for a bullish bounce from the 1st support and a subsequent movement towards the 1st resistance, reflecting the overall bullish momentum on the chart.
EUR/JPY:
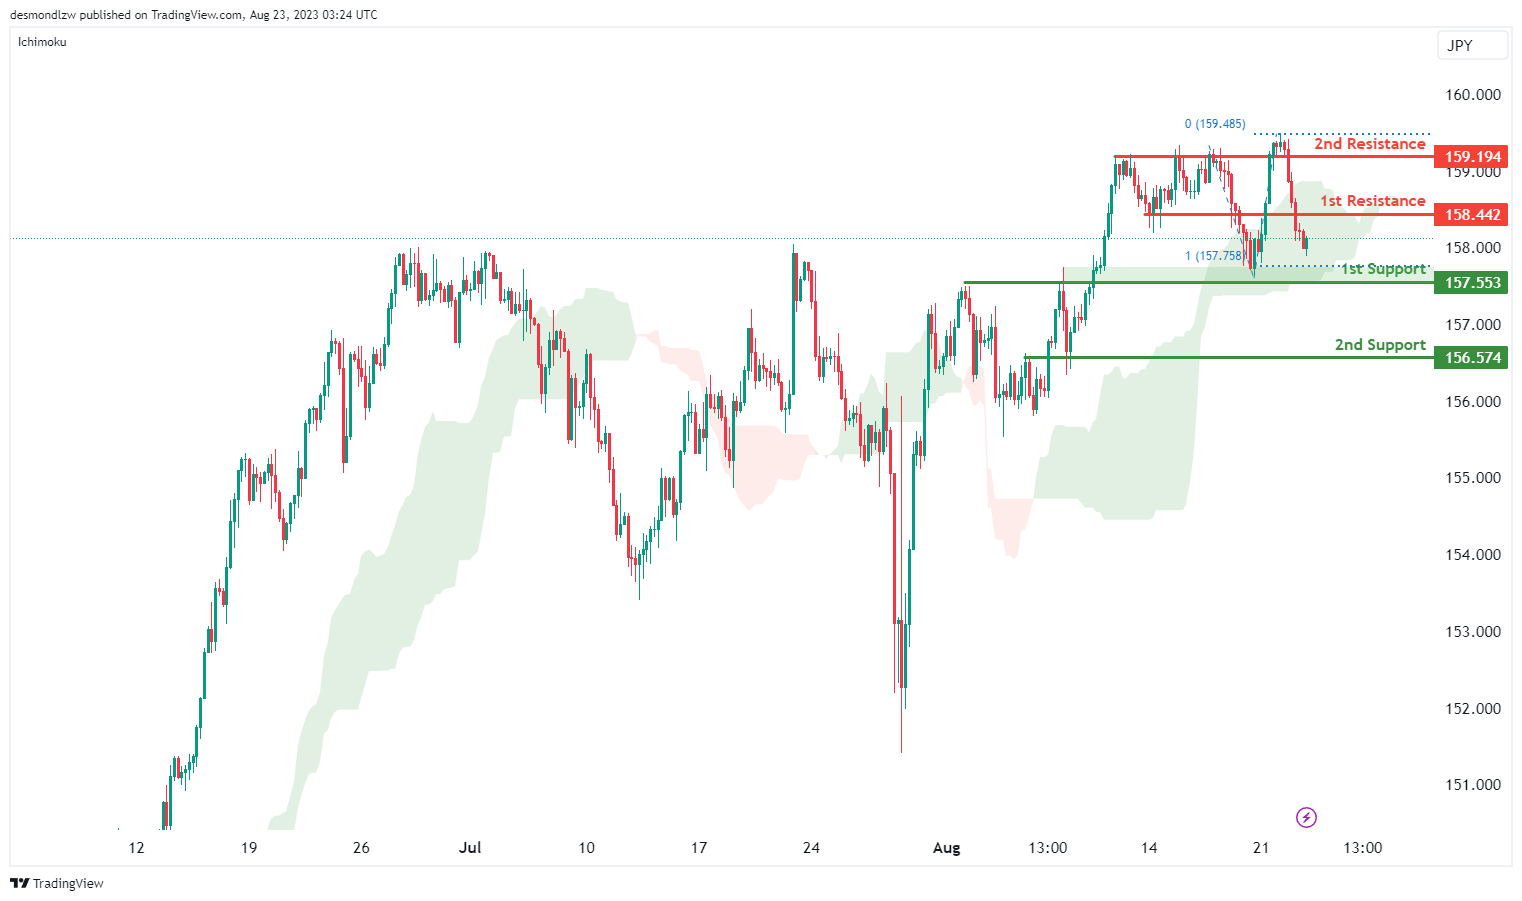
The EUR/JPY chart indicates a bullish overall momentum, and the fact that the price is within the bullish Ichimoku cloud contributes to this momentum. In this context, there’s potential for a bullish continuation towards the first resistance level.
The first support is located at 157.55 and is considered valuable due to its pullback support characteristics, as well as alignment with the 100% Fibonacci Projection.
Furthermore, the second support at 156.57 is also noteworthy as it represents a pullback support area.
On the resistance side, the first resistance level at 158.44 is significant due to its overlap resistance characteristics. Additionally, the second resistance at 159.19 is valuable as it represents another overlap resistance.
EUR/GBP:
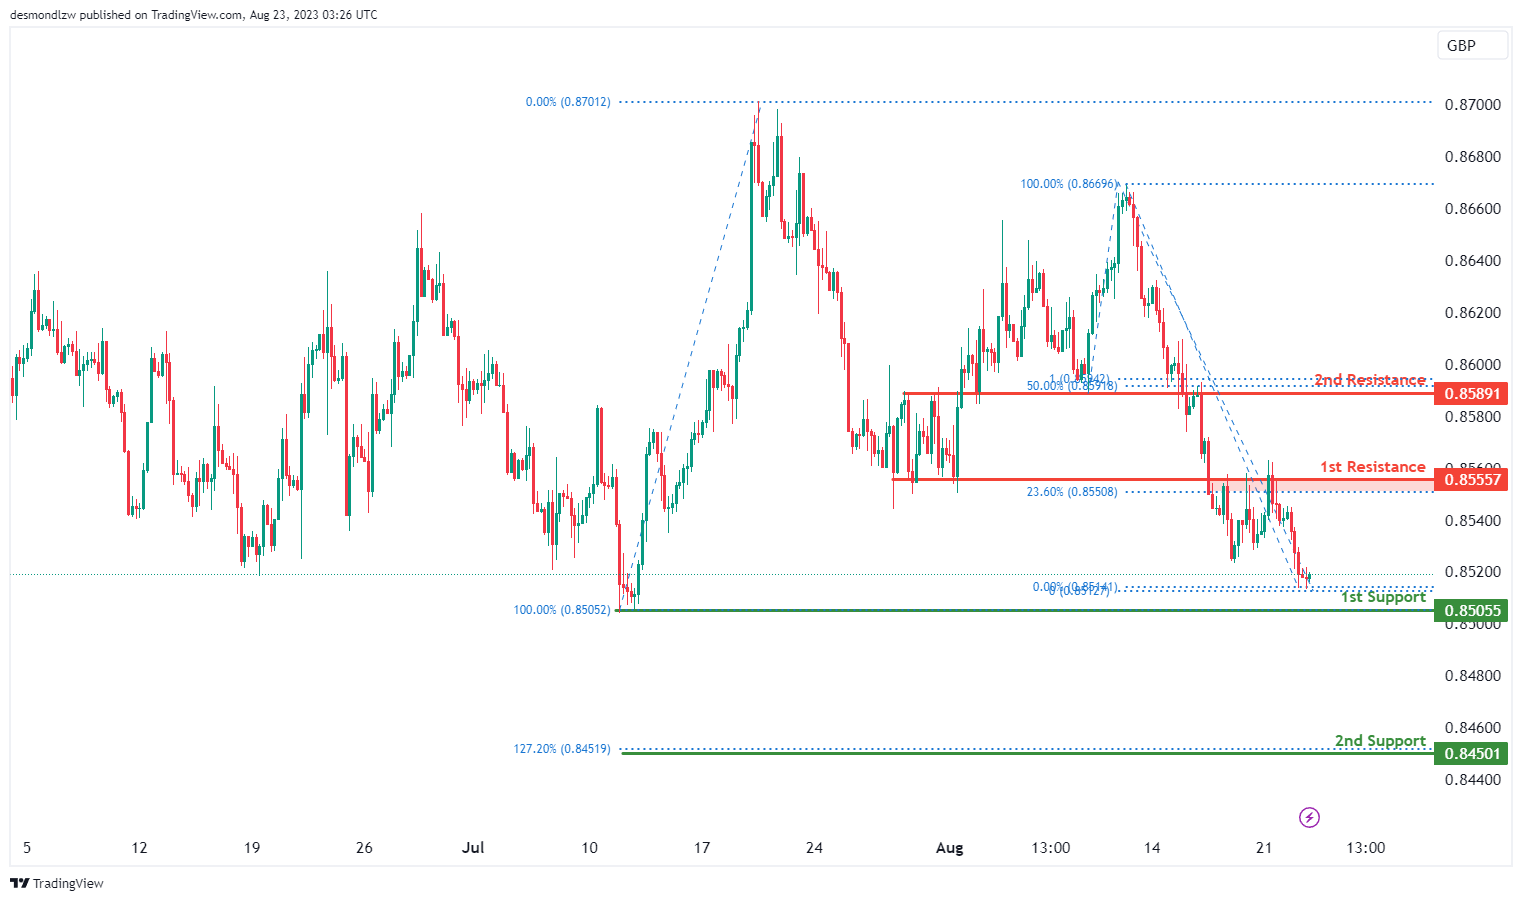
The EUR/GBP chart indicates a bullish overall momentum. This suggests a potential for a bullish continuation towards the first resistance level.
The first support at 0.8505 is seen as valuable due to its swing low support characteristics.
Furthermore, the second support at 0.8450 is noteworthy as it aligns with the 127.20% Fibonacci Extension, which can act as a potential support area.
On the resistance side, the first resistance level at 0.8555 is significant due to its pullback resistance characteristics, along with alignment to the 23.60% Fibonacci Retracement.
Additionally, the second resistance at 0.8594 is notable as it shows confluence between the 50% Fibonacci Retracement and the 100% Fibonacci Projection.
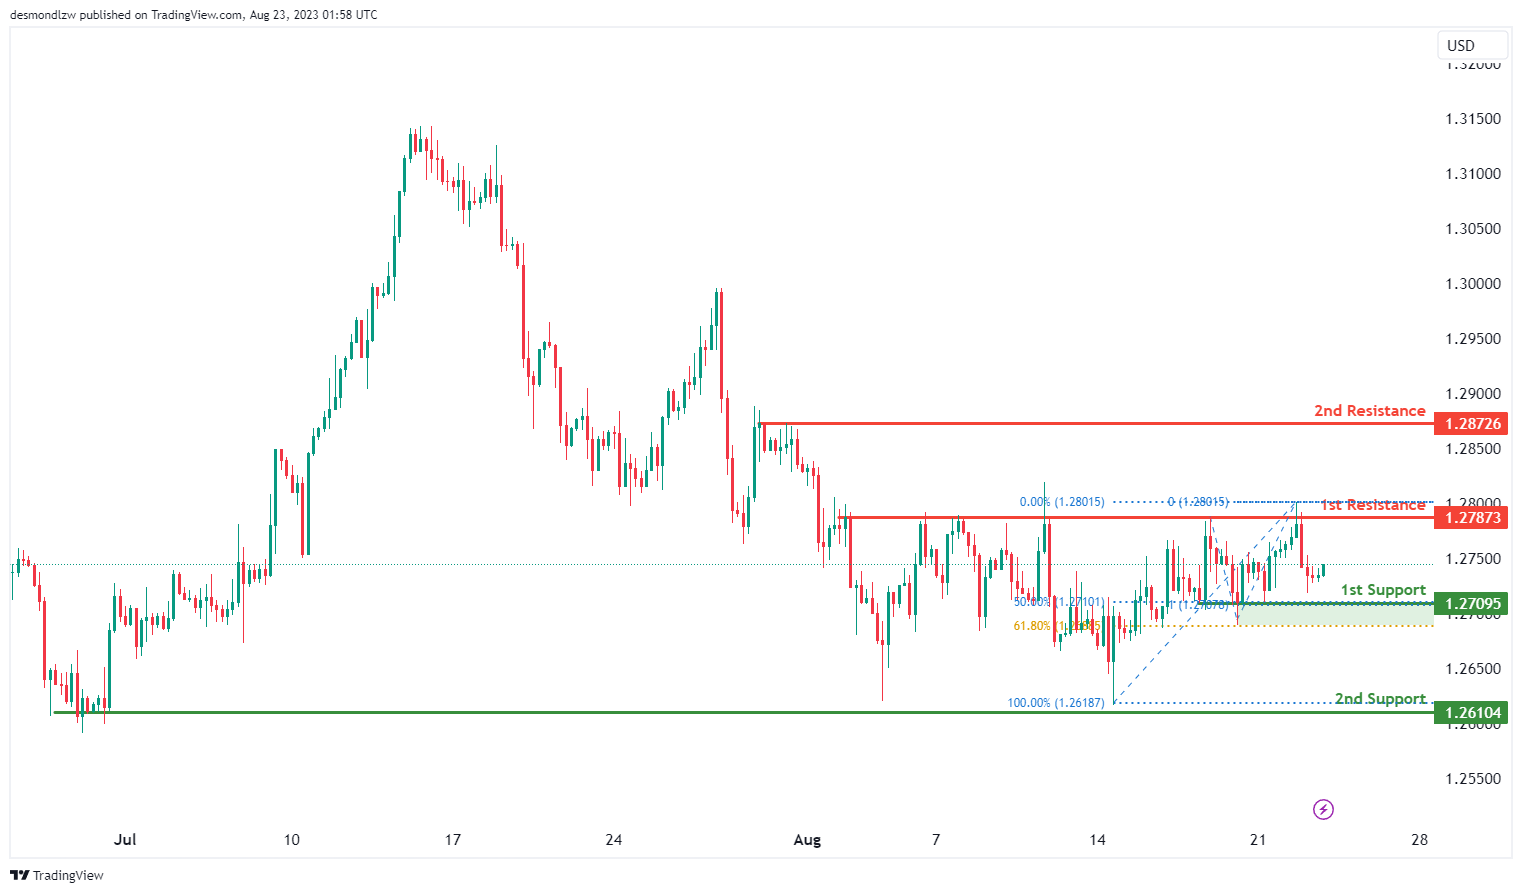
GBP/USD:
The current momentum of the GBP/USD chart indicates a bullish trend.
Within this momentum context, there’s a potential scenario where the price could continue its bullish movement towards the 1st resistance level.
The 1st support at 1.2709 is significant due to its identification as a multi-swing low support, and it aligns with a 50% Fibonacci Retracement. Additionally, the 2nd support at 1.2610 is noted as a swing low support, contributing to its importance.
On the resistance side, the 1st resistance at 1.2787 stands out as a swing high resistance, indicating a potential area where selling interest might arise. Similarly, the 2nd resistance at 1.2872 is recognized as a multi-swing high resistance.
These factors suggest the potential for a bullish continuation towards the 1st resistance level, in line with the overall bullish momentum observed on the chart.
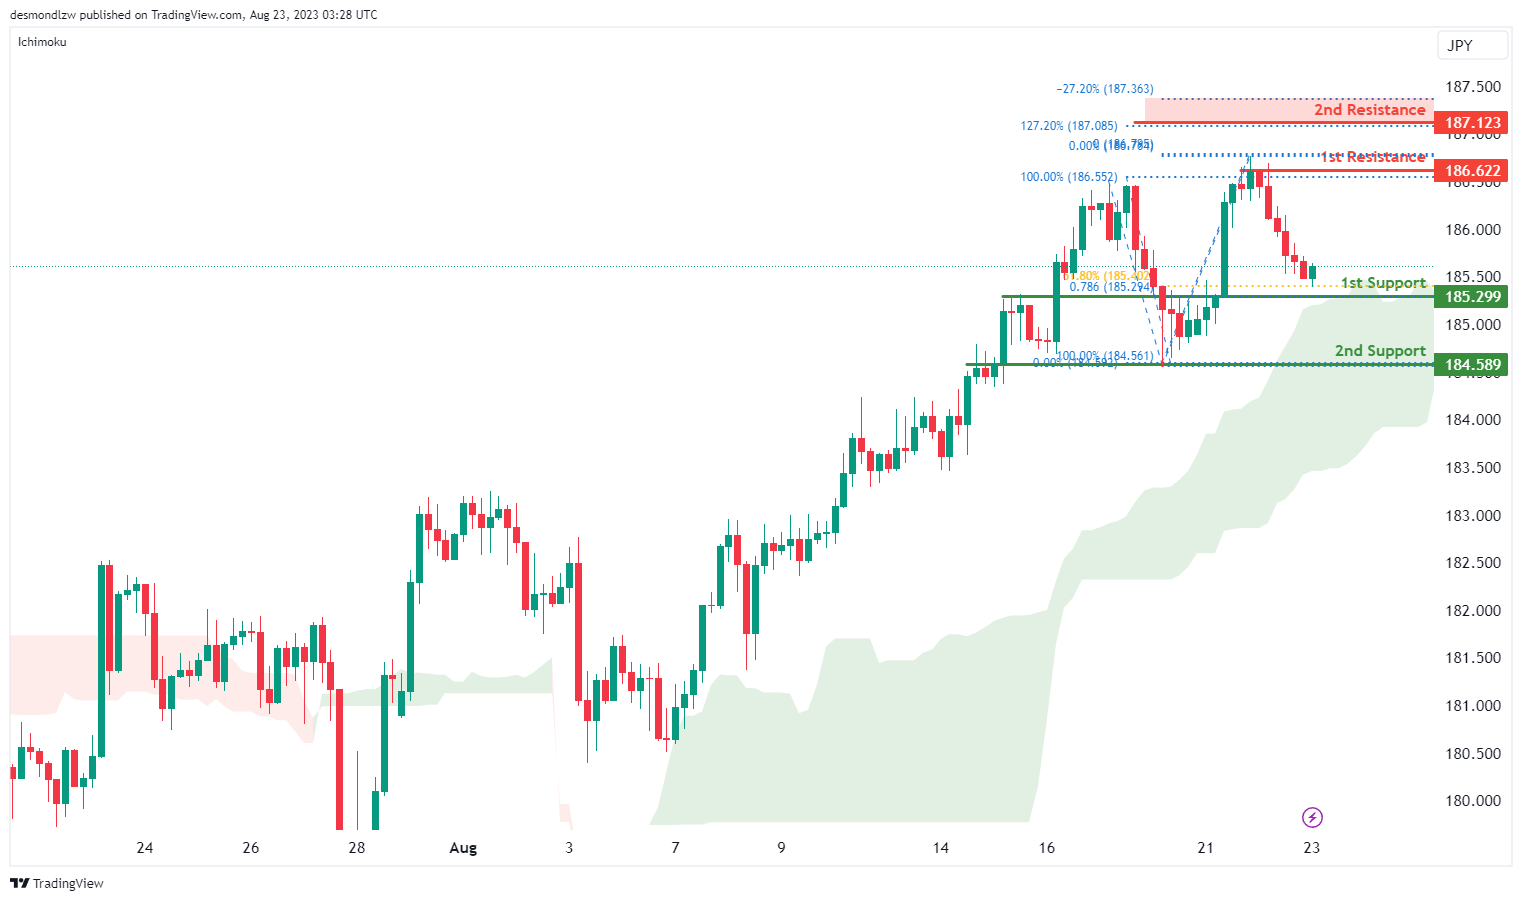
GBP/JPY:
The GBP/JPY chart indicates a bullish overall momentum, supported by the fact that the price is above the bullish Ichimoku cloud. This suggests a potential for a bullish continuation towards the first resistance level.
The first support at 185.29 is significant due to its confluence between the 61.80% Fibonacci Retracement and the 78.60% Fibonacci Projection.
The second support at 184.58 is notable as it represents a pullback support, which can further contribute to the potential bullish momentum.
On the resistance side, the first resistance level at 186.62 is important as it represents a swing high resistance.
Additionally, the second resistance at 187.12 is noteworthy due to the confluence between the 127.20% Fibonacci Extension and the -27% Fibonacci Expansion.
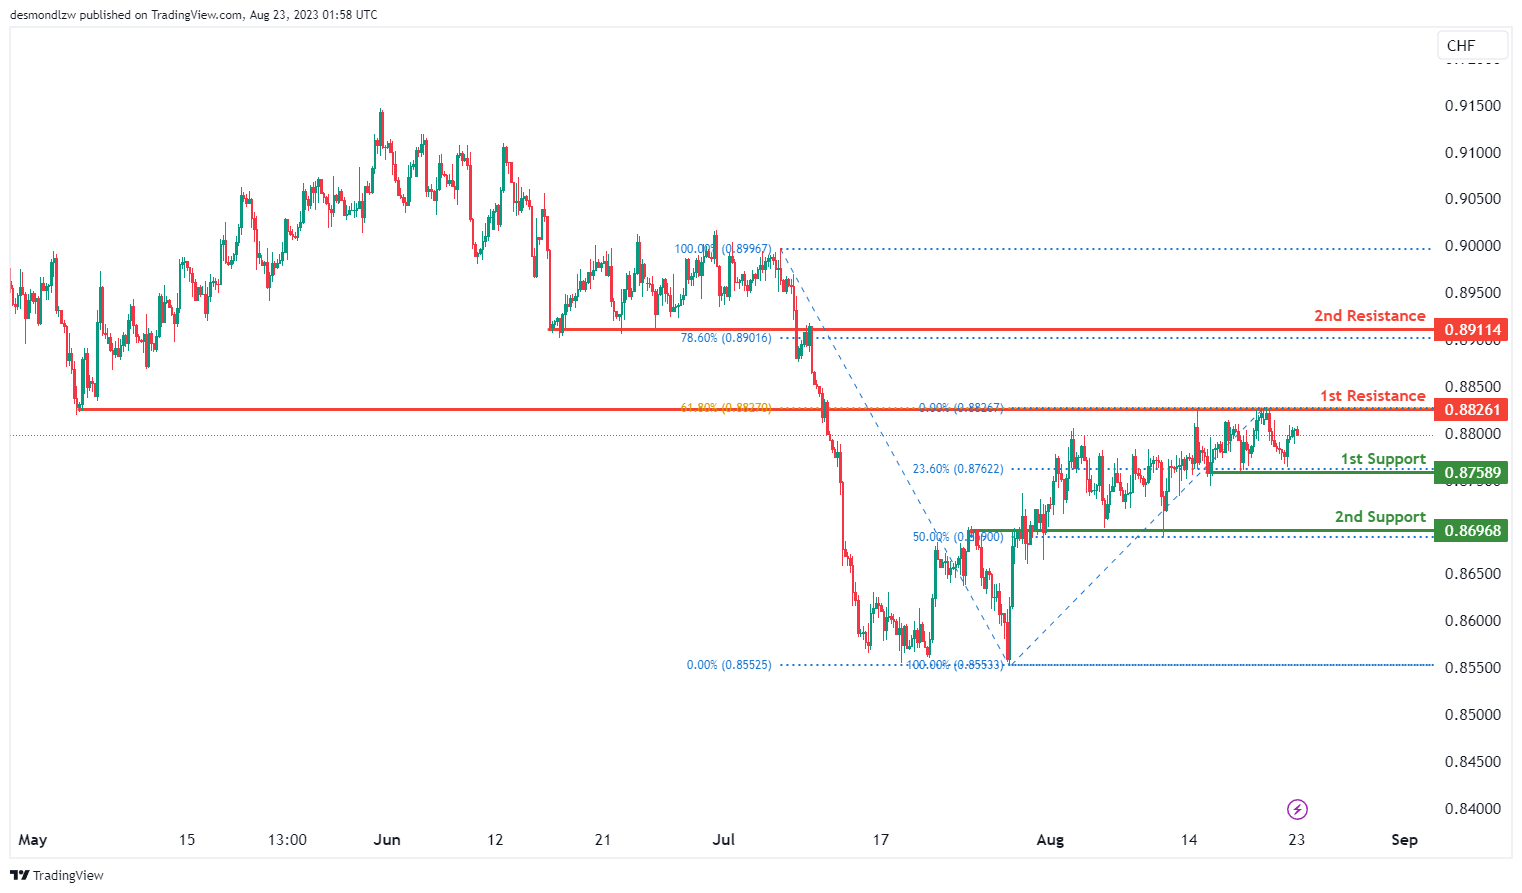
USD/CHF:
The USD/CHF chart currently reflects a bearish momentum, indicating a prevailing downward trend.
Given this bearish momentum, there’s a potential scenario in which the price could continue its bearish movement towards the 1st support level.
The 1st support at 0.8758 gains significance as a multi-swing low support and aligns with a 23.60% Fibonacci Retracement. Additionally, the 2nd support at 0.8696 is noted as an overlap support and corresponds to a 50% Fibonacci Retracement.
On the resistance side, the 1st resistance at 0.8826 is identified as an overlap resistance and aligns with a 61.80% Fibonacci Retracement. Similarly, the 2nd resistance at 0.8911 is recognized as a pullback resistance and corresponds to a 78.60% Fibonacci Retracement.
These factors support the potential for a bearish continuation towards the 1st support level, in line with the prevailing bearish momentum observed on the chart.
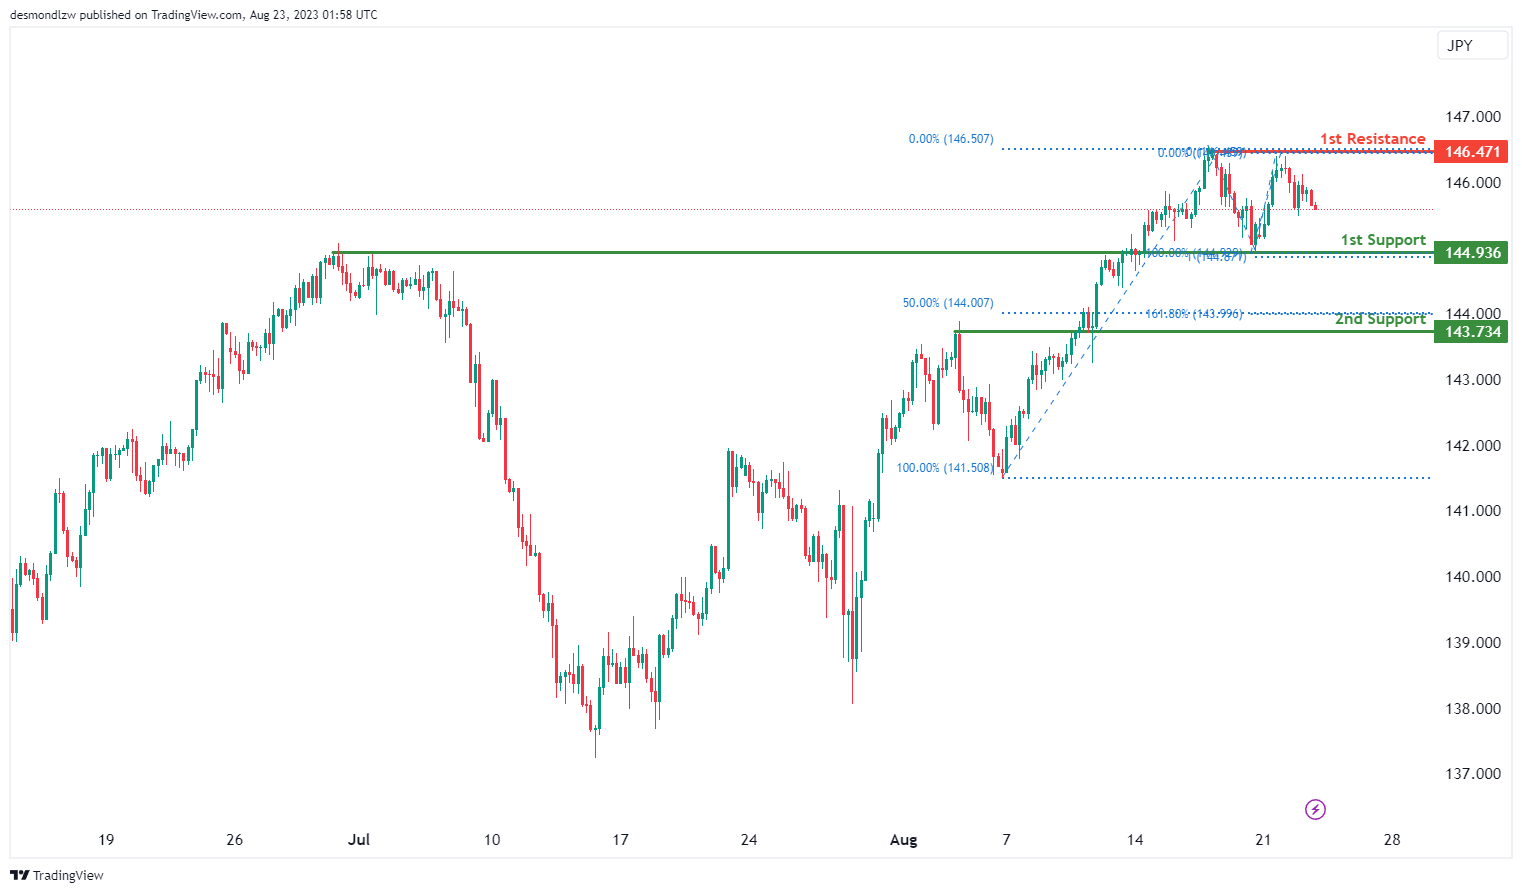
USD/JPY:
The USD/JPY chart indicates a bearish momentum, signaling a prevailing downward trend.
In this context, there’s a potential scenario where the price could extend its bearish movement towards the 1st support level.
The significance of the 1st support at 144.93 lies in its identification as an overlap support, suggesting a potential area where the price might find temporary stabilization.
Furthermore, the 2nd support at 143.73 aligns with a pullback support and corresponds to a 50% Fibonacci Retracement, adding to its importance as a potential level where the price could bounce.
On the resistance side, the 1st resistance at 146.47 is noted as a multi-swing high resistance, potentially acting as an obstacle to upward price movement.
These factors contribute to the potential for a bearish continuation towards the 1st support level, aligning with the overall bearish momentum observed on the chart.
USD/CAD:
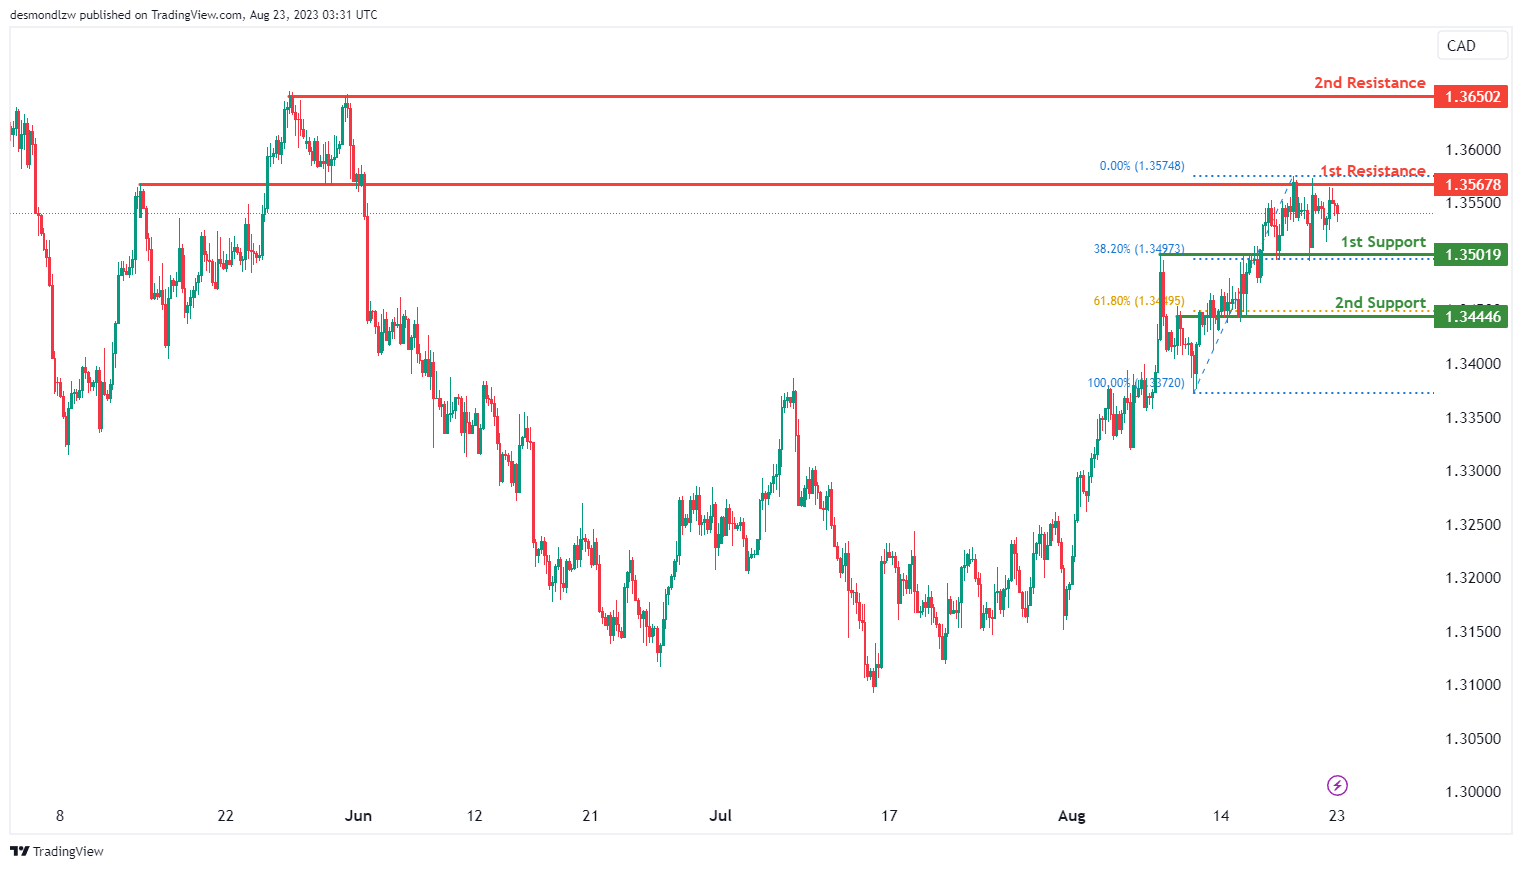
The USD/CAD chart currently exhibits a neutral momentum, indicating a lack of clear directional bias. There is a potential for price to fluctuate between the 1st resistance and the 1st support levels.
The 1st support at 1.3502 is considered significant due to its identification as an overlap support that aligns with the 38.20% Fibonacci retracement level. Similarly, the 2nd support at 1.3445 is also identified as an overlap support that aligns with the 61.80% Fibonacci retracement level.
To the upside, the 1st resistance at 1.3568 is identified as an overlap resistance. Furthermore, the 2nd resistance at 1.3650 is identified as a multiple swing-high resistance.
AUD/USD:
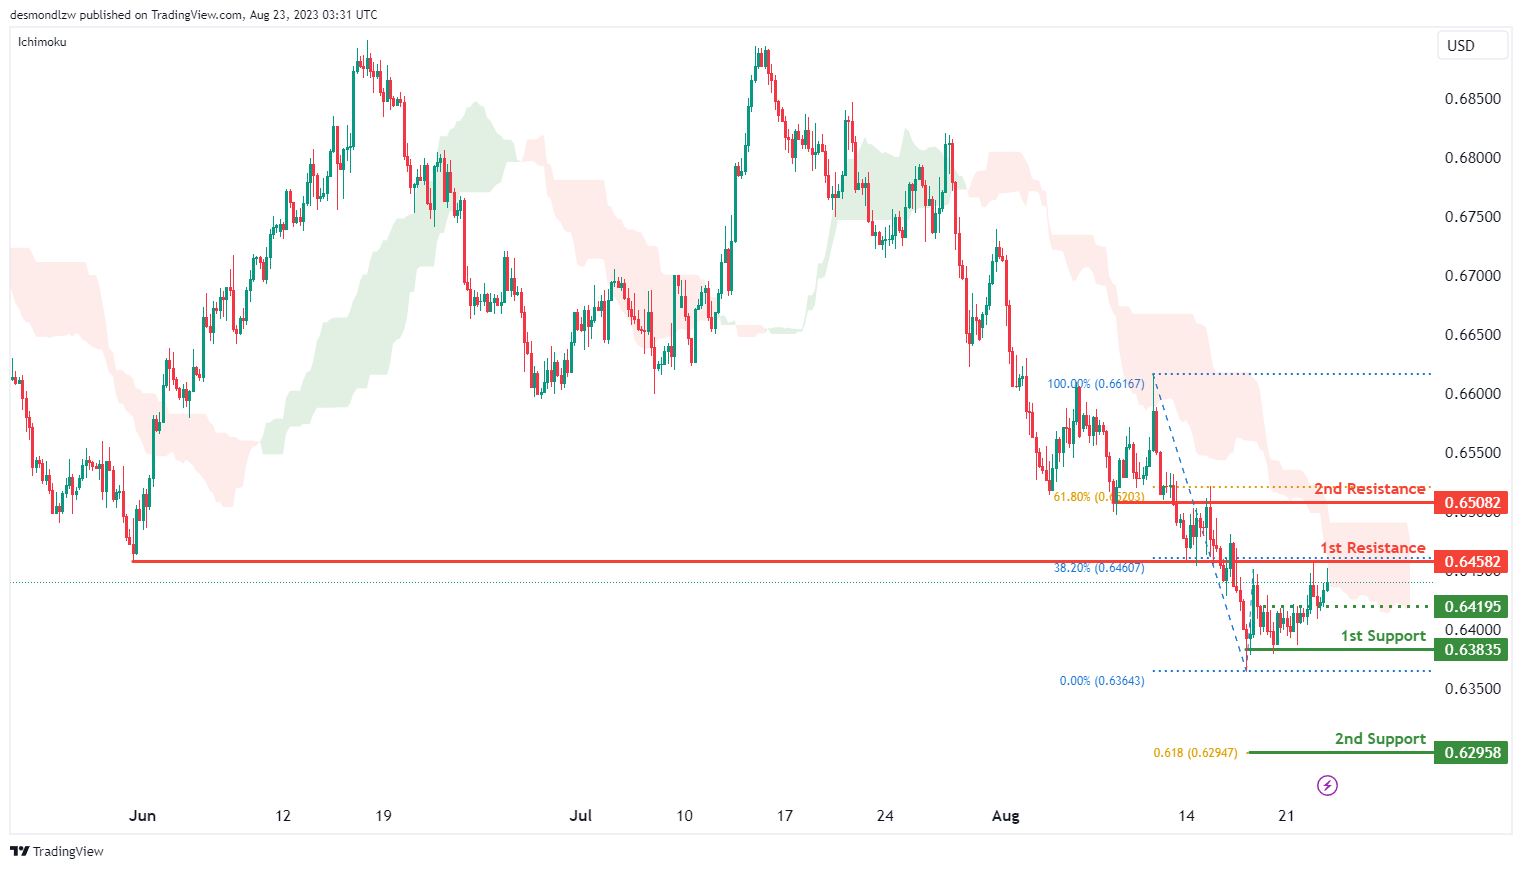
The AUD/USD chart indicates a bearish momentum, signifying a prevailing downward trend. There is a potential for price to experience a bearish reaction upon reaching the 1st resistance level at 0.6458 and subsequently drop towards the 1st support level at 0.6384.
The 1st resistance at 0.6458 is identified as a pullback resistance that aligns with the 38.20% Fibonacci retracement level. The 2nd resistance at 0.6508 is also identified as an overlap resistance that aligns with the 61.80% Fibonacci retracement level.
To the downside, the intermediate support level is found at 0.6419 while the 1st support at 0.6384 is identified as a swing-low support. Furthermore, the 2nd support at 0.6296 is identified as a pullback support that aligns with the 61.80% Fibonacci projection level.
NZD/USD
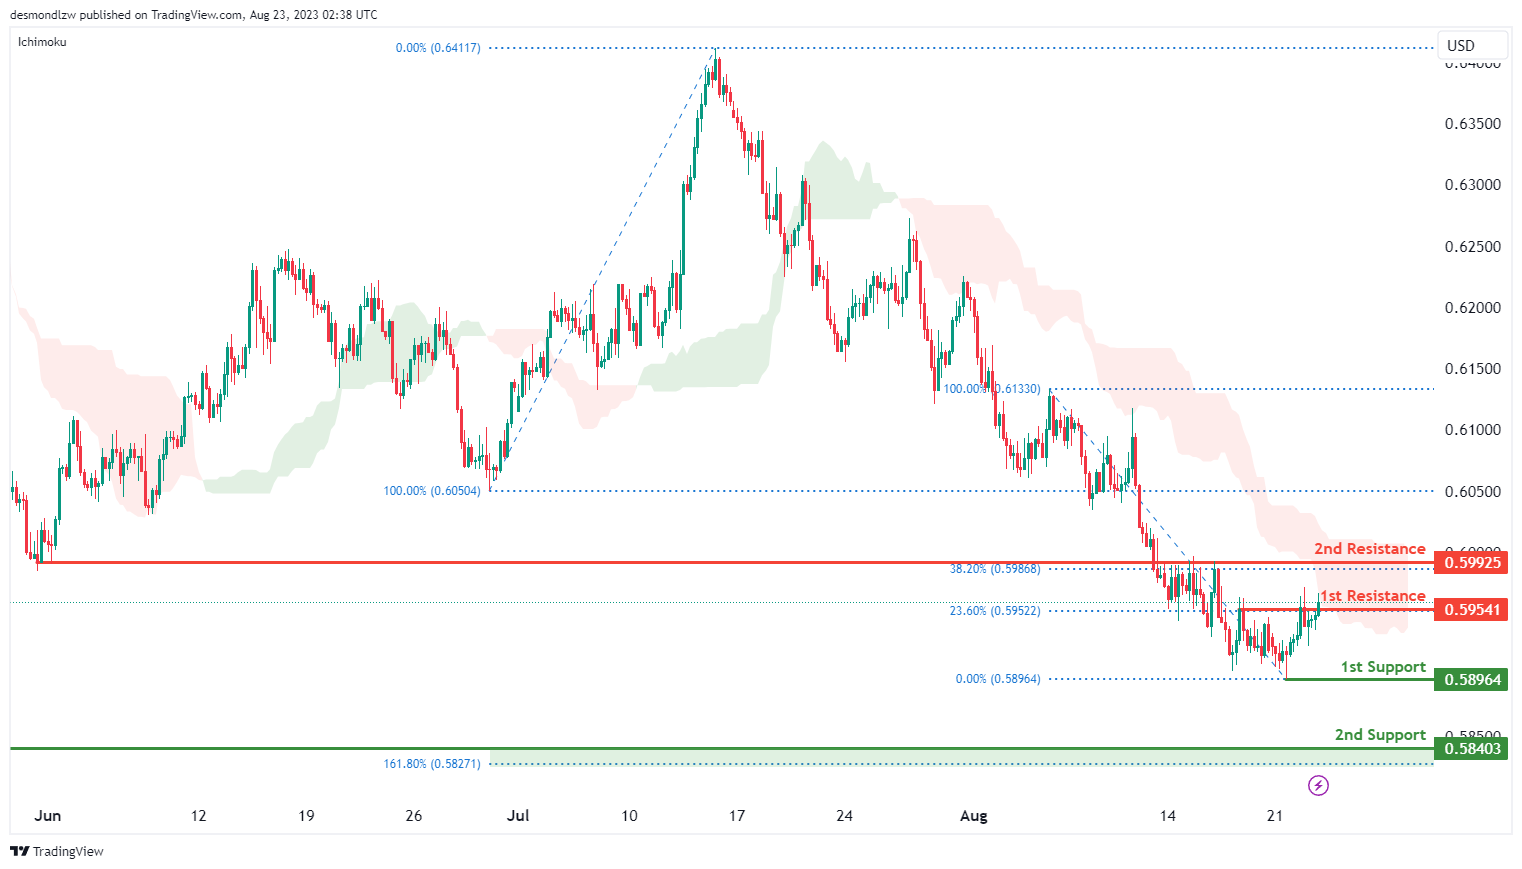
The NZD/USD chart currently displays a bearish momentum, indicating a prevalent downward trend. There is potential for price to undergo a bearish reaction upon reaching the 1st resistance level at 0.5954 and subsequently decline towards the 1st support level at 0.5896.
The 1st resistance at 0.5954 is identified as a pullback resistance that aligns with the 23.60% Fibonacci retracement level. The 2nd resistance at 0.5993 is identified as an overlap resistance that aligns with the 38.20% Fibonacci retracement level.
To the downside, the 1st support at 0.5896 is identified as a swing-low support. Additionally, the 2nd support at 0.5840 is identified as a pullback support that aligns with the 161.80% Fibonacci extension level.
DJ30:
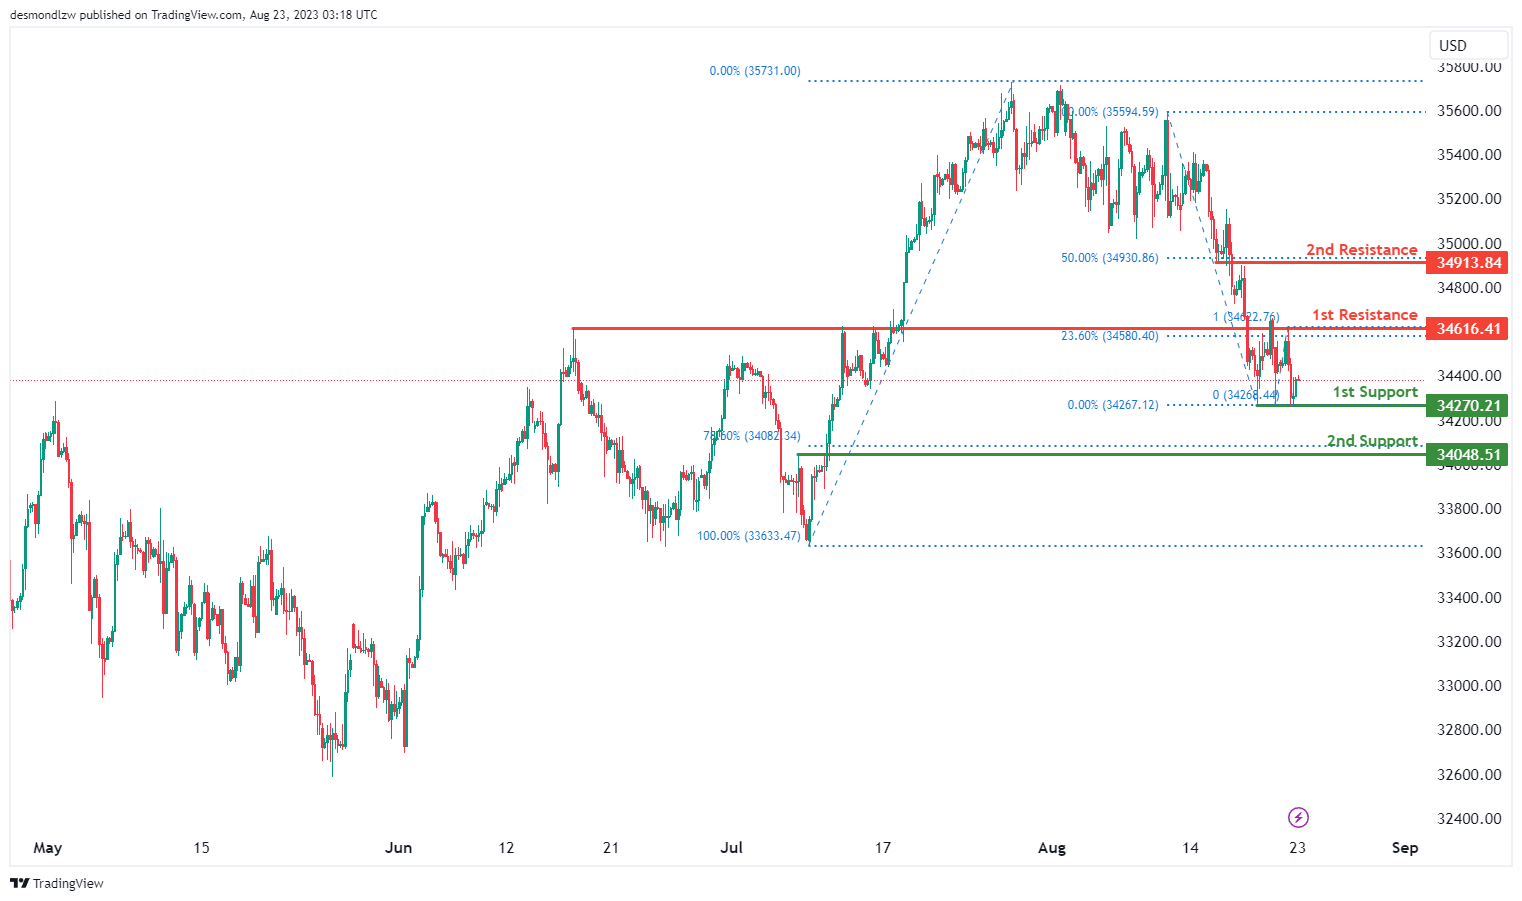
The DJ30 chart indicates a bullish overall momentum. There is a potential scenario where the price might continue in a bullish direction towards the first resistance level.
The first support is positioned at 34270.21 and is considered advantageous due to its multi-swing low support characteristics. Additionally, the second support at 34048.51 is valuable as it represents a pullback support and aligns with the 78.60% Fibonacci Retracement.
On the resistance side, the first resistance level at 34616.41 is noteworthy and is associated with an overlap resistance. This resistance level also coincides with the 23.60% Fibonacci Retracement and the 100% Fibonacci Projection, indicating a strong Fibonacci confluence. Furthermore, the second resistance at 34913.84 is significant as it represents a pullback resistance and aligns with the 50% Fibonacci Retracement.
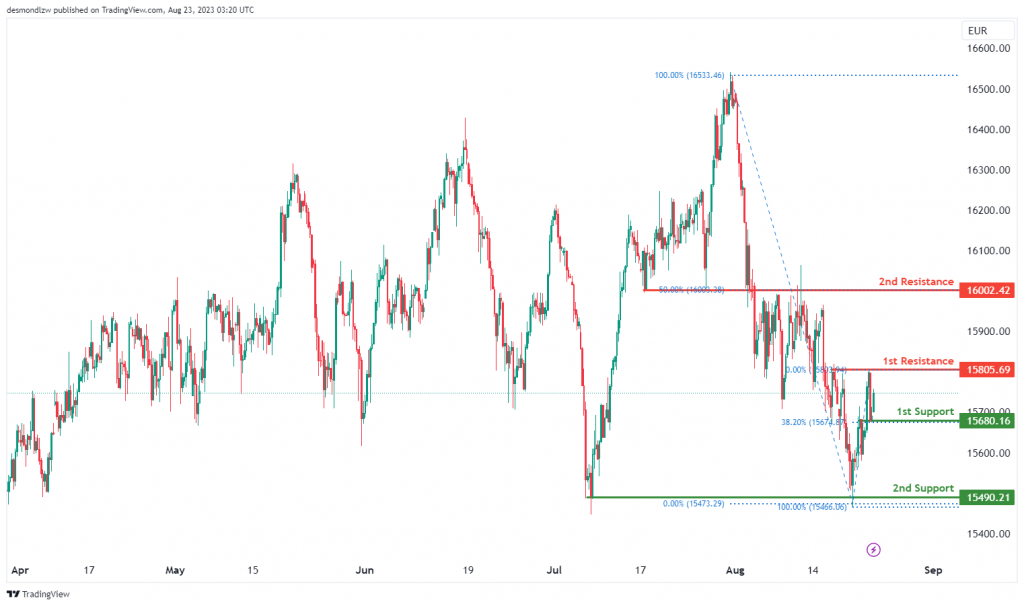
GER30:
The GER30 chart indicates a bullish overall momentum. In this scenario, there’s a potential for a bullish continuation towards the first resistance level.
The first support is located at 15680.16 and is considered advantageous due to its pullback support characteristics, along with the alignment to the 38.20% Fibonacci Retracement.
Furthermore, the second support at 15490.21 is valuable as it represents a multi-swing low support area.
On the resistance side, the first resistance level at 15805.69 is significant due to its multi-swing high resistance characteristics. Additionally, the second resistance at 16002.42 is notable as it represents a pullback resistance and aligns with the 50% Fibonacci Retracement.
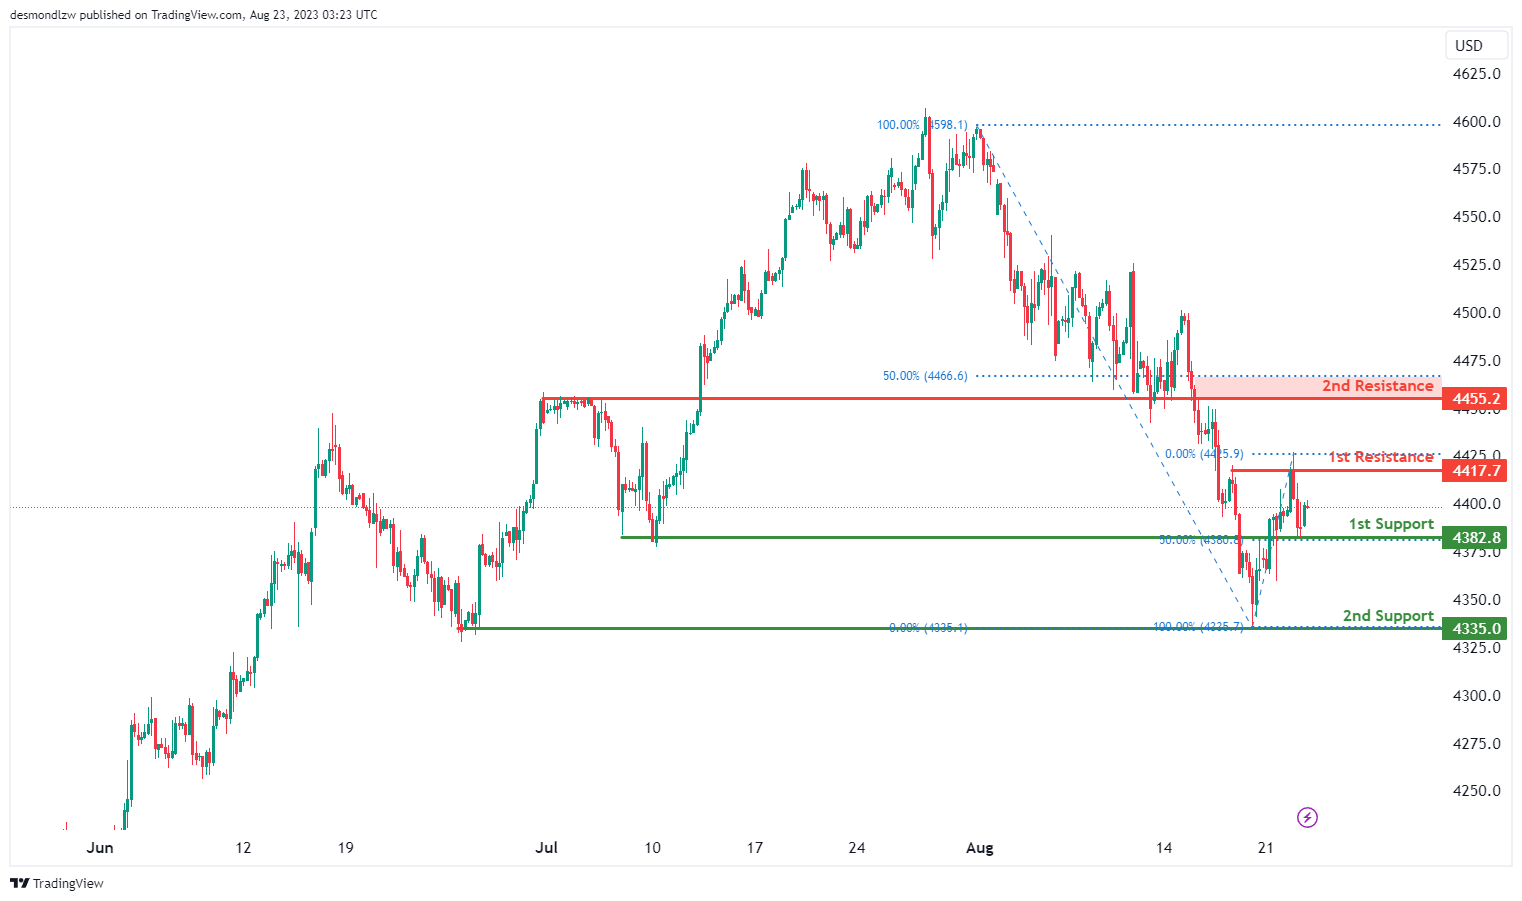
US500
The US500 chart indicates a bearish overall momentum. In this context, there’s potential for a bearish continuation towards the first support level.
The first support is situated at 4382.8 and is considered significant due to its overlap support characteristics, along with the alignment to the 50% Fibonacci Retracement.
Additionally, the second support at 4335.0 is valuable as it represents a multi-swing low support area.
On the resistance side, the first resistance level at 4417.7 is noteworthy due to its multi-swing high resistance characteristics. Furthermore, the second resistance at 4455.2 is significant as it represents an overlap resistance and aligns with the 50% Fibonacci Retracement.
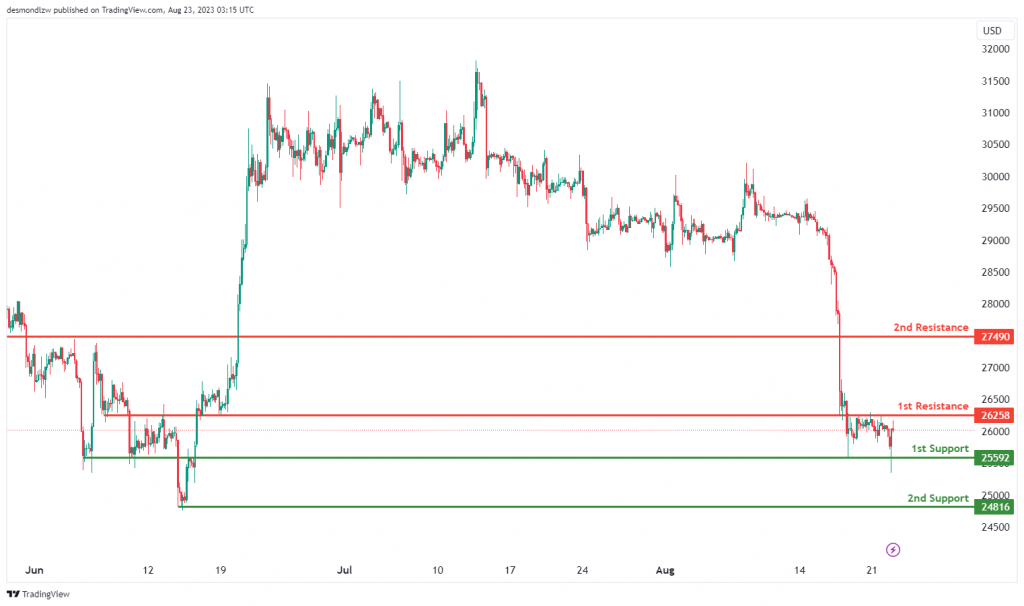
BTC/USD:
The BTC/USD chart indicates a bearish overall momentum. There is a potential scenario where the price might continue in a bearish direction towards the first support level.
The first support is positioned at 25592 and is considered advantageous due to its multi-swing low support characteristics. Additionally, the second support at 24816 is valuable as it represents a swing low support.
On the resistance side, the first resistance level at 26258 is noteworthy and is associated with an overlap resistance. Furthermore, the second resistance at 27490 is significant due to its overlap resistance attributes.
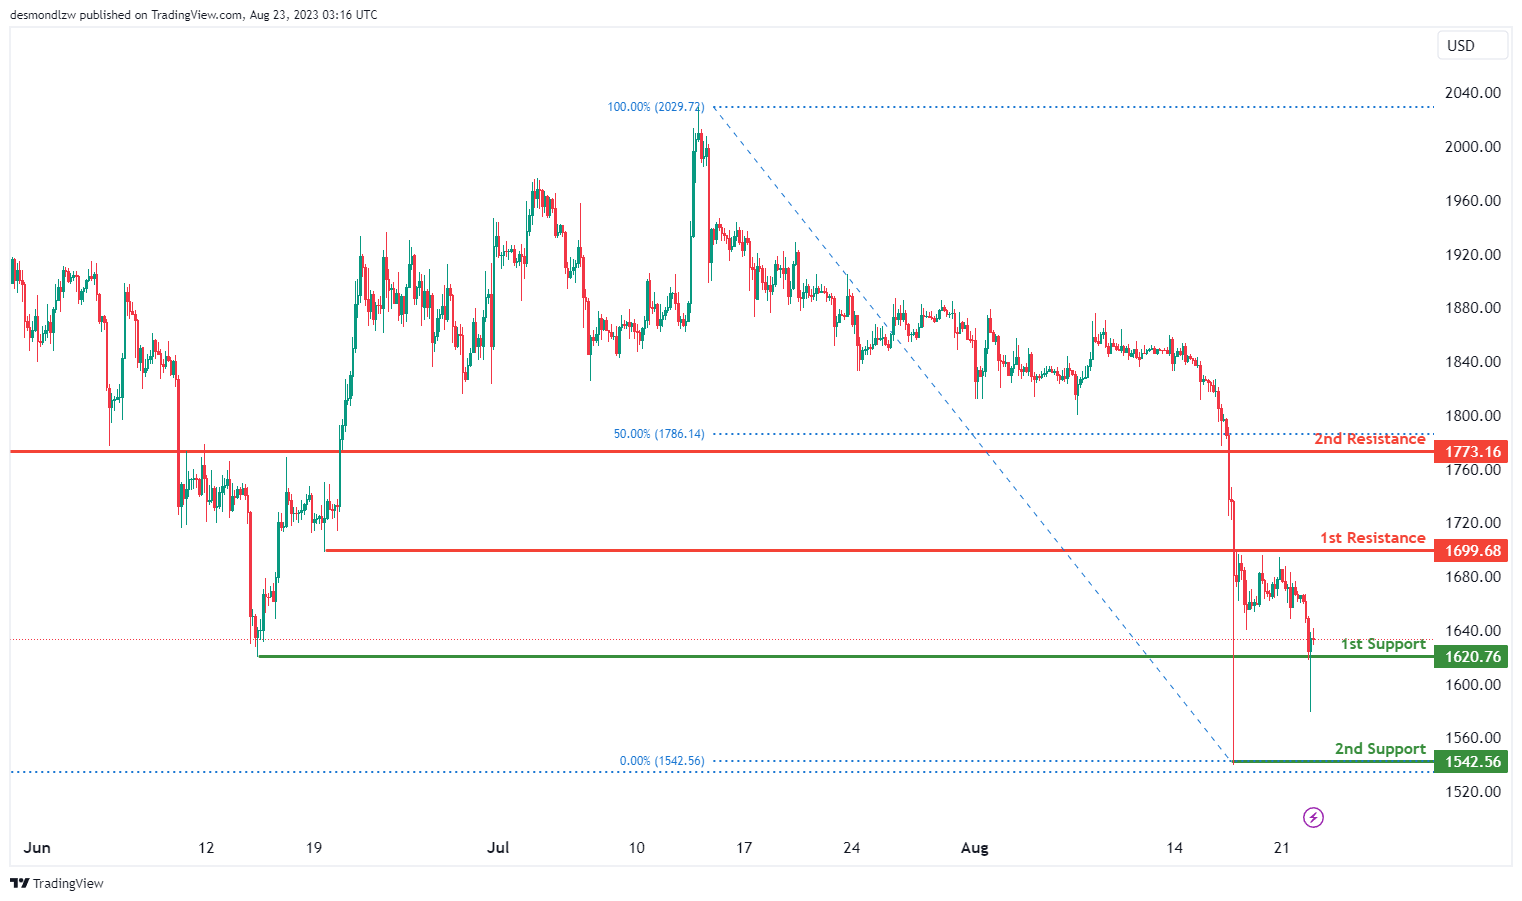
ETH/USD:
The ETH/USD chart indicates a bearish overall momentum. There is a potential scenario where the price might continue in a bearish direction towards the first support level.
The first support is positioned at 1620.76 and is considered advantageous due to its overlap support characteristics. Additionally, the second support at 1542.56 is valuable as it represents a swing low support.
On the resistance side, the first resistance level at 1699.68 is noteworthy and is associated with a pullback resistance. Furthermore, the second resistance at 1773.16 is significant due to its overlap resistance attributes and its association with the 50% Fibonacci Retracement.
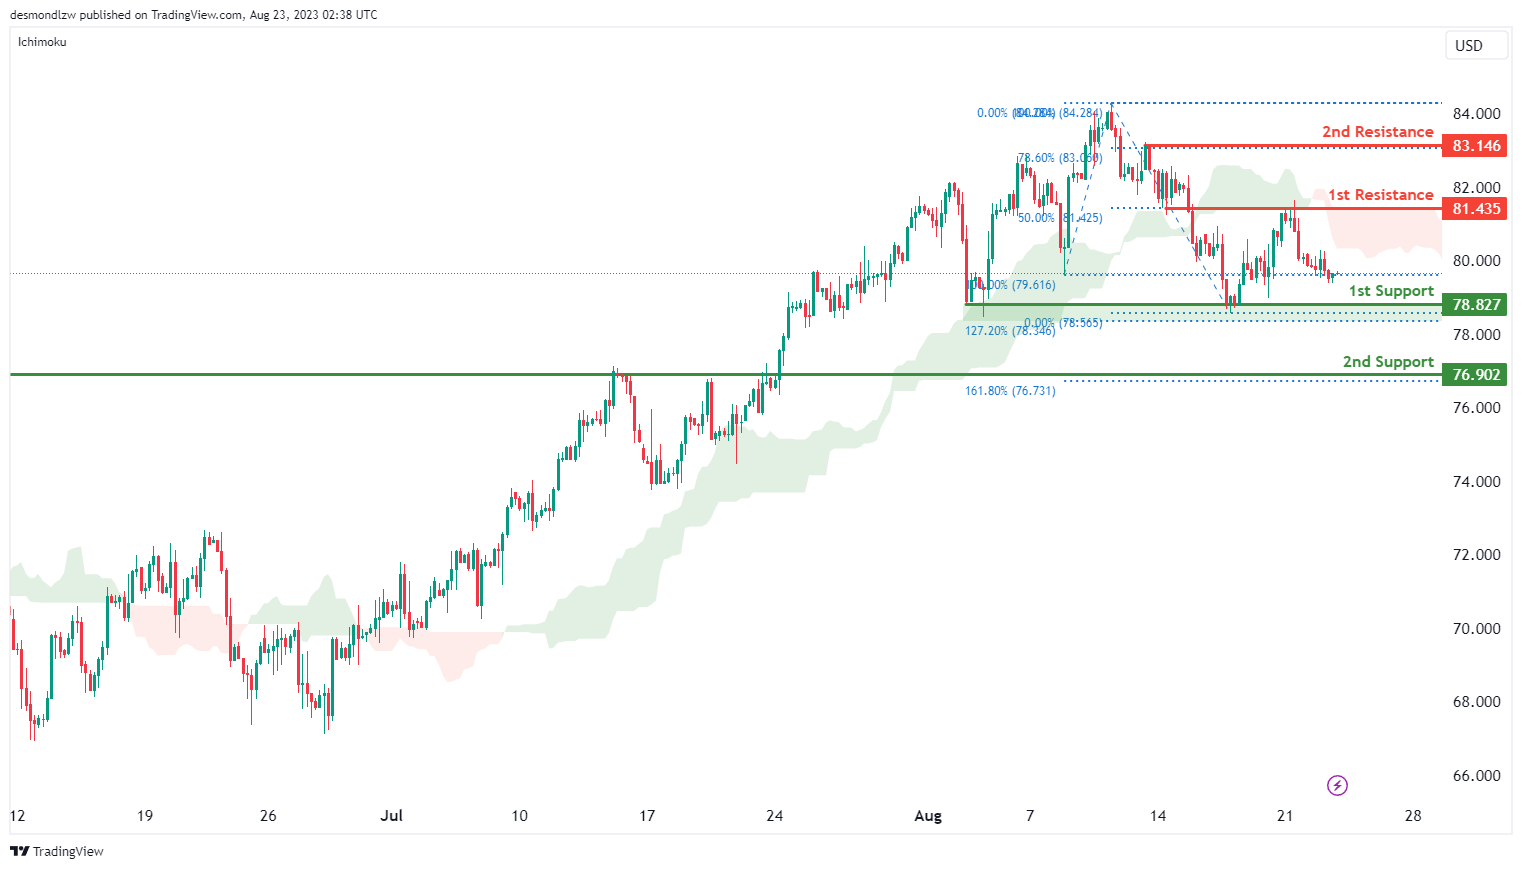
WTI/USD:
The WTI chart currently indicates a bearish momentum, suggesting a prevailing downward trend. There is potential for price to continue its downward movement towards the 1st support level at 78.83.
The significance of the 1st support at 78.83 lies in its identification as an overlap support that aligns with the 127.20% Fibonacci extension level. Similarly, the 2nd support at 76.90 is also identified as an overlap support that aligns with the 161.80% Fibonacci extension level.
To the upside, the 1st resistance level at 81.44 is noted as an overlap resistance that aligns with the 50.00% Fibonacci retracement level. The 2nd resistance at 83.15 is identified as a pullback resistance that aligns with the 78.60% Fibonacci retracement level.
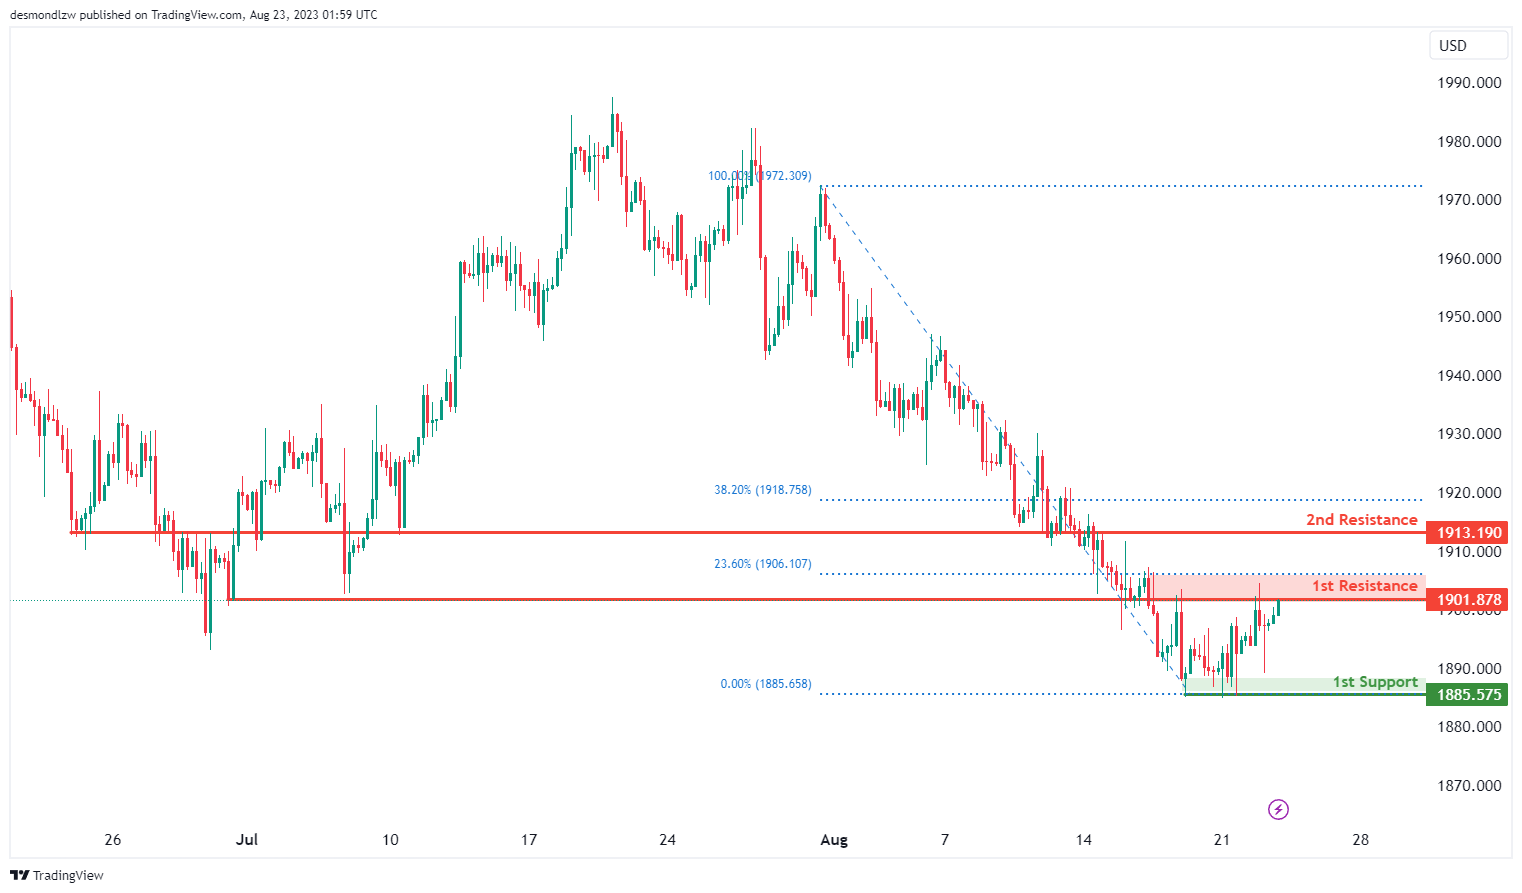
XAU/USD (GOLD):
The XAUUSD chart indicates a bullish momentum, suggesting a prevailing upward trend.
Within this context, a potential scenario arises in which the price might experience a bearish reaction at the 1st resistance level, followed by a drop to the 1st support in the short term, before eventually rising back towards the 1st resistance.
The significance of the 1st support at 1885.57 lies in its identification as a multi-swing low support, potentially providing a foundation for a temporary price recovery.
On the resistance side, the 1st resistance at 1901.87 is noteworthy due to its classification as an overlap resistance and its alignment with a 23.60% Fibonacci Retracement. Additionally, the 2nd resistance at 1913.19 is identified as an overlap resistance, adding to its potential impact on price movement.
These factors contribute to the potential scenario of a bearish reaction followed by a short-term drop to the 1st support, eventually leading to a rise back towards the 1st resistance level, in alignment with the overall bullish momentum observed on the chart.


