
DXY:
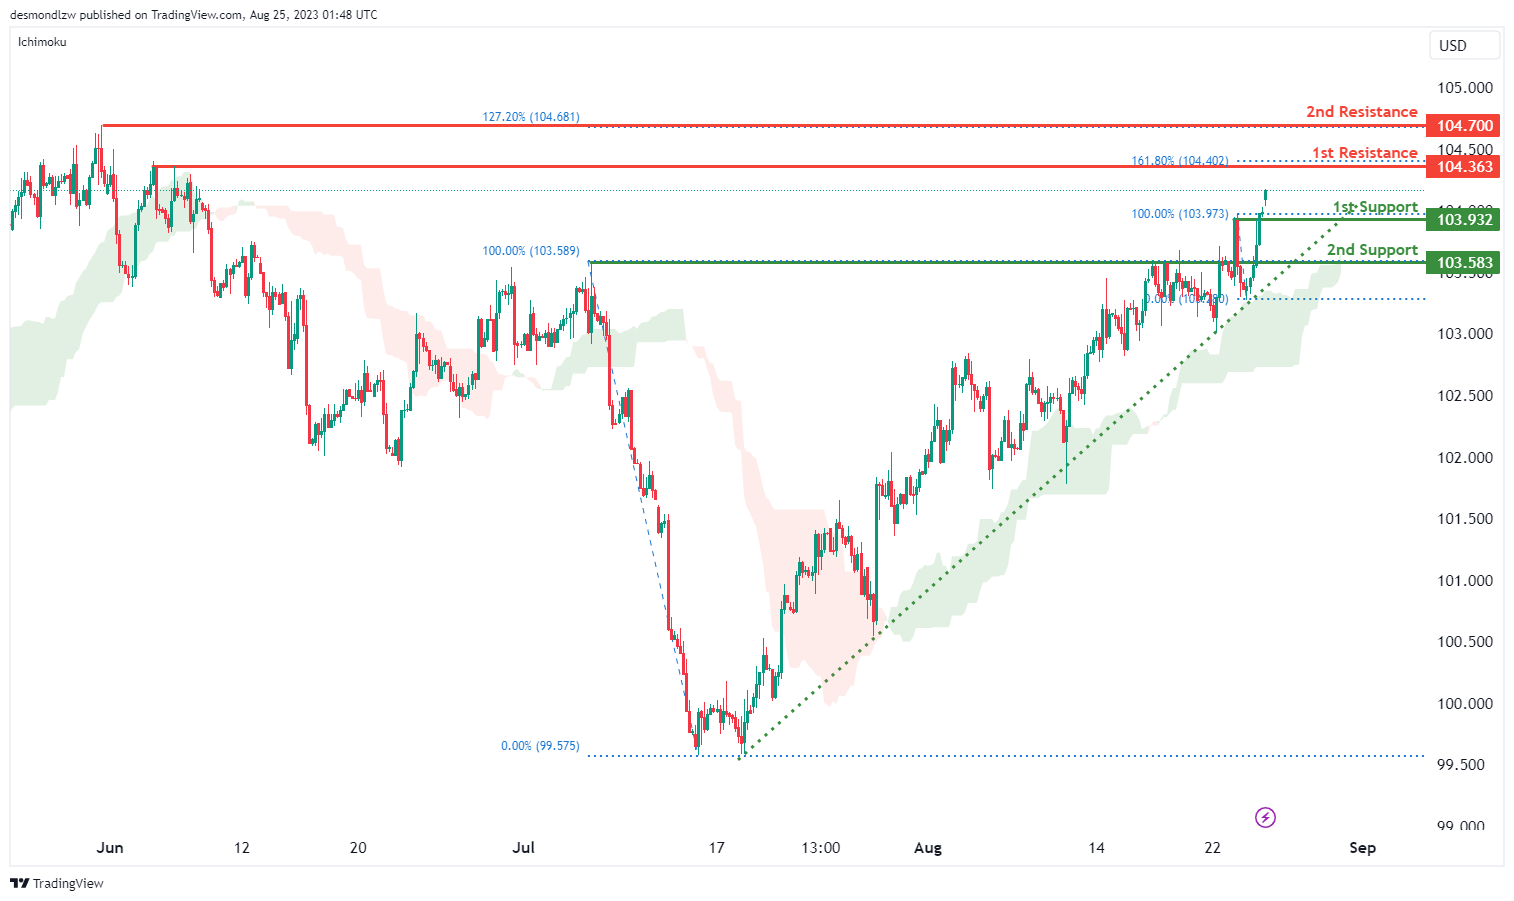
The DXY, which stands for the U.S. Dollar Index, is currently displaying a bullish momentum. One of the prominent indicators supporting this momentum is the fact that the price is maintaining a position above a significant ascending trend line. Such a trend line usually signals a continuation of the upward movement, suggesting that further bullish momentum is likely in the coming sessions.
Additionally, another key bullish indicator is the position of the price above the Ichimoku cloud. When the price is above this cloud, it usually confirms the ongoing positive momentum, offering more confidence to the bullish bias.
Given these technical indicators, there’s a strong case for the price to potentially continue its bullish trajectory, moving towards the 1st resistance level.
Speaking of levels, the 1st support level to watch out for is at 103.30, which serves as a pullback support. Should there be any downward movement, this is a level where the price might find some cushion. Following closely is the 2nd support level at 103.58, which also acts as a pullback support.
On the upside, the 1st resistance level stands at 104.36. This level is significant because it marks a swing high resistance and coincides with the 161.80% Fibonacci Extension. Breaking past this could pave the way for the next challenge at the 2nd resistance level of 104.70. This resistance is not only a swing high resistance but also aligns with the 127.20% Fibonacci Extension.
EUR/USD:
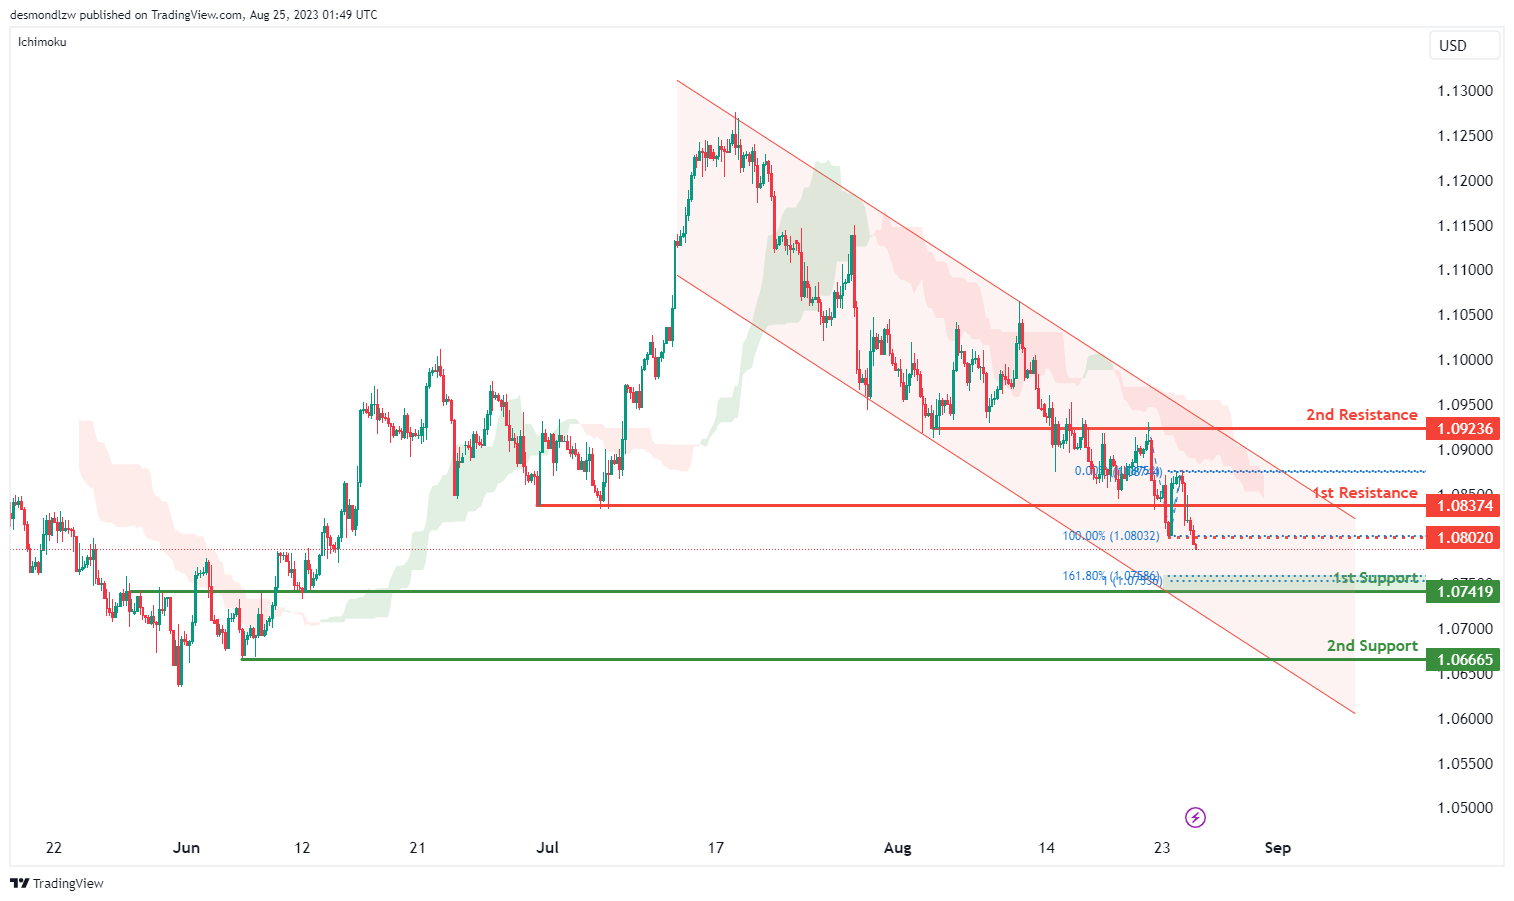
The EUR/USD pair is exhibiting a bearish momentum. Several factors underscore this trend: the price movement within a descending channel and its positioning right below the bearish Ichimoku cloud. The latter often suggests a potential price reversal.
Given this downward momentum, the anticipation is for a bearish continuation towards the 1st support.
The 1st support is situated at 1.0741. It stands out due to its classification as an overlap support, combined with its association with the 161.80% Fibonacci Extension and 100% level, showcasing a Fibonacci confluence.
The 2nd support for the pair is at 1.0666, characterized as a swing low support, indicating a past level where price found support.
On the potential upside, the 1st resistance is pinpointed at 1.0837, described as an overlap resistance. Such resistances represent levels where past price action might have encountered barriers.
Further, the 2nd resistance is at 1.0923, another overlap resistance, hinting at a previous zone of contention for price movements.
Additionally, an intermediate resistance is observed at 1.0802, acting as a pullback resistance. This suggests a temporary halt or resistance point in case of any short-term upward retracements.
EUR/JPY:
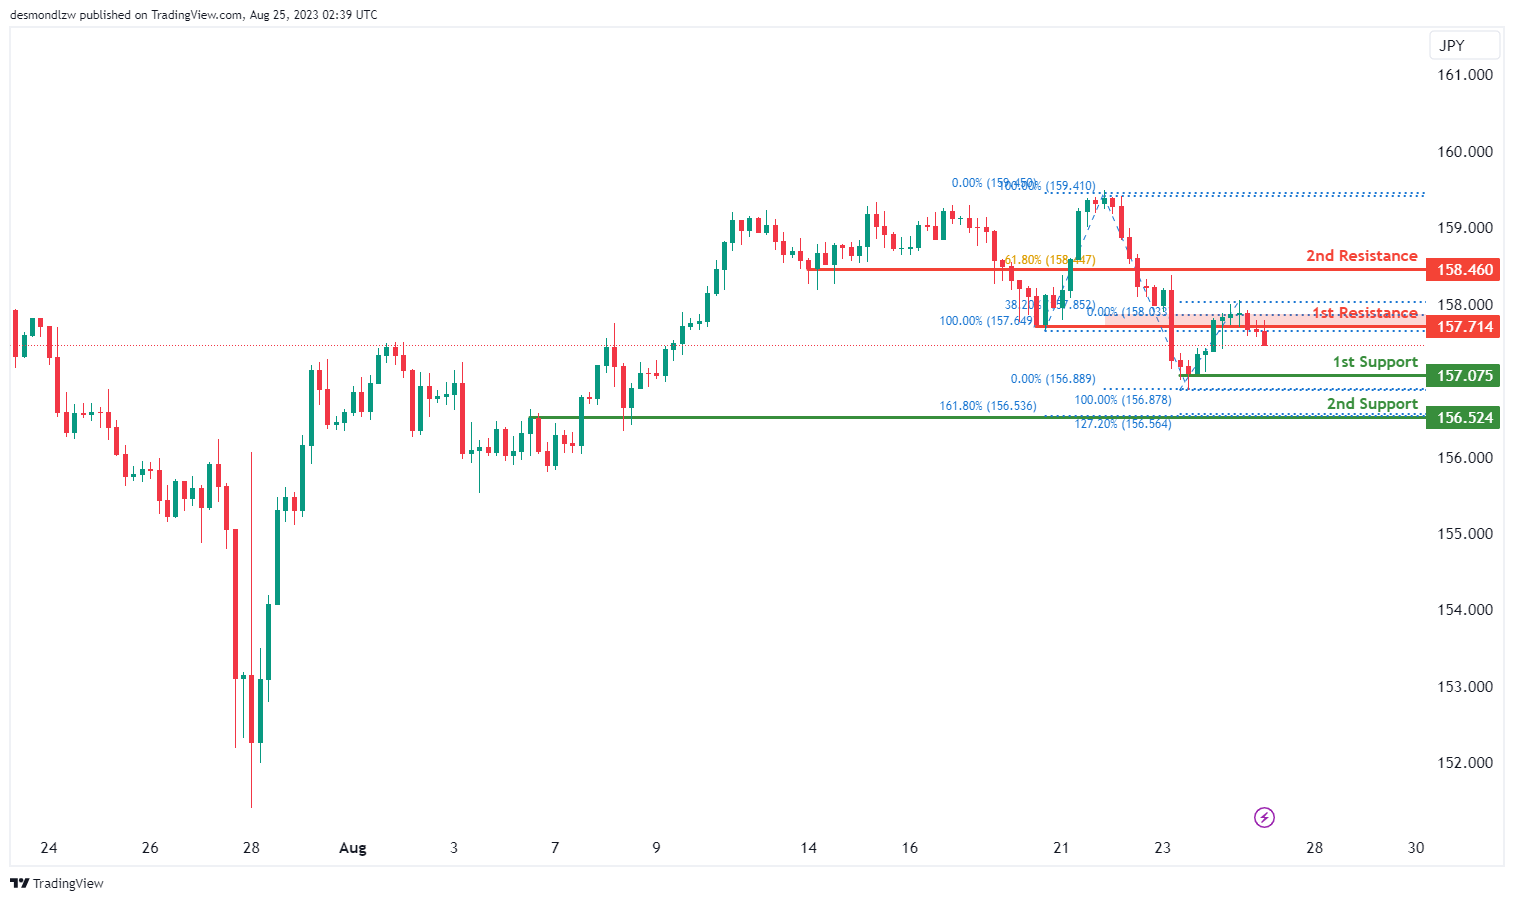
The EUR/JPY pair currently displays a bearish trend. With the prevailing downward momentum, there’s an expectation for a bearish continuation moving towards the 1st support.
The 1st support for the pair is positioned at 157.07, recognized primarily as a swing low support. This denotes a previous level where the price found significant support.
The 2nd support stands at 156.52. Its significance arises from its dual characteristic: it is identified as an overlap support, a level with historical price interactions, and aligns with Fibonacci extensions at both 161.80% and 127.20%. Such confluence often strengthens the validity of a support or resistance level.
On the potential upside, the 1st resistance is marked at 157.71. Acting as a pullback resistance, it also intersects with the 38.20% Fibonacci Retracement, suggesting it could be a potent barrier in case of any upward retracements.
Beyond this level, the 2nd resistance is located at 158.46. Like the previous resistance, it too is a pullback resistance but corresponds with the 61.80% Fibonacci Retracement, adding further weight to its potential as a significant resistance point.
EUR/GBP:
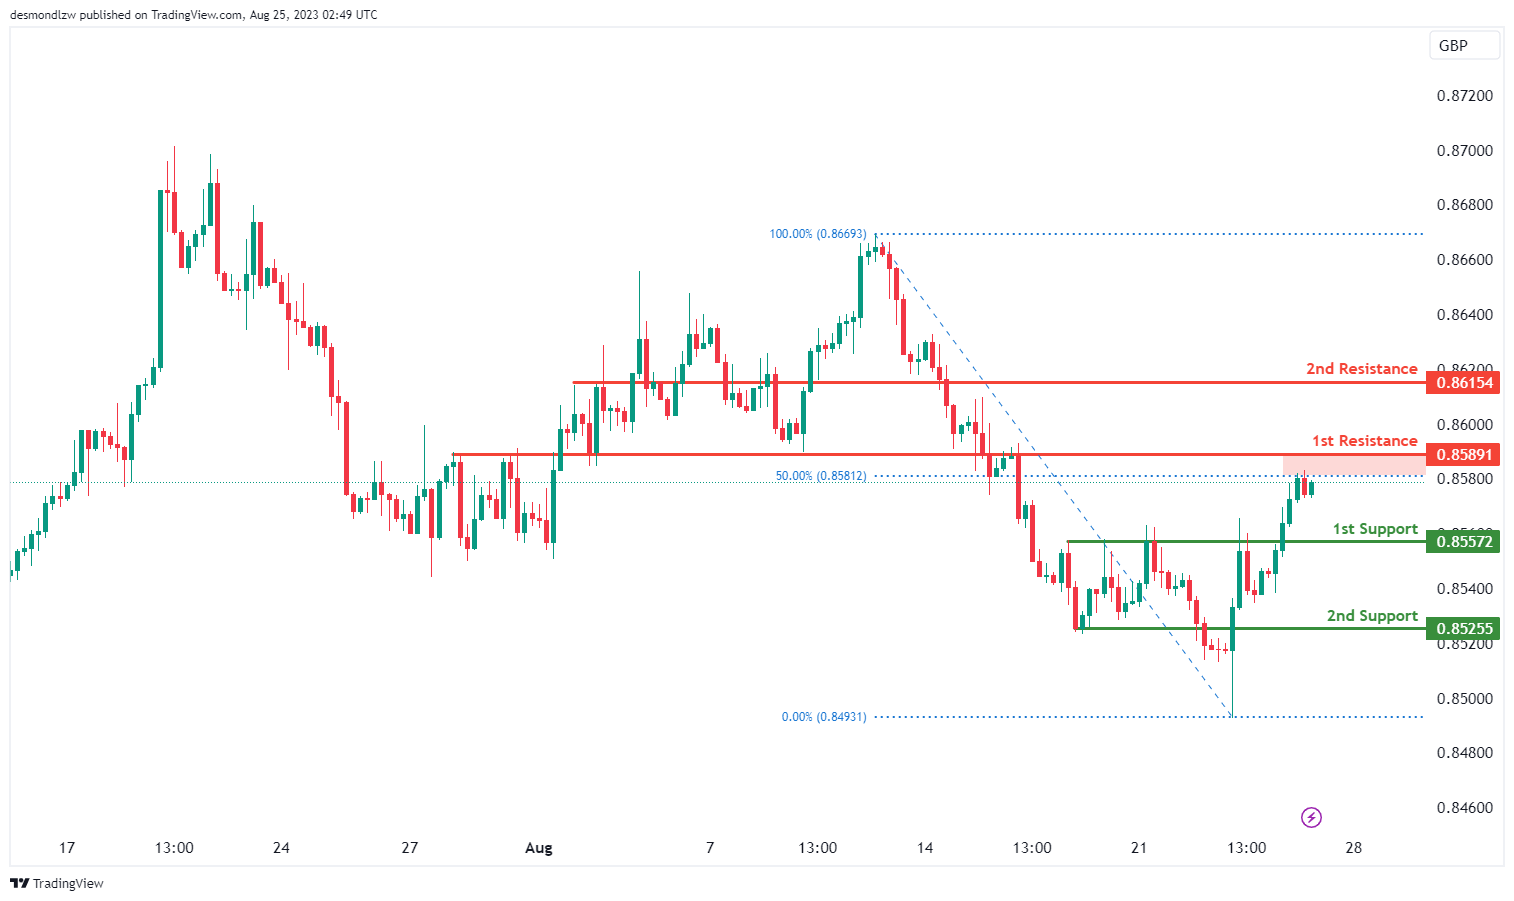
The EUR/GBP currency pair is currently exhibiting a bearish momentum. Given this prevailing downtrend, there’s a potential for a bearish reaction upon hitting the 1st resistance, following which the price might drop towards the 1st support.
The 1st support for the pair is set at 0.8557. This level is identified as a pullback support, suggesting it’s an area where the price could find a cushion or stabilization upon a retracement.
The 2nd support comes in slightly lower at 0.8525, and it too acts as a pullback support, indicating another probable zone of stability in case of further downward movement.
Interestingly, the 1st resistance level coincides with the 1st support, situated at 0.8557. It’s termed as an overlap resistance, highlighting its historical significance as a level where the price has shown previous interactions. This resistance is further emphasized due to its alignment with the 50% Fibonacci Retracement, which can act as a pivotal barrier for price actions.
The 2nd resistance is marked at 0.8615. It is identified as a pullback resistance, indicating a potential halt or slowdown in price upon an upward movement.
GBP/USD:
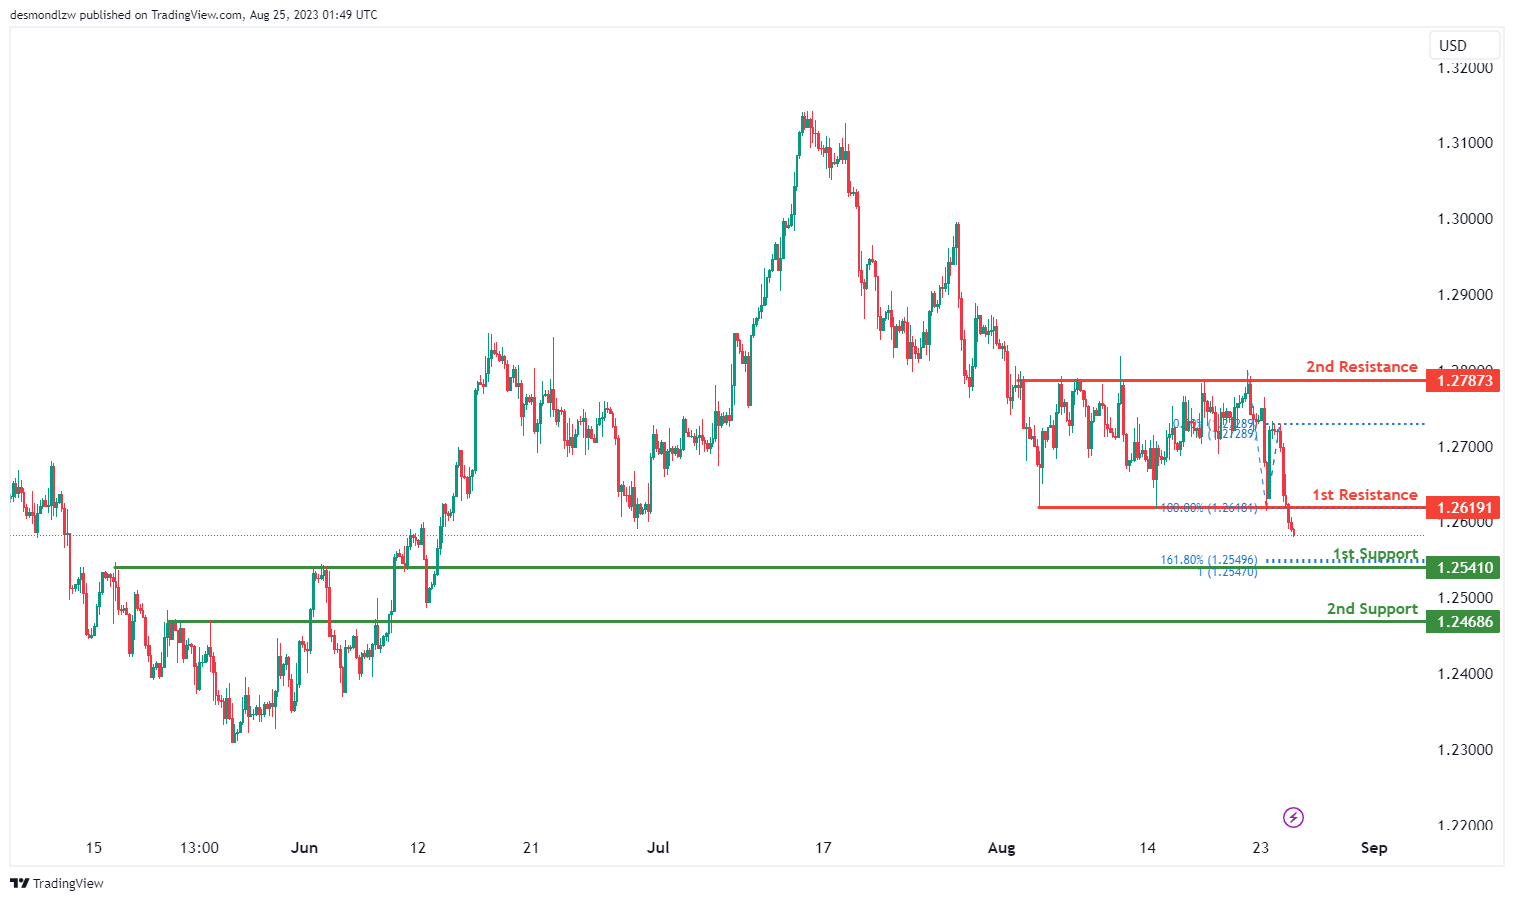
The overall momentum of the GBP/USD chart is bearish, indicating a trend of downward movement. This bearish momentum is supported by the fact that the price is currently positioned in a manner that suggests the potential for further declines.
In the given scenario, there is a possibility that the price could continue its bearish movement, targeting the 1st support level at 1.2541. This support level is notable for its association with a pullback support, as well as the presence of the 161.80% Fibonacci Extension and the 100% Fibonacci Projection. The convergence of these Fibonacci levels further strengthens the significance of this support.
For additional potential support, the 2nd support level at 1.2468 is identified. This level is characterized as a pullback support, which may contribute to a potential bounce in the price.
On the resistance side, the 1st resistance at 1.2619 is recognized as a point of interest. This resistance level is attributed to pullback resistance, suggesting potential hurdles for any upward movement.
Furthermore, the 2nd resistance at 1.2787 holds importance as it aligns with multi-swing high resistance, indicating a historically strong level of resistance.
GBP/JPY:
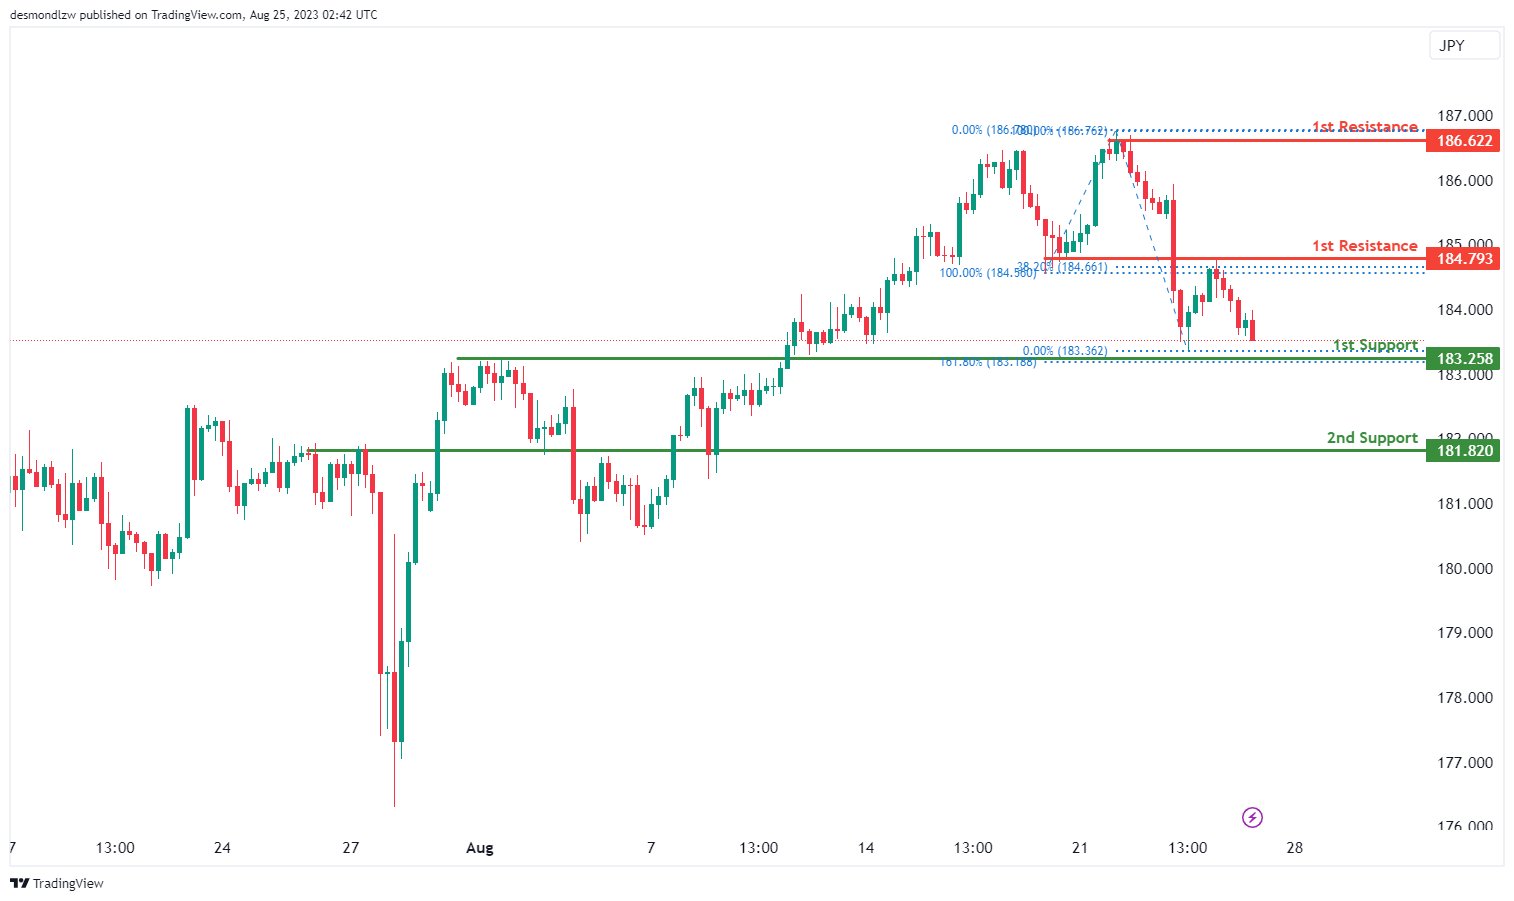
The GBP/JPY pair currently indicates a bearish momentum. However, there’s an expectation for some short-term bullish activity. This involves a potential bullish bounce off the 1st support, leading the price towards the 1st resistance. After reaching this point, there’s anticipation that the price could retract, falling back to the 1st support level.
The 1st support for the pair is anchored at 183.25. This level stands out as an overlap support, signifying its historical relevance where price has previously encountered support. Additionally, this support level is underscored by the 161.80% Fibonacci Extension, making it a potent level to watch.
A bit lower, the 2nd support is situated at 181.82. Similar to the previous one, this is also recognized as an overlap support, which is derived from past price interactions, reinforcing its significance.
On the potential upside, the 1st resistance is marked at 184.79. Acting as a pullback resistance, this level also intersects with the 38.20% Fibonacci Retracement. This indicates that in the event of an upward movement, this could be a strong point of contention for the price.
Further up, the 2nd resistance is located at 186.62. This level is characterized as a multi-swing high resistance, suggesting that it has been a significant barrier during multiple price swings in the past.
USD/CHF:
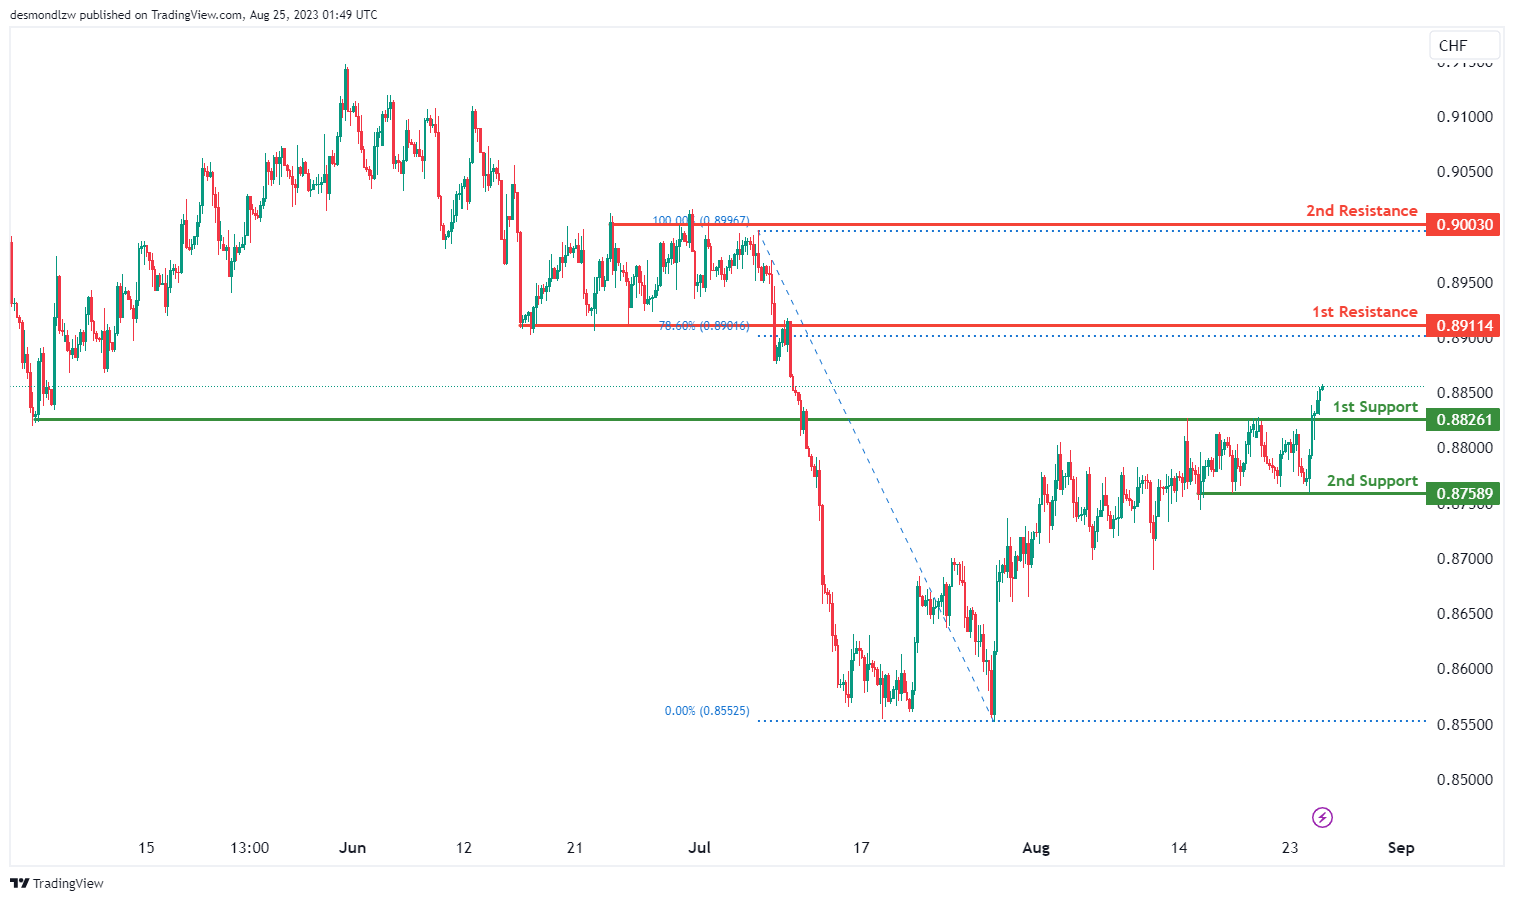
The USD/CHF pair currently showcases a bullish trend. Given this upward momentum, there’s a potential for a bullish continuation towards the specified resistances.
The 1st support for the pair lies at 0.8826, recognized as a pullback support. This indicates that should there be any minor retracements or downward movement, this level might act as a cushion.
Following this, the 2nd support is positioned at 0.8758. Its significance is accentuated by its history as a multi-swing low support, making it a potential region where the price could find substantial support.
On the upward trajectory, the 1st resistance is pinpointed at 0.8911. This level serves as an overlap resistance, suggesting that past price action has interacted with this level, potentially making it a challenging point for the price to surpass.
Above this, the 2nd resistance stands at 0.9003. Its importance stems from its designation as a multi-swing high resistance, marking it as a notable hurdle for any continued bullish moves.
USD/JPY:
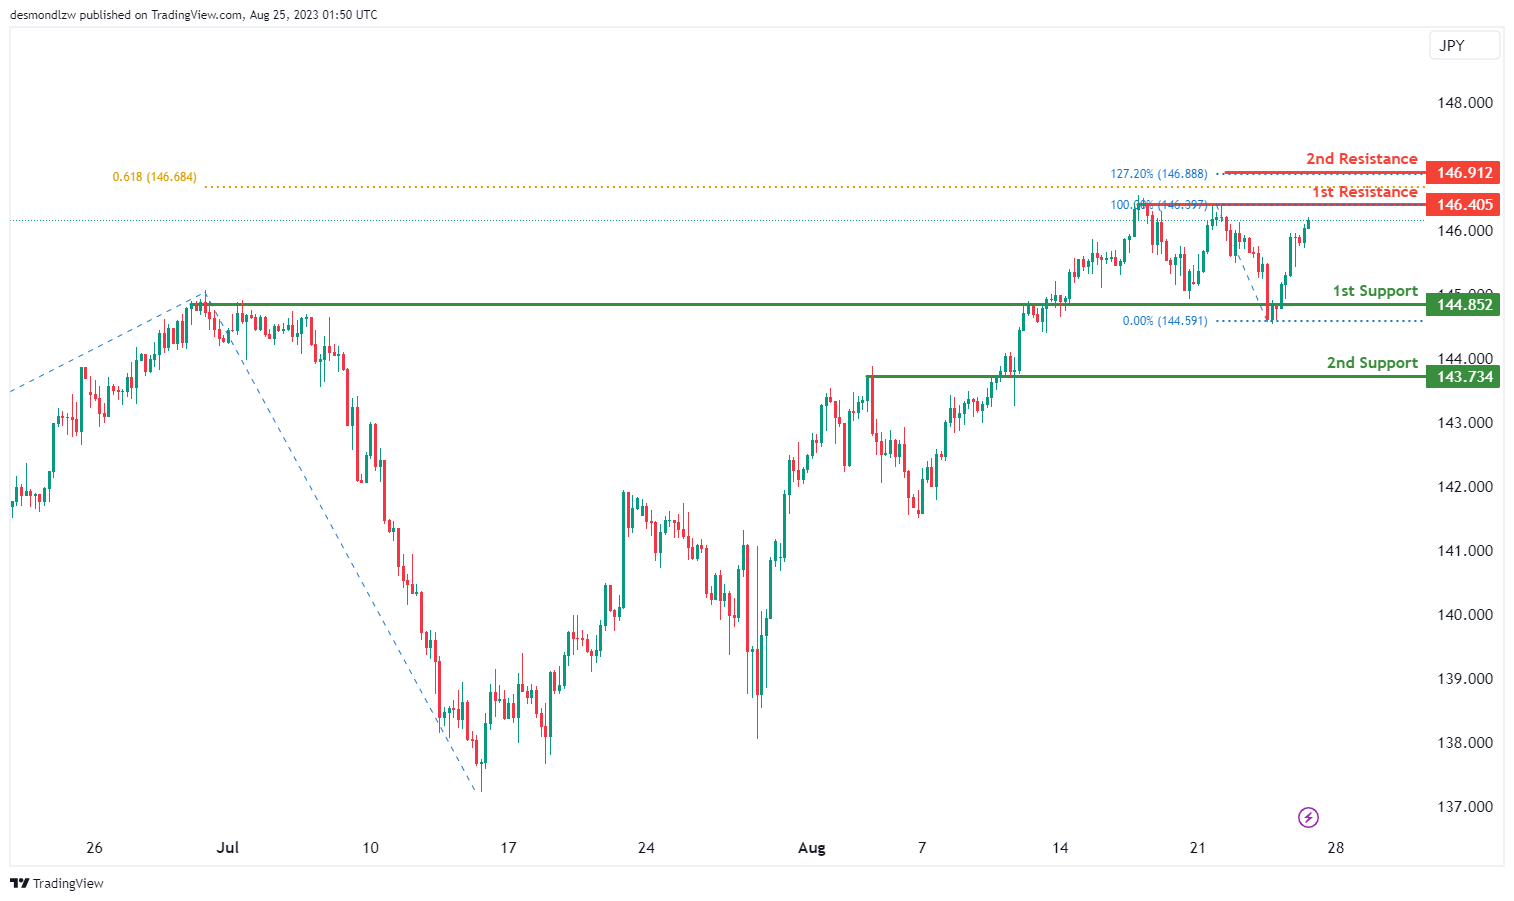
The USD/JPY is displaying a bullish momentum at present. Given this positive trend, there’s an anticipation for a continued upward move towards the identified resistance levels.
The 1st support for the pair is found at 144.85 and is characterized as a pullback support. This means in the event of any short-term retracements, this level could offer a significant point of stability.
The 2nd support comes in at 143.73 and is deemed an overlap support. Overlap supports often have historical significance where the price has interacted multiple times, providing a sturdy base for potential rebounds.
On the bullish front, the 1st resistance is set at 146.40, acting as a pullback resistance. This could be a point where the price might face some resistance, given the pullback characteristics.
Above this level, the 2nd resistance stands tall at 146.91. This resistance is especially notable due to its alignment with the 127.20% Fibonacci Extension, which often serves as crucial pivot points in the market.
USD/CAD:
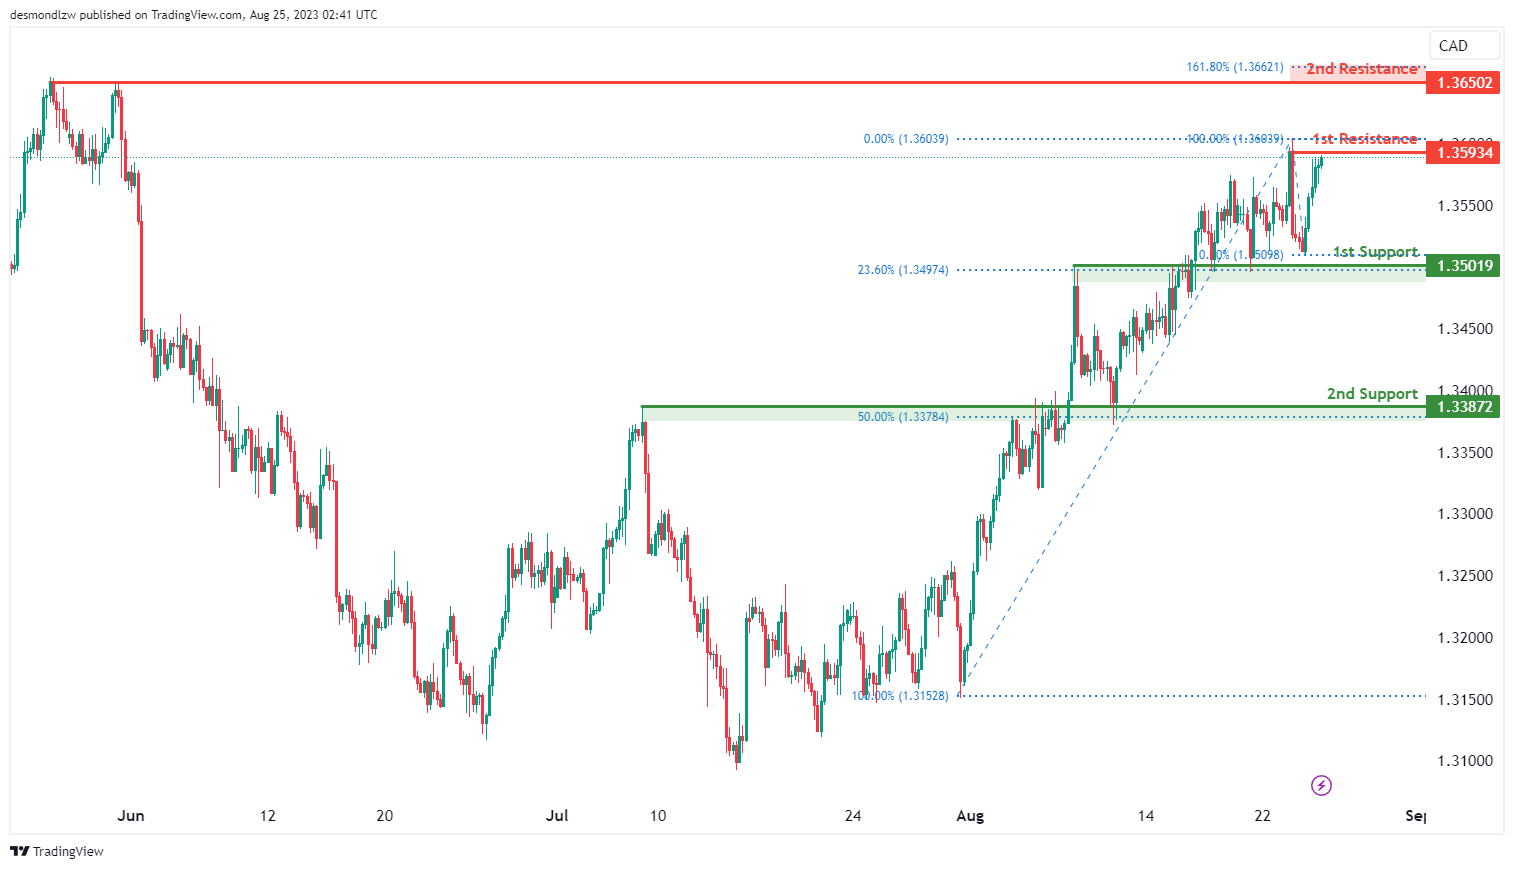
The USD/CAD chart is currently demonstrating a bullish momentum. One of the salient indicators reinforcing this trend is the potential for the price to not only approach but to break through the 1st resistance and then make its way towards the 2nd resistance.
The 1st resistance at 1.3593 is identified as a swing-high resistance while the 2nd resistance at 1.3650 is identified as a multiple swing-high resistance that aligns close to the 161.80% Fibonacci extension level, acting as a potential formidable upside barrier.
The 1st support level at 1.3502 is identified as an overlap support that aligns with the 23.60% Fibonacci retracement level. Furthermore, the 2nd support at 1.3387 is also identified as another overlap support that aligns with the 50.00% Fibonacci retracement level.
AUD/USD:
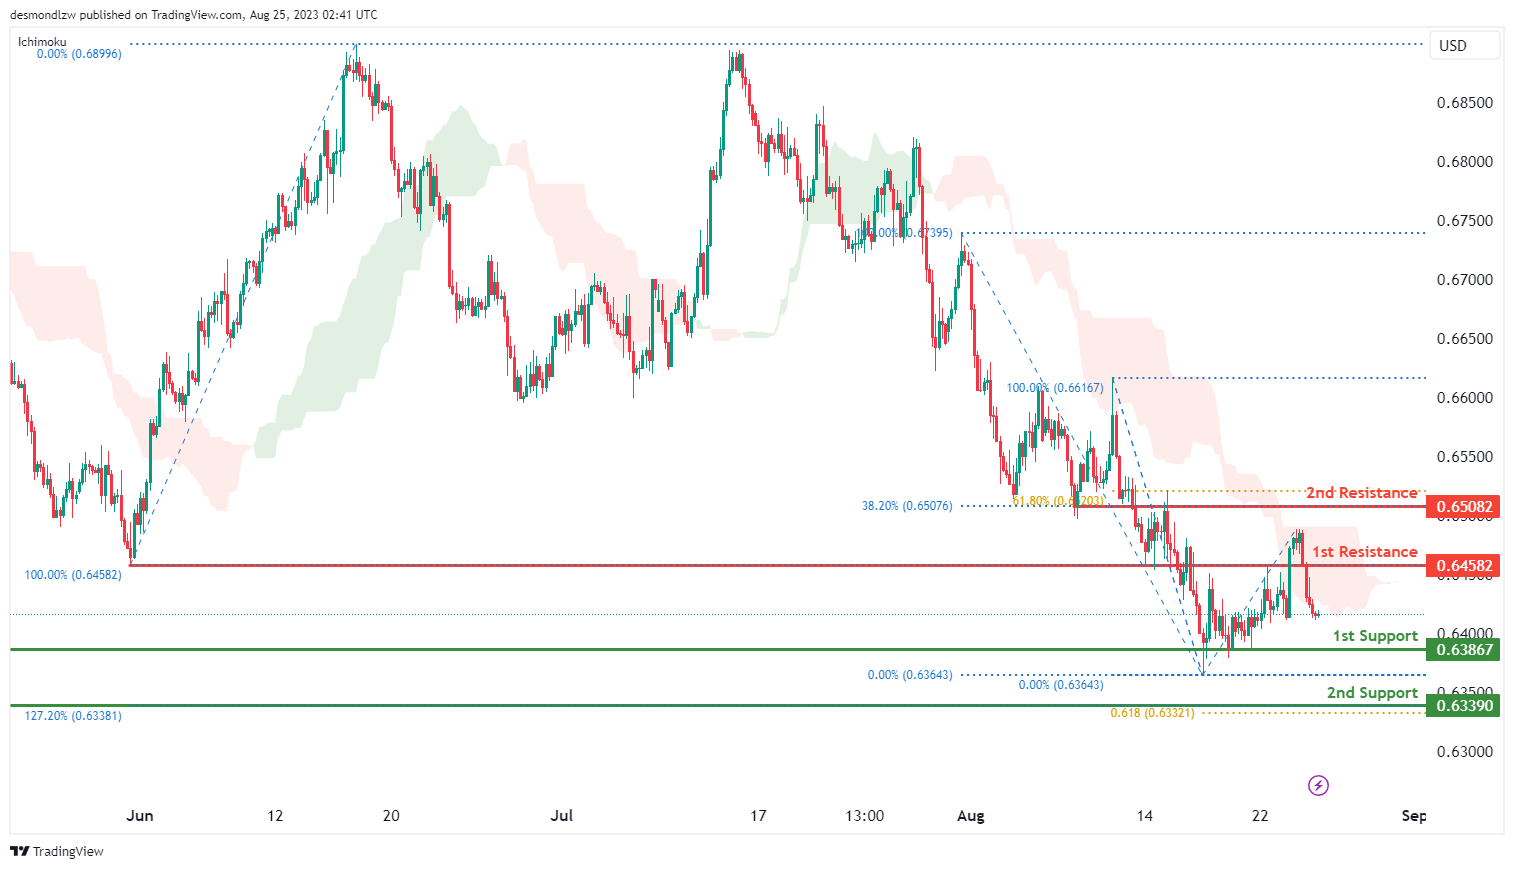
The AUD/USD chart is currently displaying a bearish trend, primarily driven by its position below the bearish Ichimoku cloud. This positioning usually indicates a potential for further downside movement.
The 1st support level at 0.6387 is identified as an overlap support. The 2nd support level at 0.6339 is identified as a pullback support that aligns with a confluence of Fibonacci levels i.e. the 61.80% projection and the 127.20% extension levels, bolstering the significance of this support level.
To the upside, the 1st resistance level at 0.6458 is identified as an overlap resistance. Furthermore, the 2nd resistance level at 0.6508 is also identified as an overlap resistance that aligns with a confluence of Fibonacci levels i.e. the 38.20% and 61.80% retracement levels, suggesting that this level could act as a significant resistance.
NZD/USD
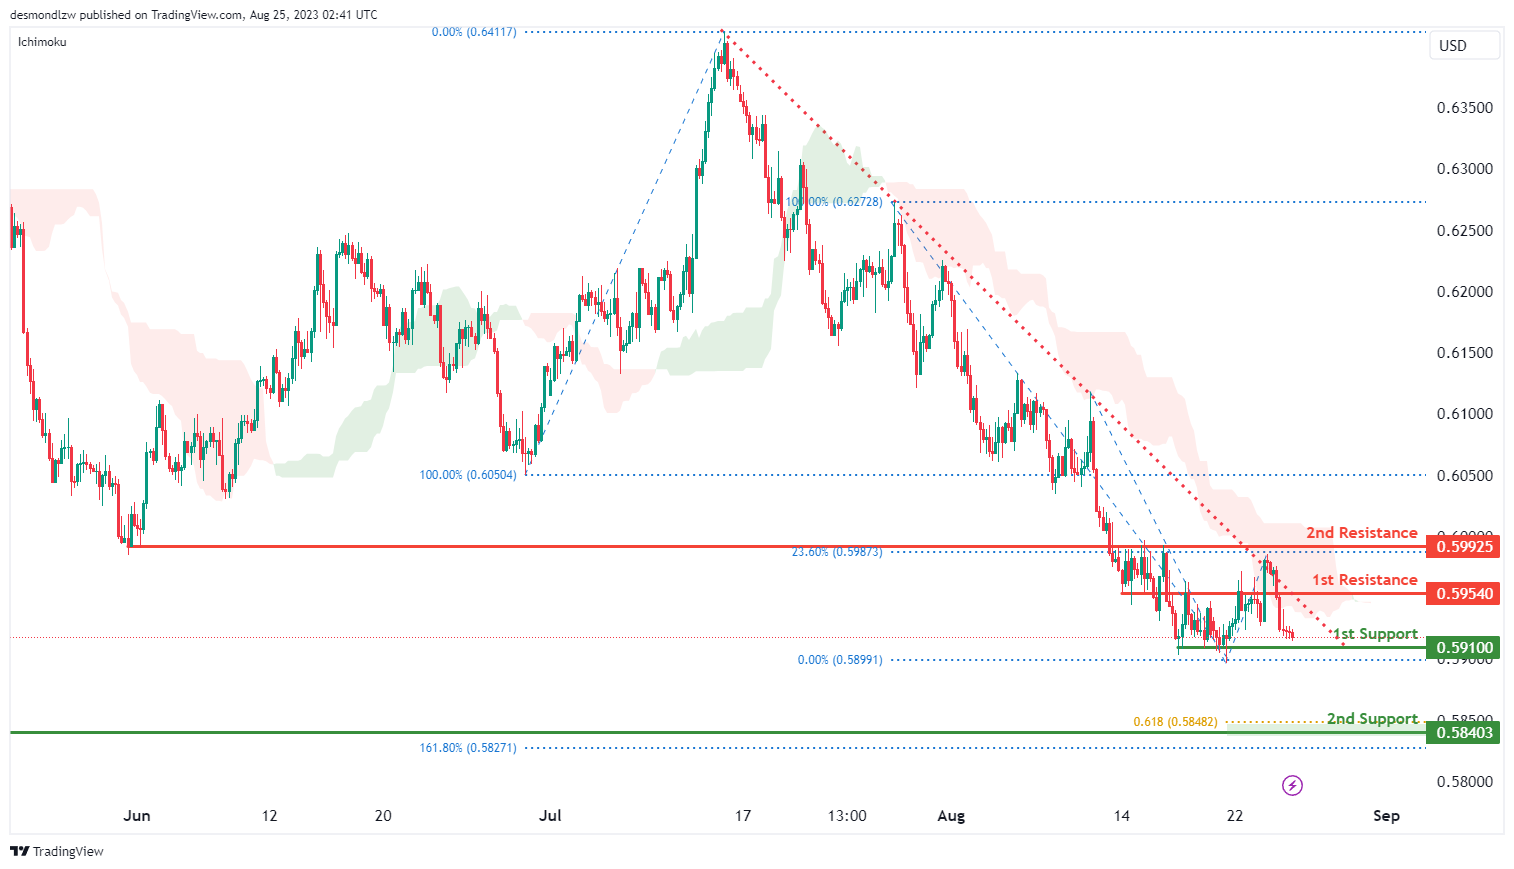
The NZD/USD chart currently demonstrates a bearish momentum. A significant factor underscoring this trend is its position below the bearish Ichimoku cloud, often indicative of further potential downside. There is potential for price to continue its downward trajectory towards the 1st support level.
The 1st support level at 0.5910 is identified as a multiple swing-low support. The 2nd support level at 0.5840 is identified as a pullback support that aligns with a confluence of Fibonacci levels i.e. the 61.80% projection and the 161.80% extension levels.
To the upside, the 1st resistance at 0.5954 is identified as an overlap resistance. Furthermore, the 2nd resistance at 0.5993 is also identified as an overlap resistance that aligns with the 23.60% Fibonacci retracement level.
DJ30:
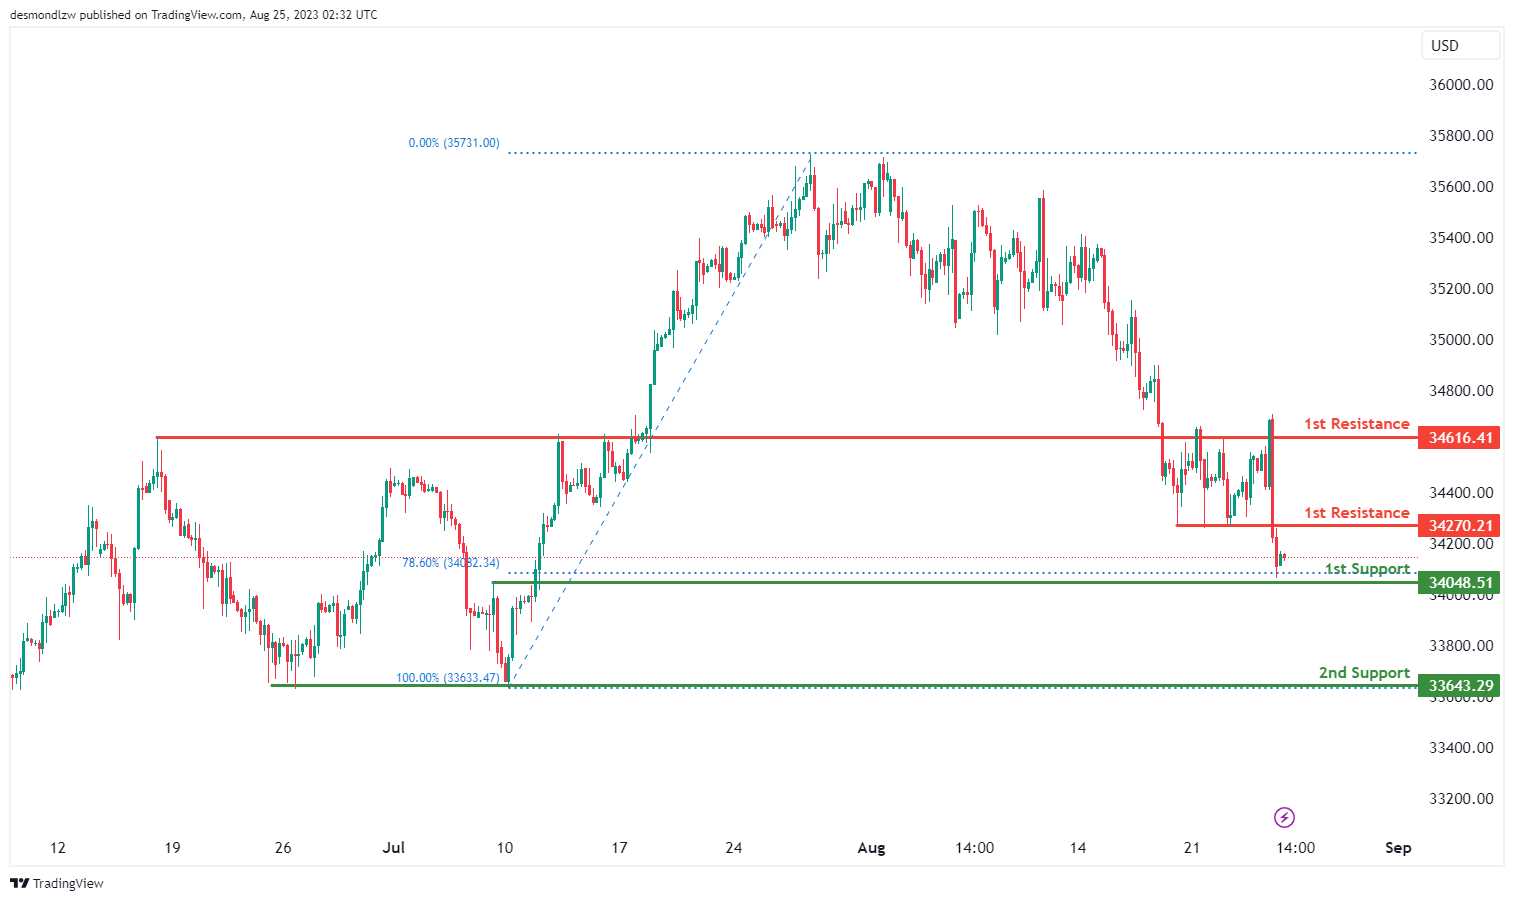
The DJ30 (often referred to as the Dow Jones Industrial Average) is demonstrating a bearish trend as per the given data. In the short-term, the market may react bearishly when it touches the 1st resistance, pushing prices to descend towards the 1st support.
The 1st support is identified at 34048.51. This particular level is characterized as an overlap support. Overlap supports are typically derived from previous areas where the price has found stability or a halt in its decline.
Further down, the 2nd support rests at 33643.29. This is recognized as a multi-swing low support, indicating that during several price actions in the past, this level has consistently acted as a strong foundation, preventing further price declines.
In terms of upward barriers, the 1st resistance is pegged at 34270.21. This level is marked as an overlap resistance, suggesting its historical significance in preventing an upward price movement.
Moving further up, the 2nd resistance is noted at 34616.41. Similarly, it’s highlighted as an overlap resistance, emphasizing its potential role in capping any significant bullish price actions.
GER30:
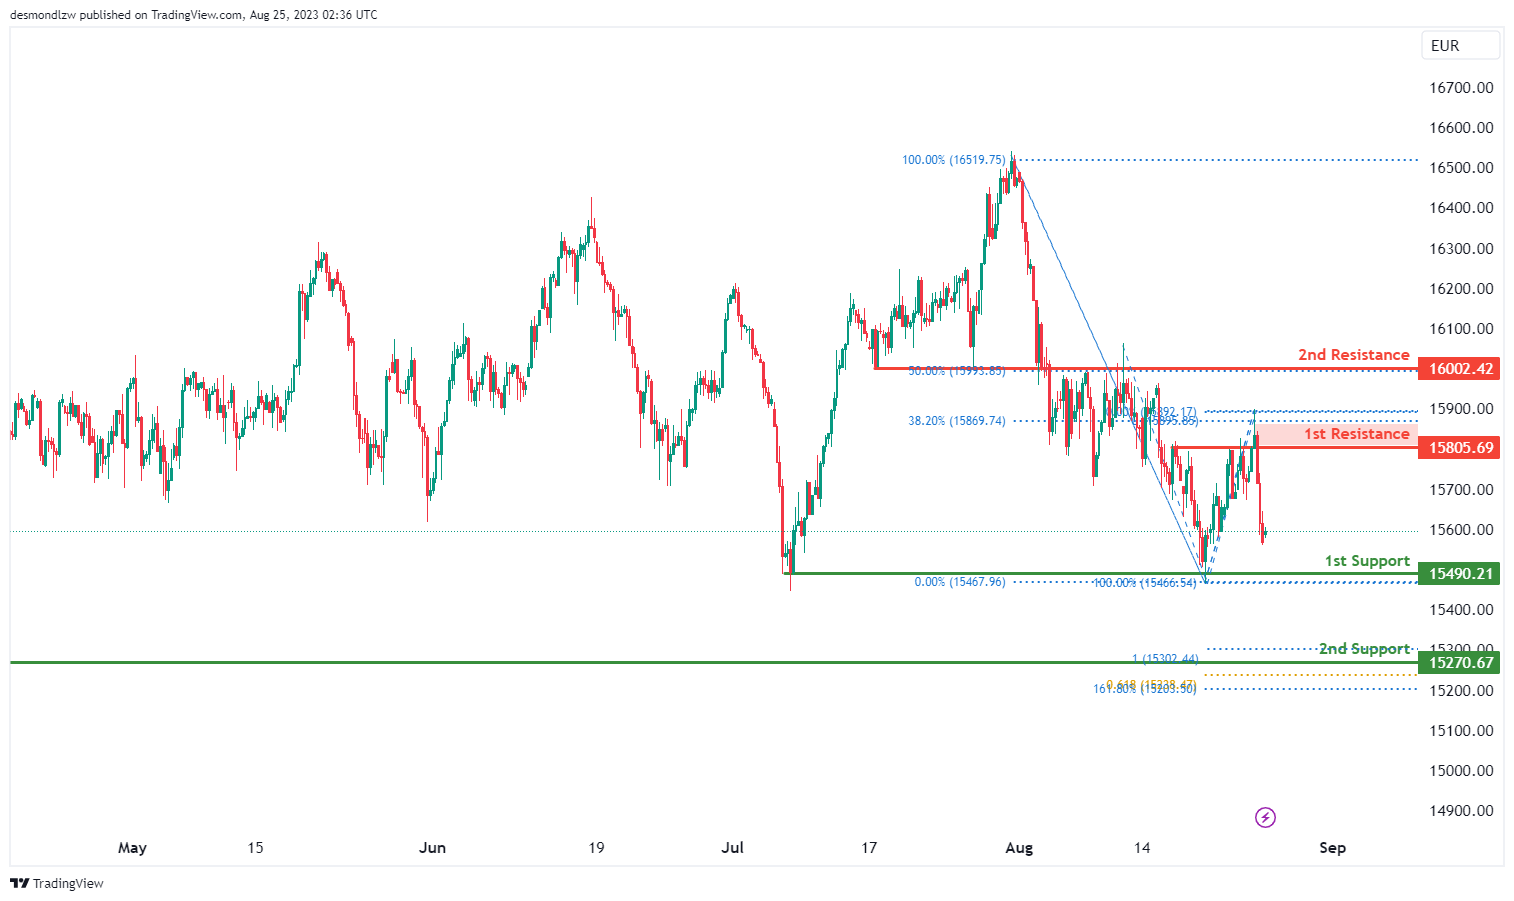
The GER30 (often known as the DAX 30) is exhibiting a bearish momentum based on the provided data. There’s an anticipation for a bearish continuation, which means the index might further decline towards its 1st support level in the near term.
The 1st support for GER30 is pinpointed at 15490.21. This support level has been identified as a multi-swing low support. Such supports are derived from multiple past instances where the price halted its downward movement and even reversed, signaling its crucial role in preventing further declines.
A bit deeper, the 2nd support stands at 15270.67. It’s recognized as a swing low support. Furthermore, it aligns with the 100% Fibonacci Projection, adding more weight to its importance as a potential floor for price declines.
On the potential upward trajectory, the 1st resistance is observed at 15805.69. This resistance point is seen as a multi-swing high resistance, which means it has acted as a ceiling in several past price movements. Additionally, it’s highlighted by the 38.20% Fibonacci Retracement, which indicates a possible retracement level from a previous price movement.
Moving higher, the 2nd resistance is marked at 16002.42. It’s identified as an overlap resistance. This kind of resistance is derived from areas where the price previously encountered hurdles. Further reinforcing its importance is the 50% Fibonacci Retracement, which can act as a key level of interest for traders.
US500
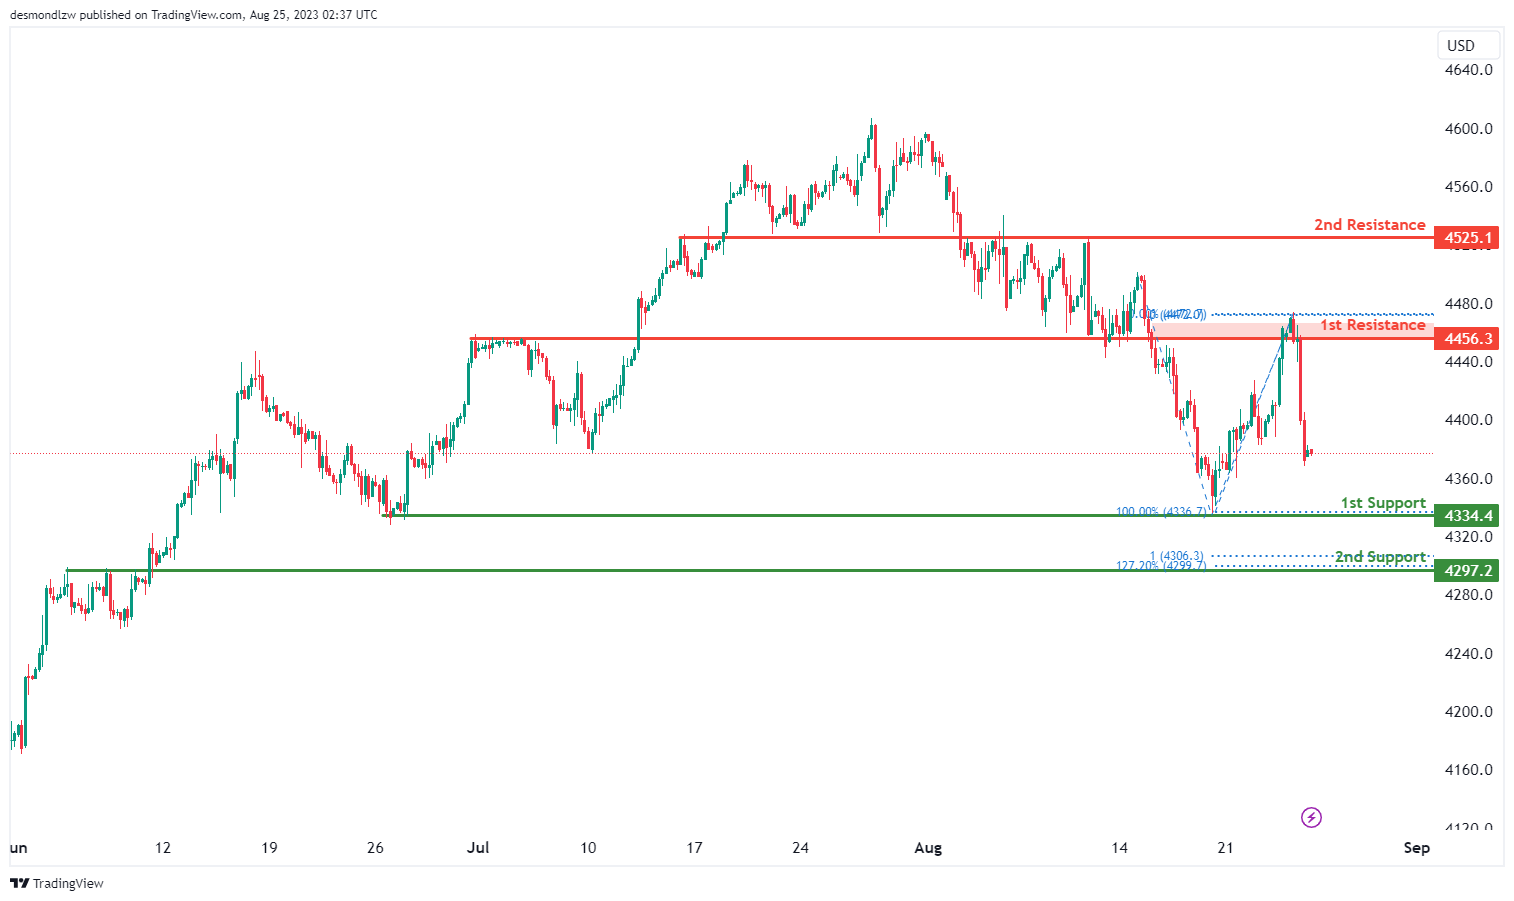
The overall momentum of the US500 (S&P 500) chart is currently bearish, indicating a prevailing trend of downward movement. In this context, there is a possibility that the price could continue its bearish trajectory, with potential levels of support and resistance highlighted for consideration.
The 1st support level at 4334.4 is identified as a point where the price might find some stabilization. This support level is significant due to its association with an overlap support, suggesting that historical price action has demonstrated strength around this level.
Additionally, the 2nd support at 4297.2 holds importance, as it coincides with an overlap support and the 127.20% Fibonacci Extension. The presence of the Fibonacci Extension further reinforces the potential significance of this support level.
On the resistance side, the 1st resistance level at 4456.3 is recognized as an area where the price may encounter obstacles. This resistance level is characterized by an overlap resistance, indicating that historical price action has shown resistance around this level.
Furthermore, the 2nd resistance at 4525.1 is noted as another potential barrier for upward movement. This resistance level is categorized as an overlap resistance, further emphasizing its potential significance.
BTC/USD:
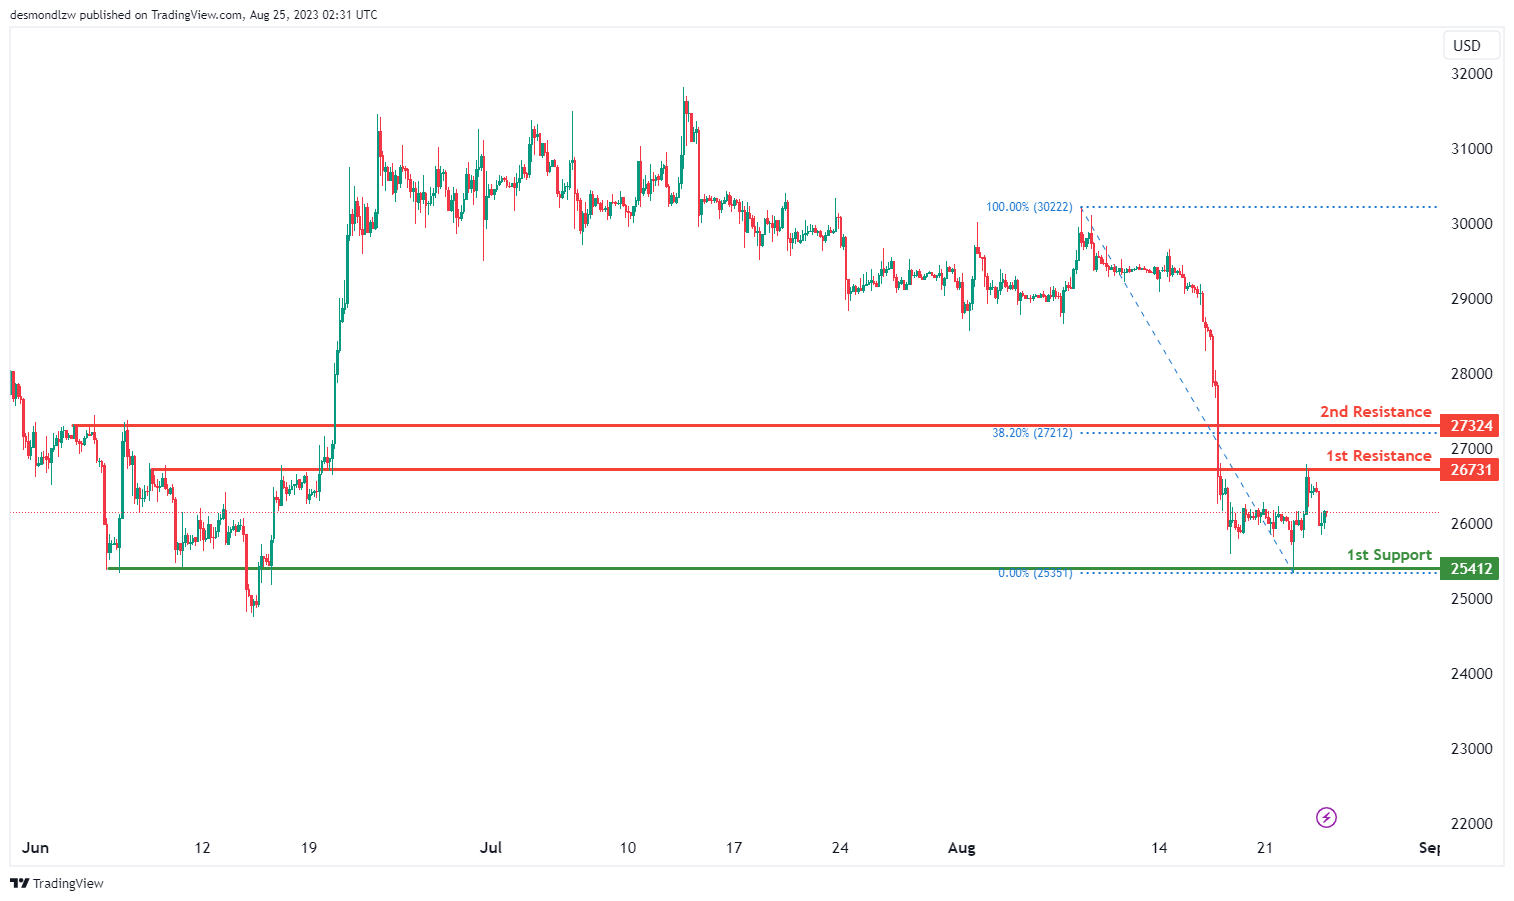
The BTC/USD chart is currently demonstrating a neutral trend. It is anticipated that the price might fluctuate between the 1st resistance and 1st support levels.
The 1st support level at 25,412 is identified as a pullback support, suggesting it’s a key point at which price could find support once more.
To the upside, the 1st resistance at 26,731 is identified as a pullback resistance while the 2nd resistance at 27,324 is also identified as a pullback resistance that aligns with the 38.20% Fibonacci retracement level.
ETH/USD:
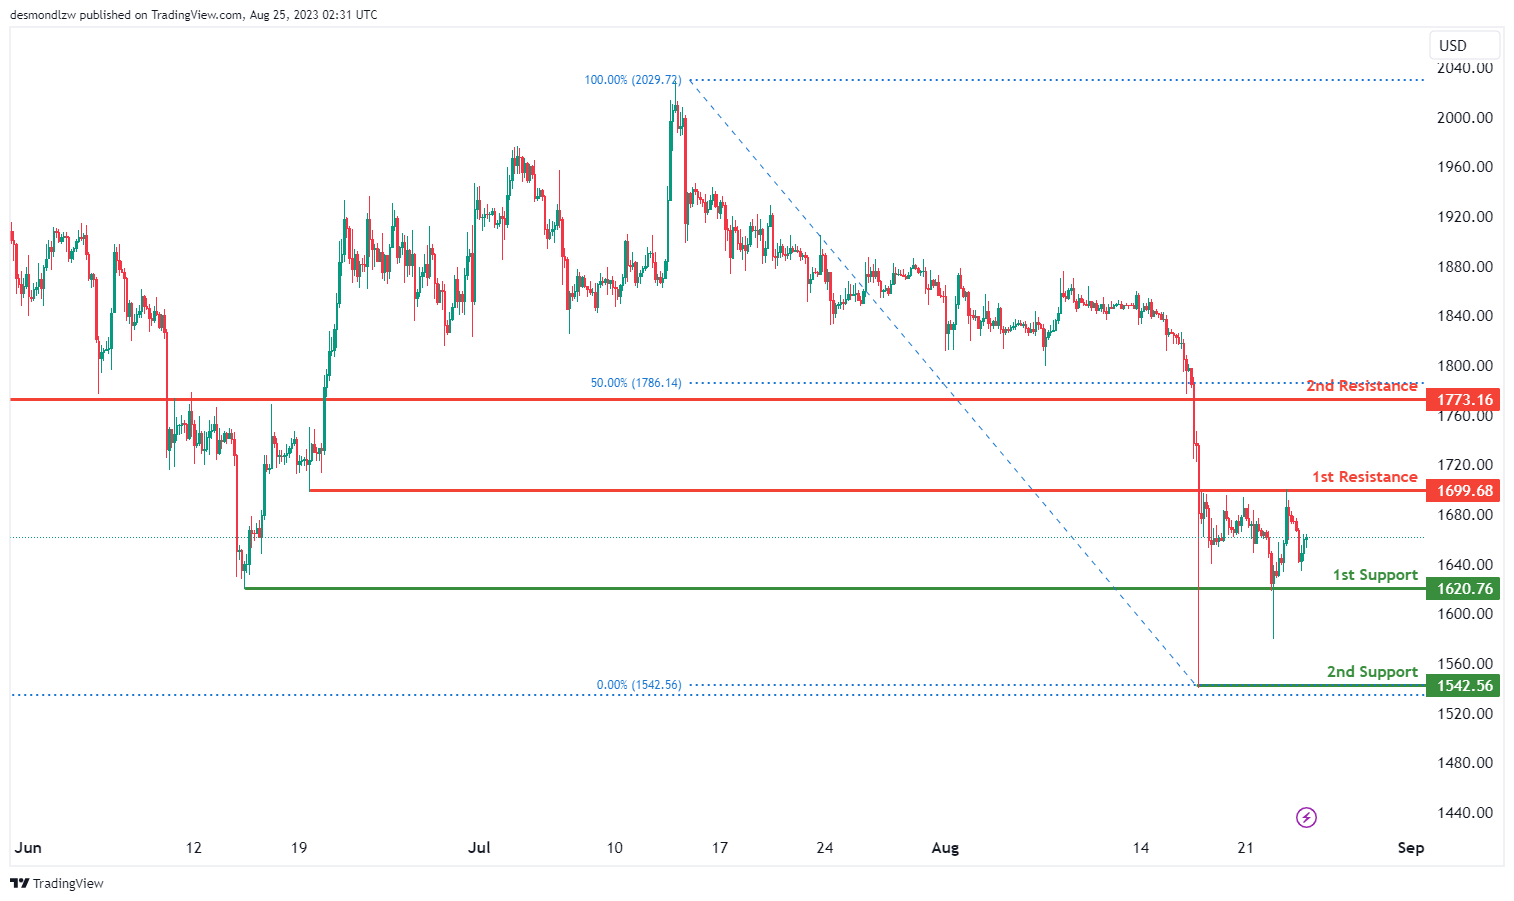
The ETH/USD chart is currently exhibiting a neutral trend and price is projected to fluctuate between the 1st resistance and 1st support levels.
The 1st support level at 1,620.76 is identified as a multiple swing-low support while the 2nd support at 1,542.56 is identified as a swing low support. This indicates it is another historically significant level where price has found support in the past.
To the upside, the 1st resistance at 1,699.68 is identified as an overlap resistance while the 2nd resistance at 1,773.16 is also identified as an overlap resistance that aligns with the 50.00% Fibonacci retracement level.
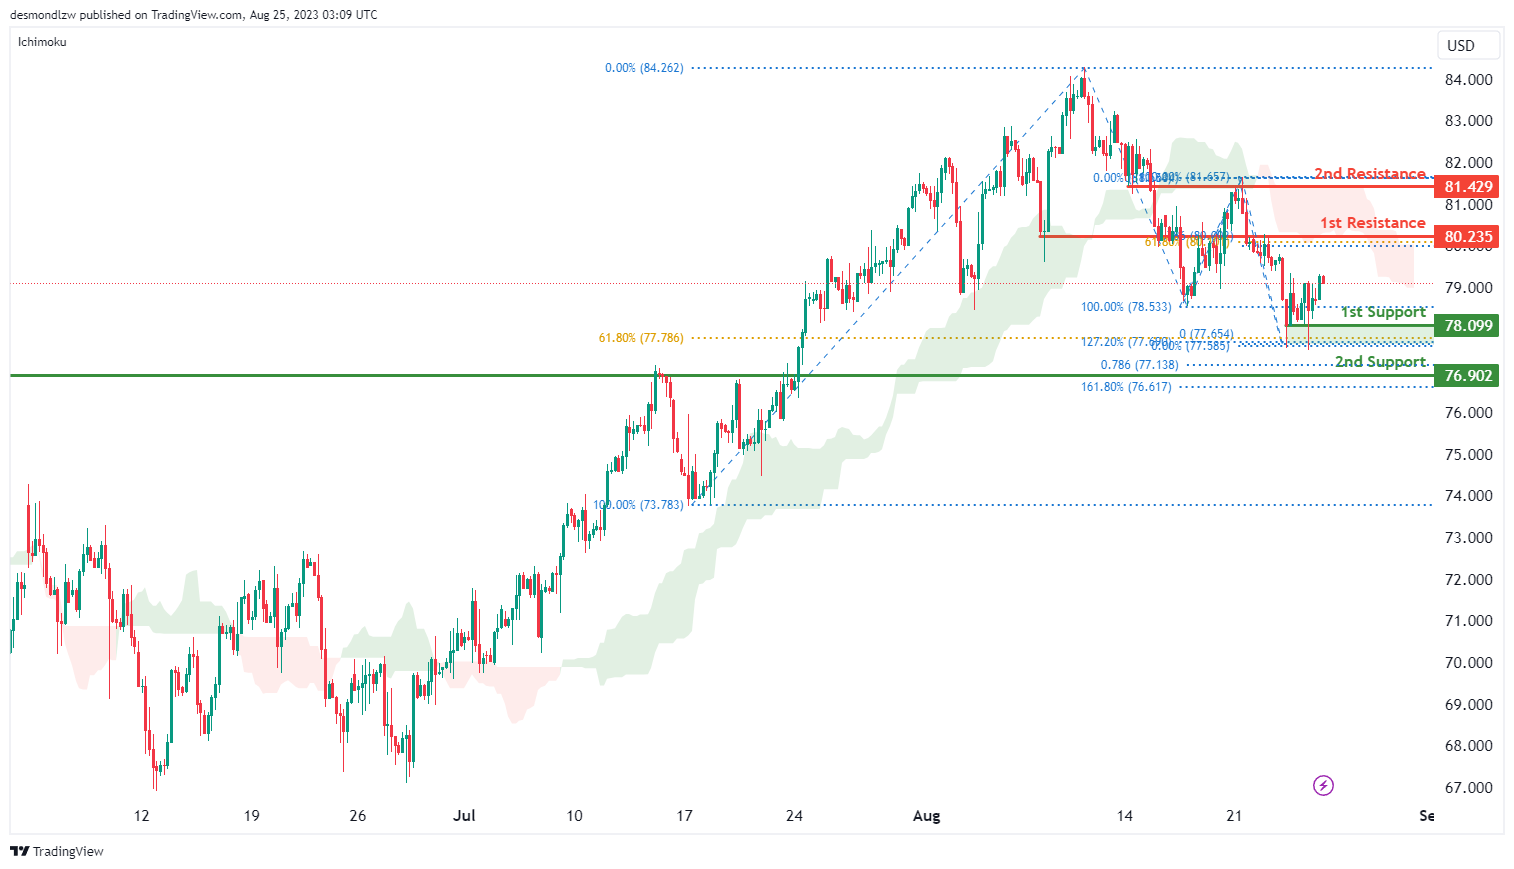
WTI/USD:
The WTI (West Texas Intermediate) chart is currently displaying a bearish momentum. One significant factor contributing to this trend is the price positioning below the bearish Ichimoku cloud, often suggesting potential further downside. There is potential for price to make a continued downward movement towards the identified support levels.
The 1st support level at 78.10 is identified as a multiple swing-low support that coincides with a confluence of Fibonacci levels i.e. the 61.80% retracement and the 127.20% extension levels, offering a stronger foundation as a potential support zone.
In addition, the 2nd support level at 76.90 is identified as an overlap support that also aligns with a confluence of Fibonacci levels i.e. the 161.80% extension and the 78.60% projection levels.
To the upside, the 1st resistance at 80.24 is identified as an overlap resistance characteristic that aligns with the 61.80% Fibonacci retracement level. Furthermore, the 2nd resistance level at 81.43 is also identified as an overlap resistance.
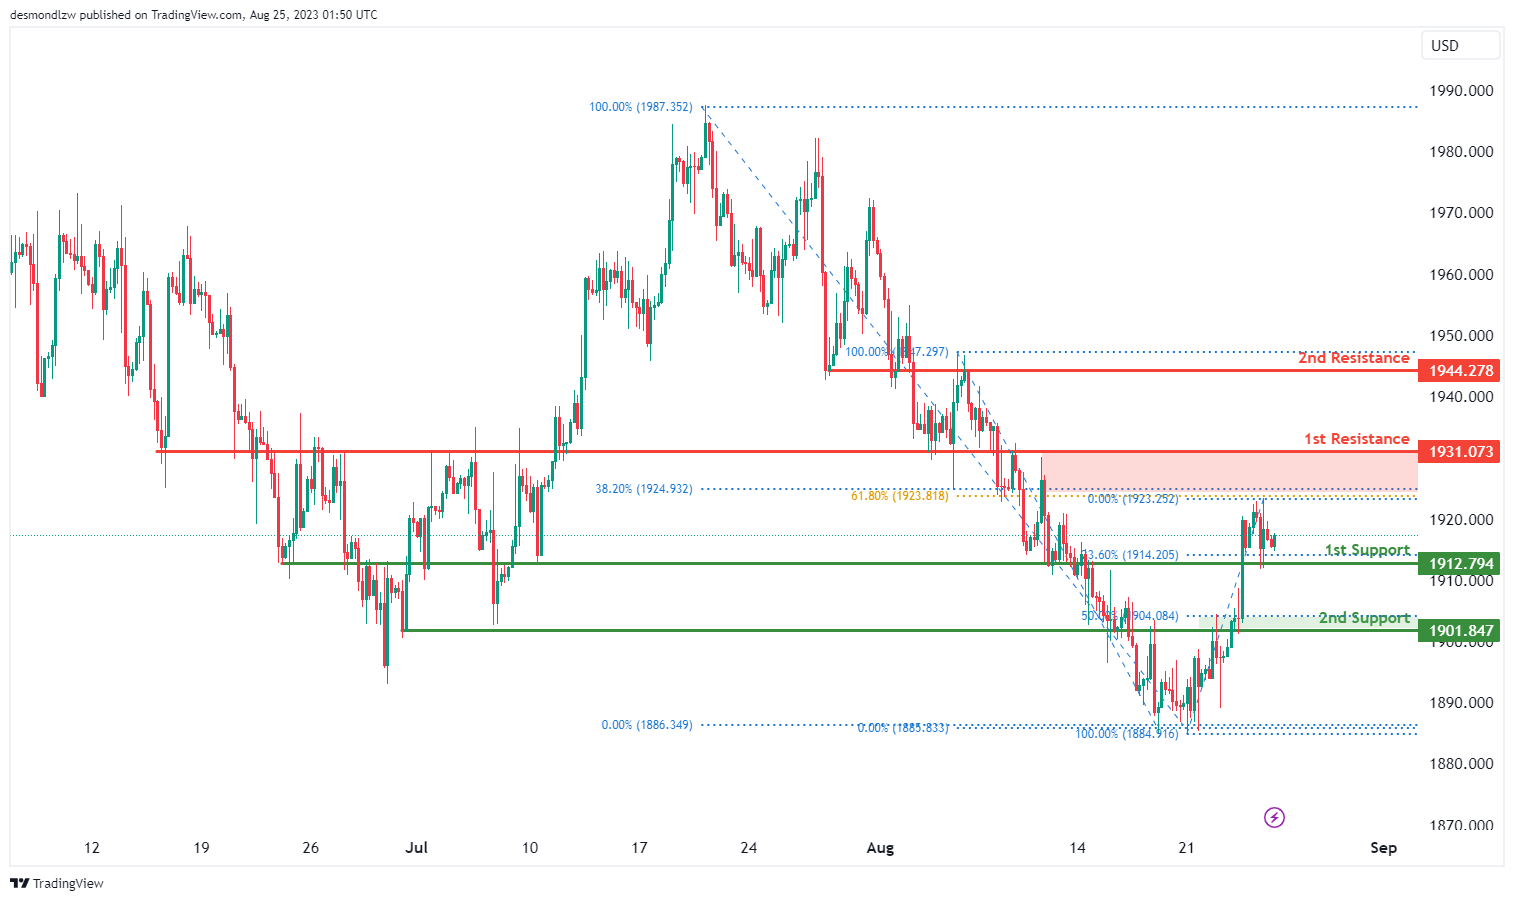
XAU/USD (GOLD):
The XAUUSD, which represents the Gold spot price in US Dollars, currently indicates a bullish trend. Given this upward momentum, there’s a strong possibility of a bullish continuation towards the specified resistance levels.
The 1st support for XAUUSD lies at 1912.79. This level is significant due to its classification as an overlap support, coupled with its alignment with the 23.60% Fibonacci Retracement. Overlap supports often represent levels where the price has shown historical interactions, and in conjunction with a Fibonacci level, its significance is further enhanced.
The 2nd support is pegged at 1901.84. This level stands out not only as a multi-swing low support but also coincides with the 50% Fibonacci Retracement, adding to its importance as a potential stabilization point in case of a pullback.
On the upside, the 1st resistance is set at 1931.07. This level acts as an overlap resistance and also shows a Fibonacci confluence, specifically with the 61.80% and 38.20% Fibonacci Retracements. Such confluences often act as robust barriers or pivot points in the market, suggesting a potential area of contention for the upward price movement.
Further ahead, the 2nd resistance is positioned at 1944.27, which also serves as an overlap resistance, indicating another potential challenge for the bullish momentum.


