
DXY:
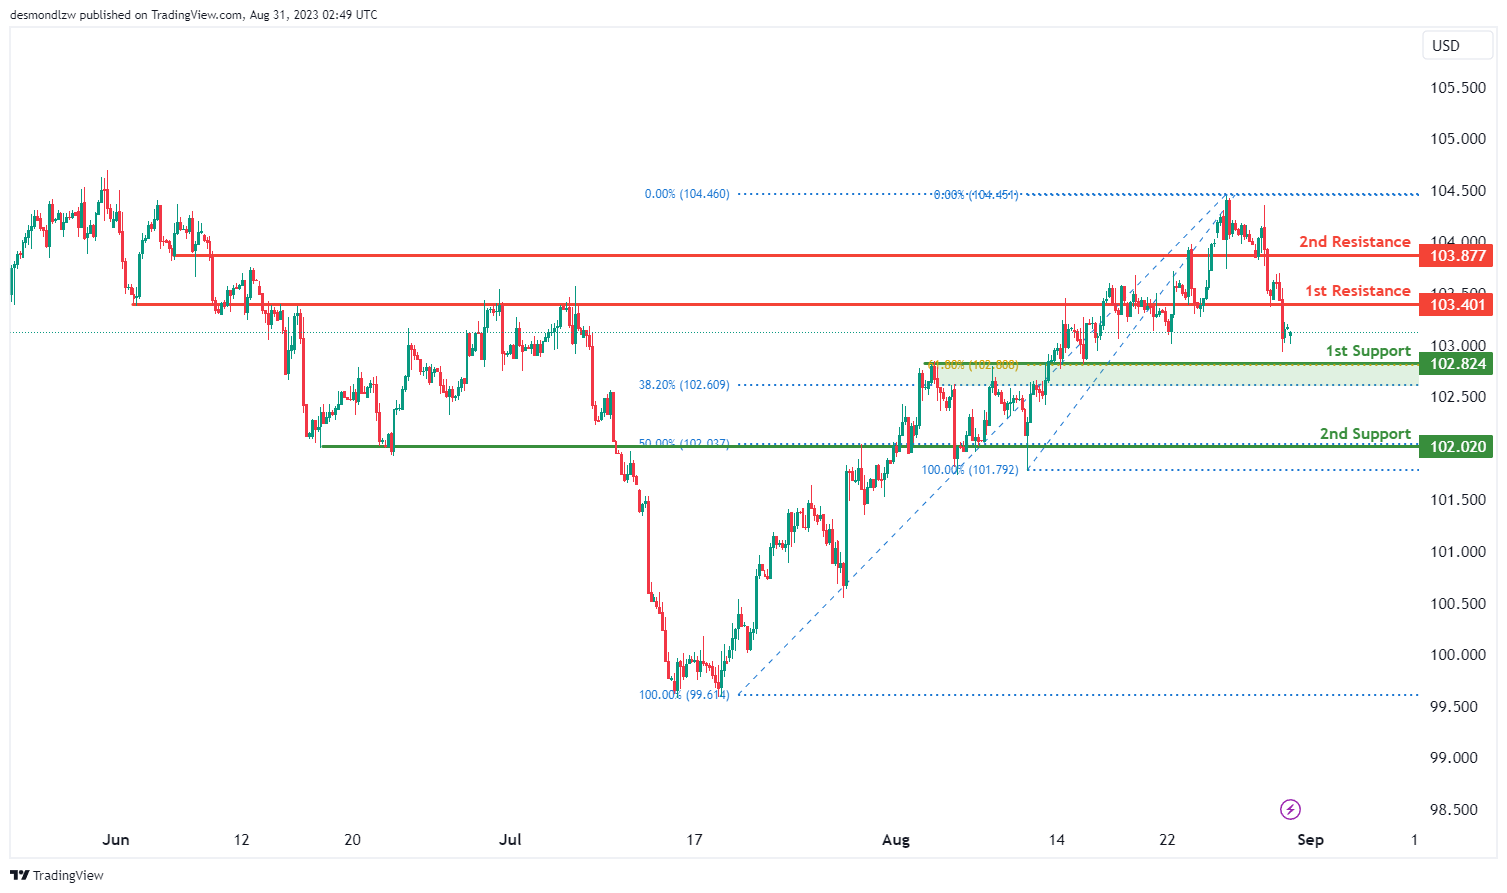
The current state of the DXY chart indicates a bullish momentum overall. There is a potential scenario where the price could experience a bullish rebound from the 1st support level and subsequently move towards the 1st resistance level. The 1st support level at 102.82 holds significance due to being an overlap support, further reinforced by the presence of Fibonacci confluence involving the 38.20% and 61.80% Fibonacci Retracement levels. Similarly, the 2nd support level at 102.02 is also an overlap support, marked at the 50% Fibonacci level.
On the upside, the 1st resistance at 103.40 is categorized as a pullback resistance, while the 2nd resistance at 103.87 is another pullback resistance. These levels suggest potential areas where the price might encounter resistance during upward movement.
EUR/USD:
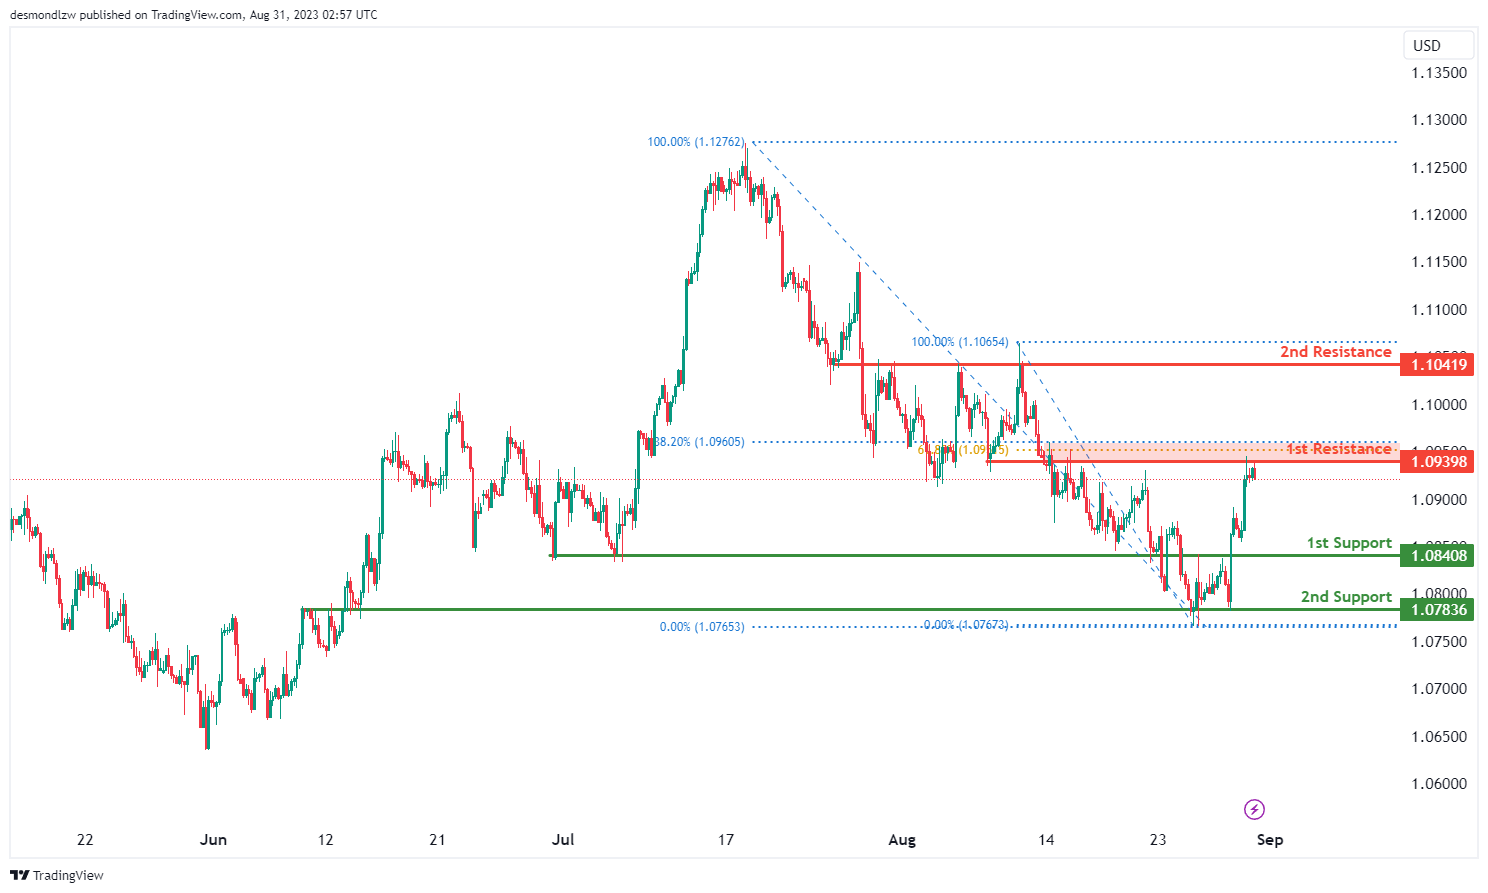
The EUR/USD chart currently exhibits a bearish momentum, suggesting a likely downward movement. One potential scenario to consider is a bearish response coming from the 1st resistance level, leading to a possible drop towards the 1st support level. The 1st support at 1.0840 is notable for providing support during pullbacks, while the 2nd support at 1.0783 is historically a point of support.
Conversely, on the upside, the 1st resistance at 1.0939 acts as a barrier to upward movement and holds added significance due to the presence of both the 61.80% and 38.20% Fibonacci Retracement levels. Similarly, the 2nd resistance at 1.1041 is also a point where price has faced resistance before. These resistance and support levels are key markers to watch for potential price reactions during its course.
EUR/JPY:
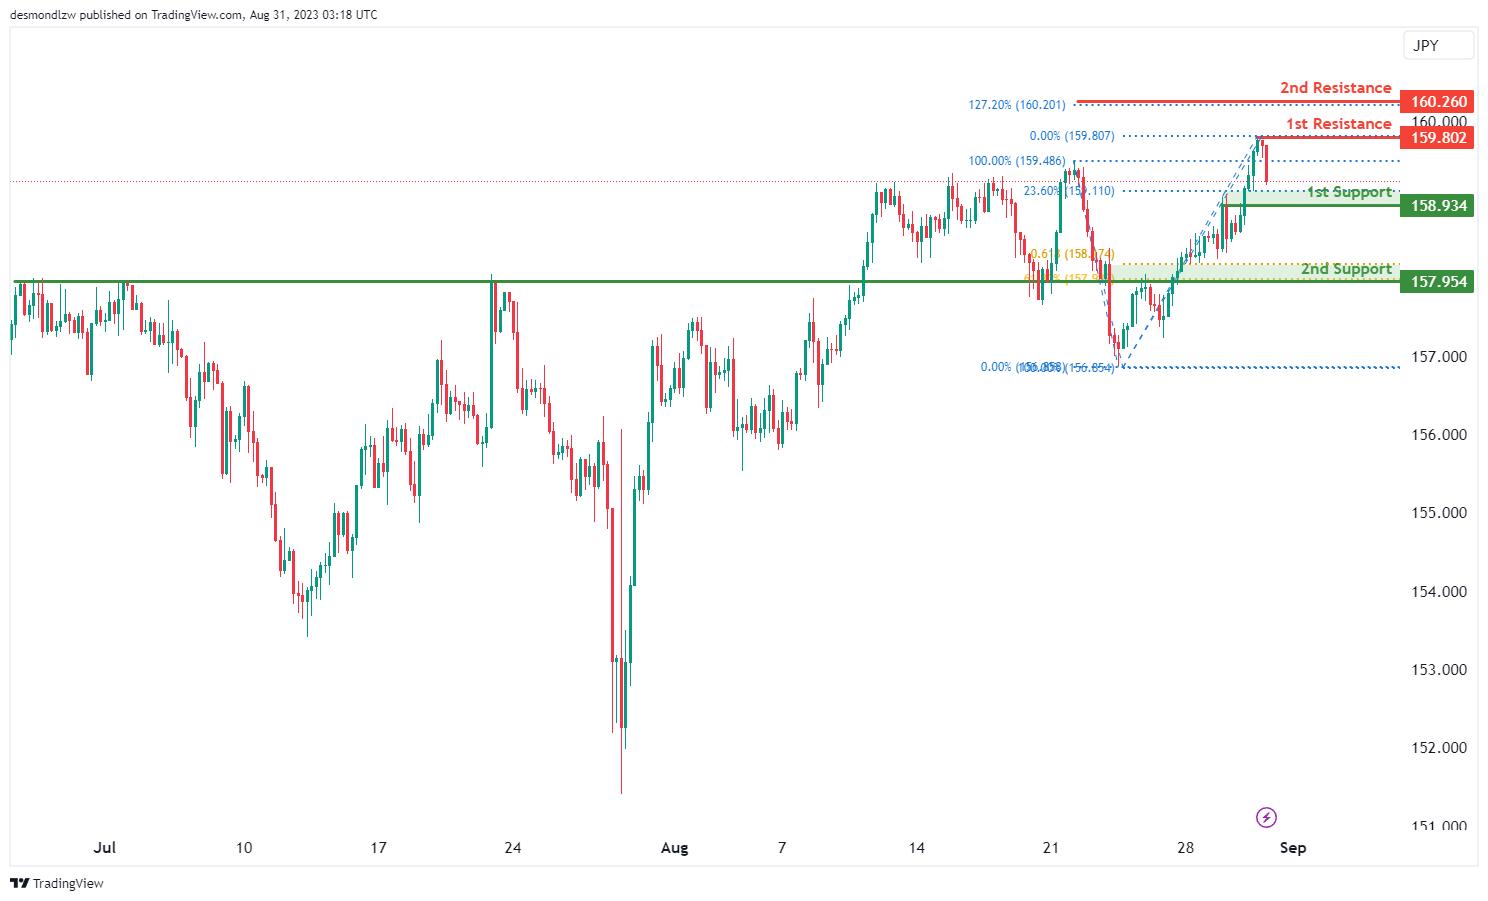
For EUR/JPY, the chart suggests a bullish overall momentum.
The 1st support level at 158.93 is a pullback support and aligns with the 23.60% Fibonacci retracement. This level might attract buying interest as it aligns with a key Fibonacci level.
The 2nd support level at 157.95 is a pullback support and aligns with both the 61.80% Fibonacci retracement and the 61.80% Fibonacci projection. This indicates a potential strong support zone.
The 1st resistance level at 159.80 is a swing high resistance. This level might act as a barrier to further upside movement.
The 2nd resistance level at 160.26 is a 127.20% Fibonacci extension. This level could also potentially act as a resistance point.
EUR/GBP:
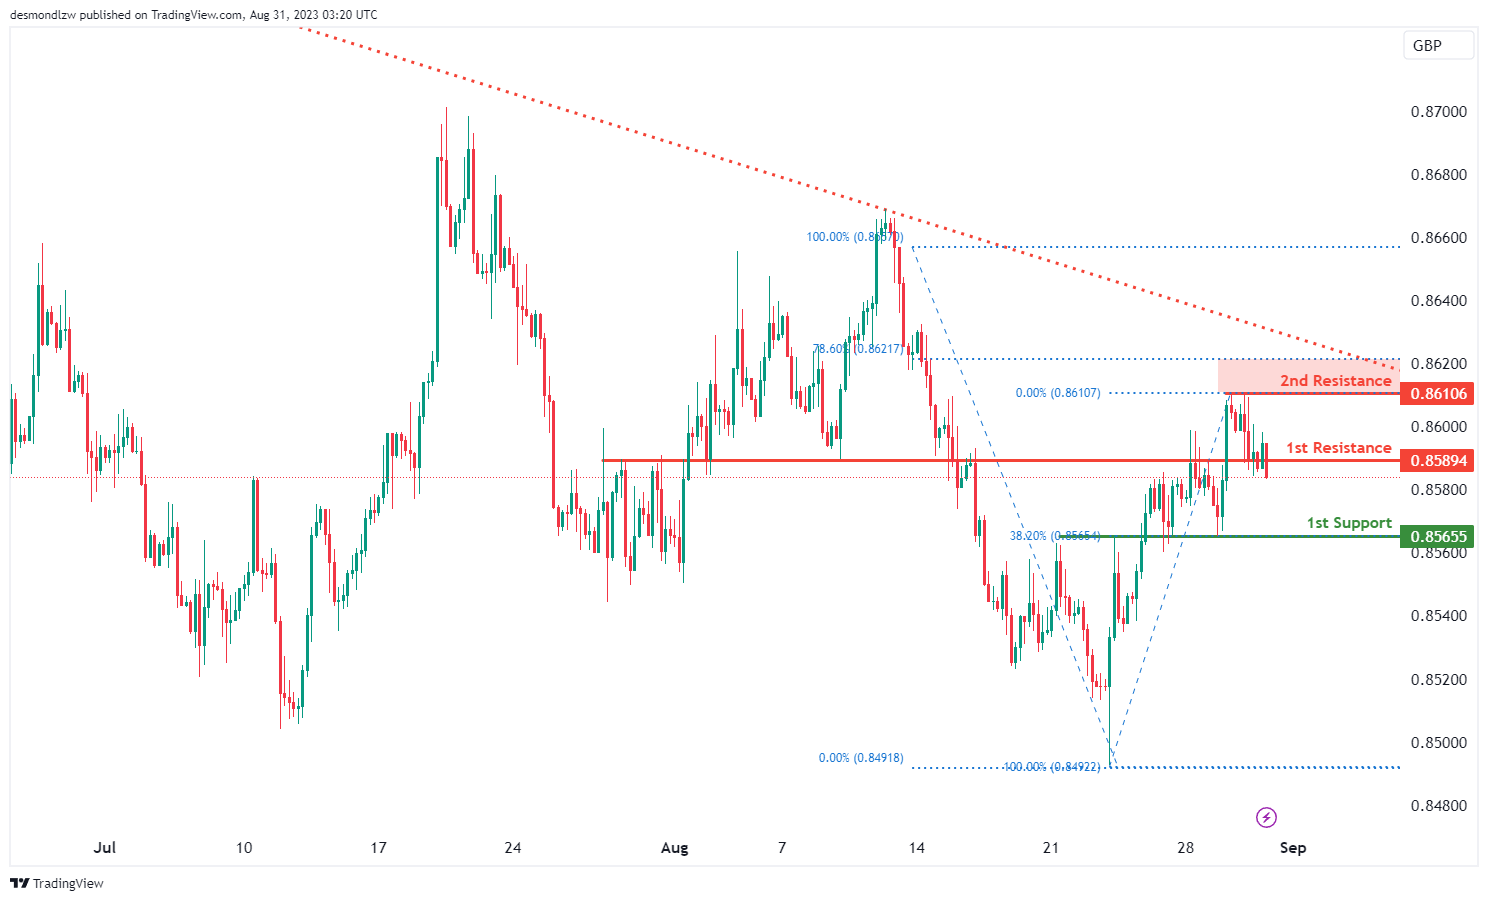
For EUR/GBP, the chart indicates a bearish overall momentum, and there are factors contributing to this bearishness, including being below a major descending trend line.
The 1st support level at 0.8565 is an overlap support and coincides with the 38.20% Fibonacci retracement. This level might provide some potential support for the price, but if the bearish momentum continues, it could be breached.
The 1st resistance level at 0.8589 is a pullback resistance. This level could act as a barrier to any potential upside movements.
The 2nd resistance level at 0.8610 is a swing high resistance and aligns with the 78.60% Fibonacci retracement. This level might serve as a more significant resistance point.
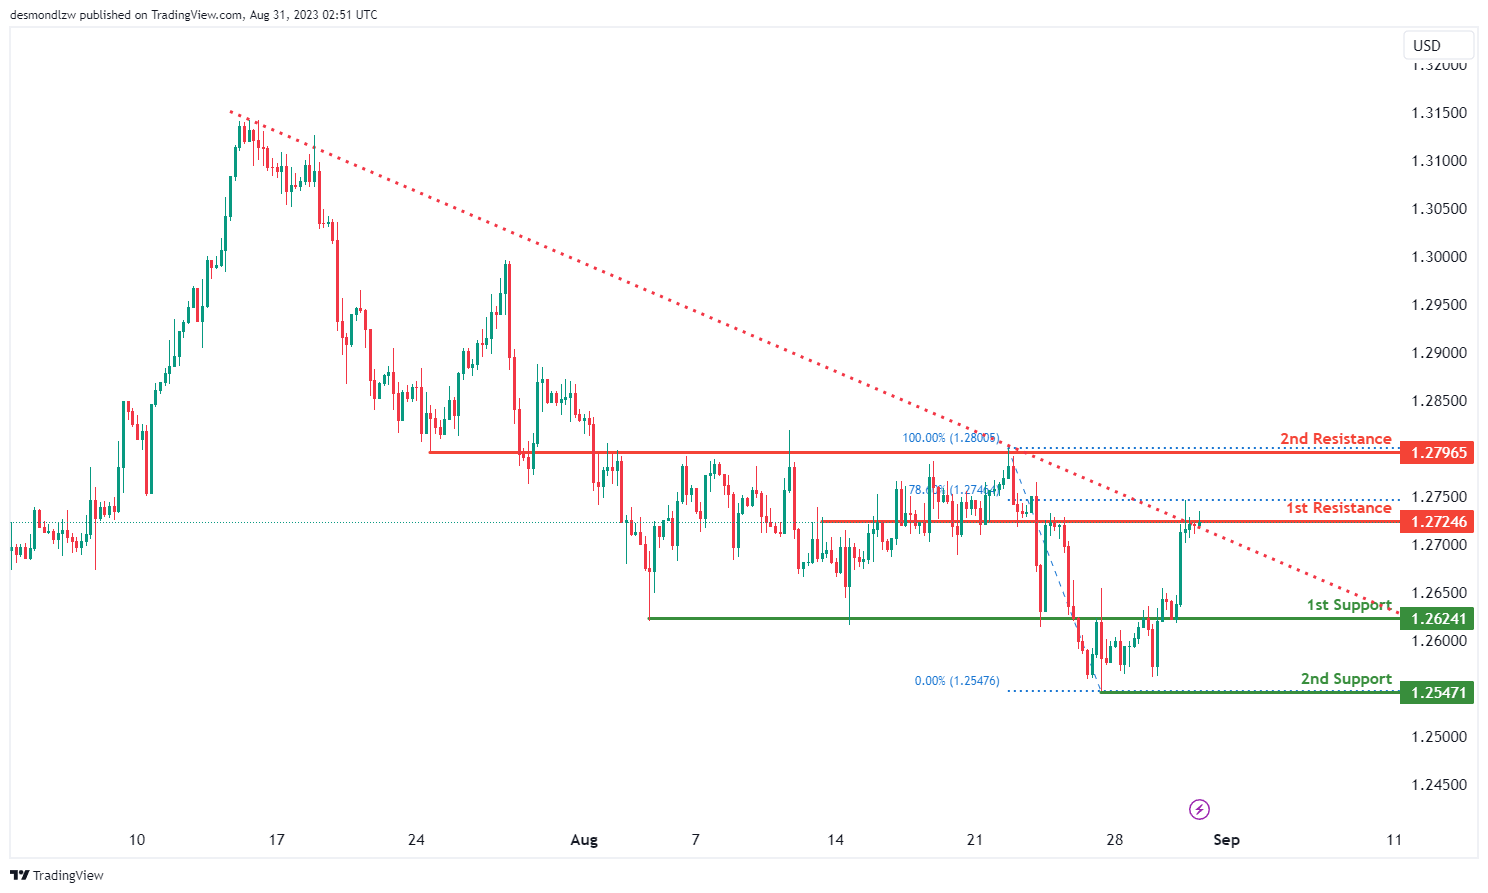
GBP/USD:
The GBP/USD chart is currently displaying bearish overall momentum, indicating a downward trend in the price. Contributing factors include the price positioning below a major descending trend line, suggesting potential bearish movement. A potential scenario envisions a bearish reaction emerging from the 1st resistance level, leading to a potential drop towards the 1st support. The 1st support at 1.2624 is identified as an overlap support, while the 2nd support at 1.2547 historically serves as a swing low support.
On the upside, the 1st resistance at 1.2724 is an overlap resistance, notably aligned with the 78.60% Fibonacci Retracement. Similarly, the 2nd resistance at 1.2796 is also an overlap resistance. These levels represent important junctures where the price could encounter resistance or support, respectively, in its movement.
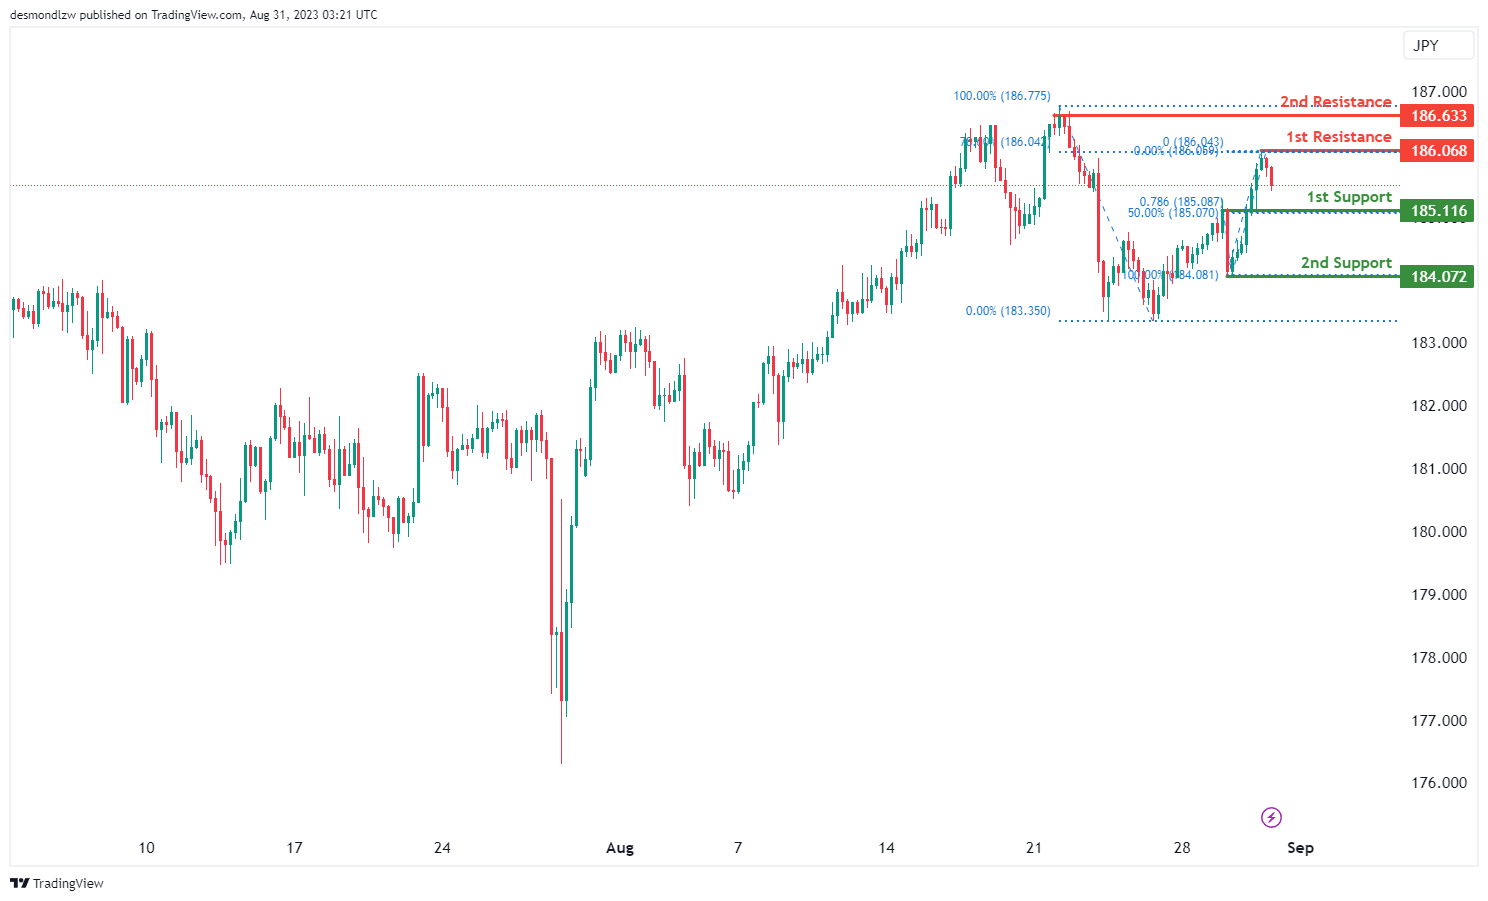
GBP/JPY:
For GBP/JPY, the chart indicates a bullish overall momentum.
The 1st support level at 185.11 is a pullback support and coincides with the 78.60% Fibonacci retracement. This level could potentially act as a bounce point for the price, especially considering the bullish momentum.
The 2nd support level at 184.07 is a swing low support, which could also contribute to providing support to the price if it retraces further.
The 1st resistance level at 186.06 is a swing high resistance and aligns with the 78.60% Fibonacci retracement. This level could present a significant barrier to further upward movement.
The 2nd resistance level at 186.63 is another swing high resistance, which adds to the potential resistance in that area.
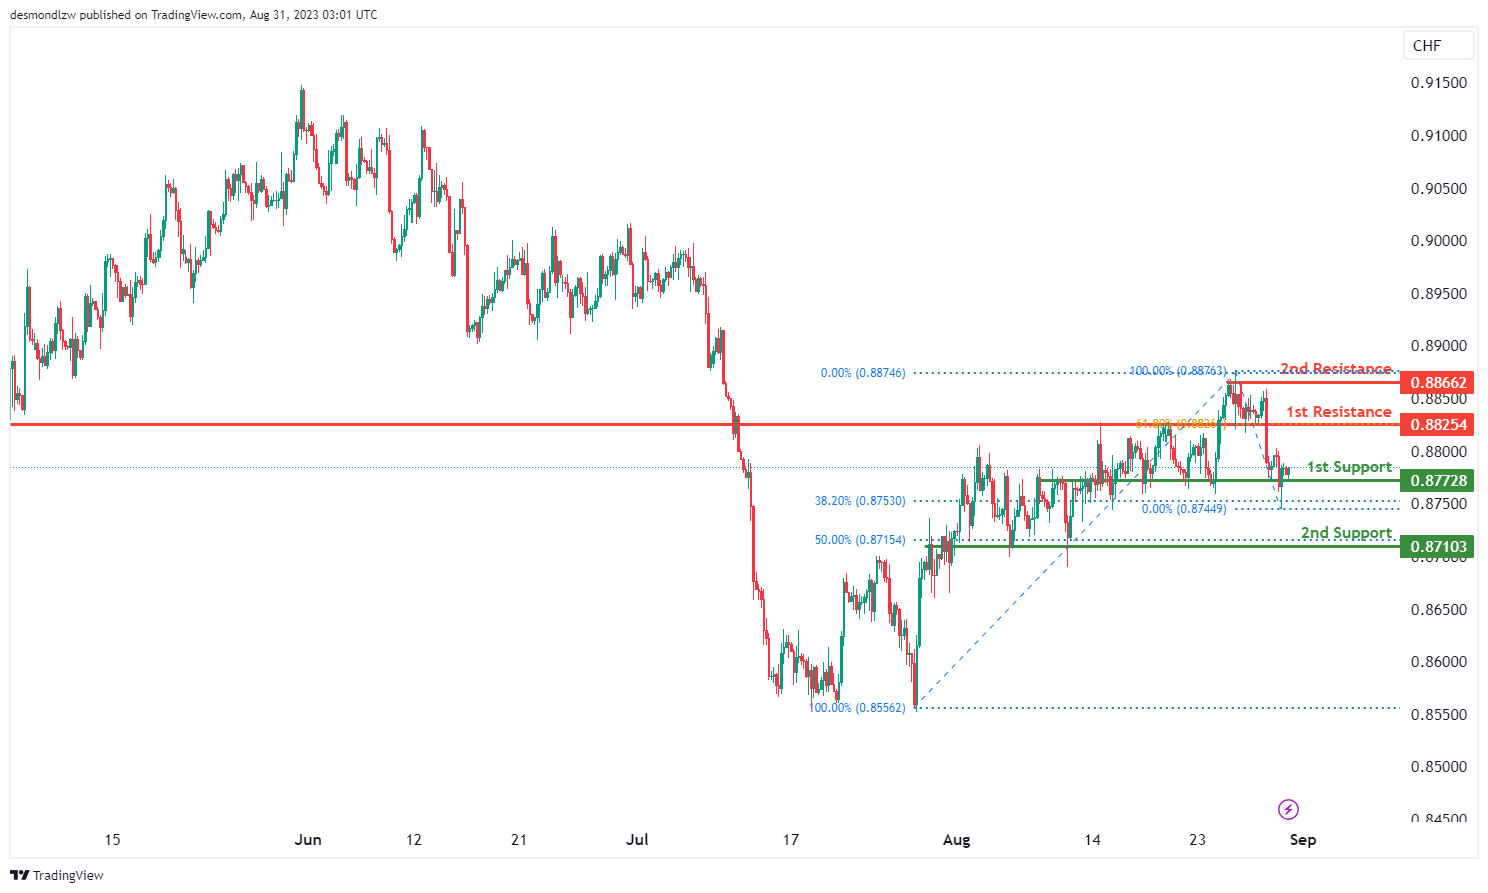
USD/CHF:
The USD/CHF chart is currently exhibiting a bullish overall momentum, There’s a potential scenario where the price could experience a bullish rebound from the 1st support, possibly moving towards the 1st resistance. The 1st support at 0.8772 is an overlap support, while the 2nd support at 0.8710 serves as an overlap support and aligns with the 50% Fibonacci Retracement.
On the upside, the 1st resistance at 0.8825 acts as a pullback resistance, coinciding with the 61.80% Fibonacci Retracement. Additionally, the 2nd resistance at 0.8866 represents a multi-swing high resistance. These levels hold significance as points where price could potentially encounter resistance or support during its progression.
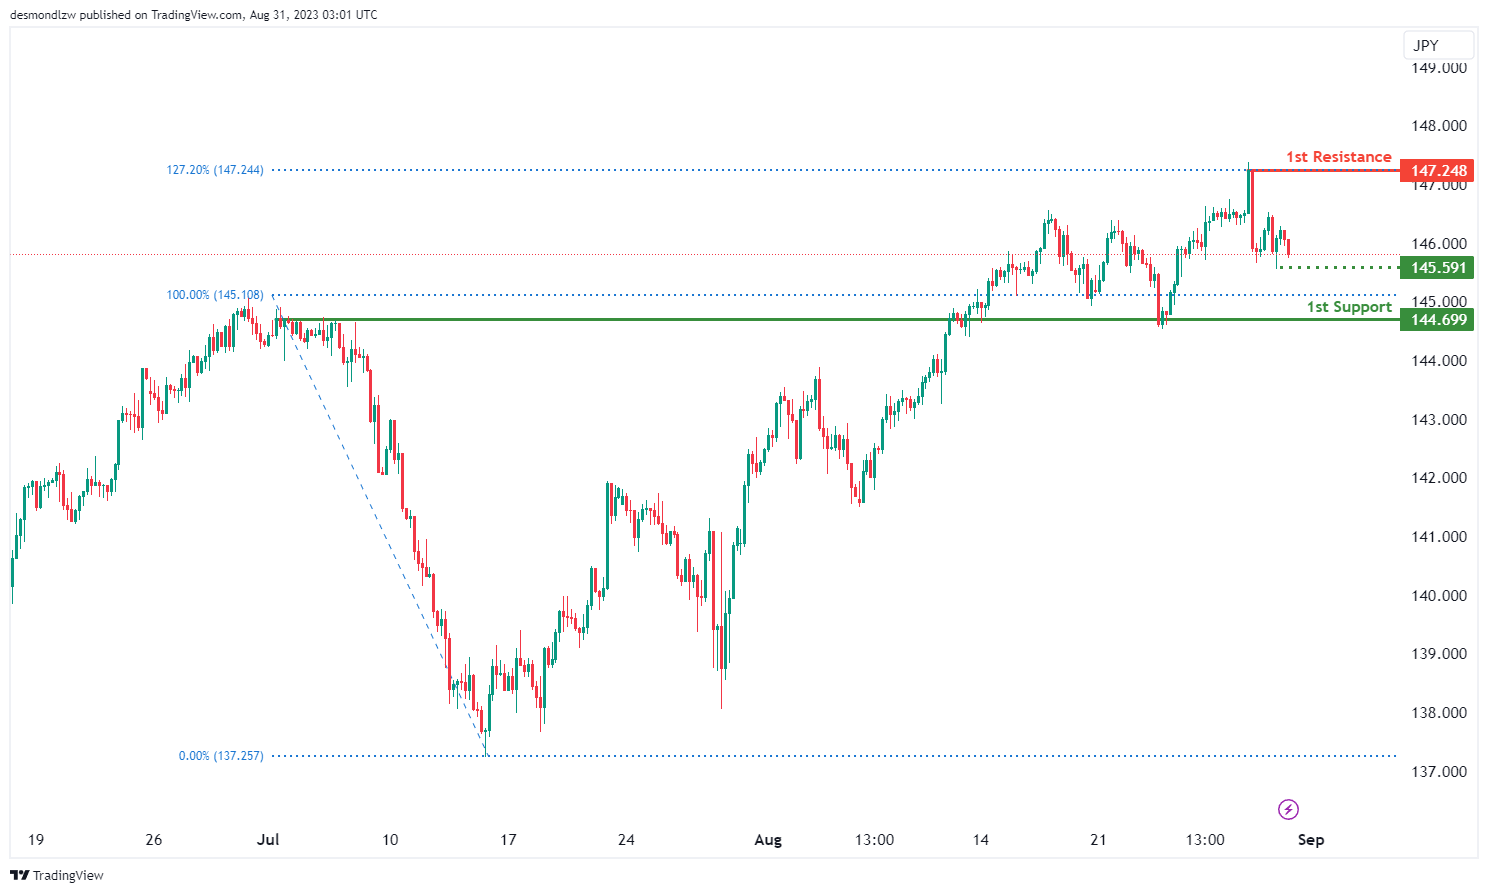
USD/JPY:
The USD/JPY chart is currently demonstrating a nearish overall momentum, suggesting a continued downward trend. This scenario suggests a potential for bearish continuation towards the 1st support level at 144.69, which carries weight as an overlap support. Adding to this perspective, the intermediate support at 145.59 gains importance as it aligns with swing low support.
Conversely, on the upside, the 1st resistance at 147.24 stands as a significant barrier due to its role as a swing high resistance. Notably, this resistance level is reinforced by the presence of the 127.20% Fibonacci Extension, underscoring its potential as a pivotal point for price action. These identified levels, reflecting historical price patterns and Fibonacci extensions, offer valuable insights for traders assessing potential support and resistance zones.
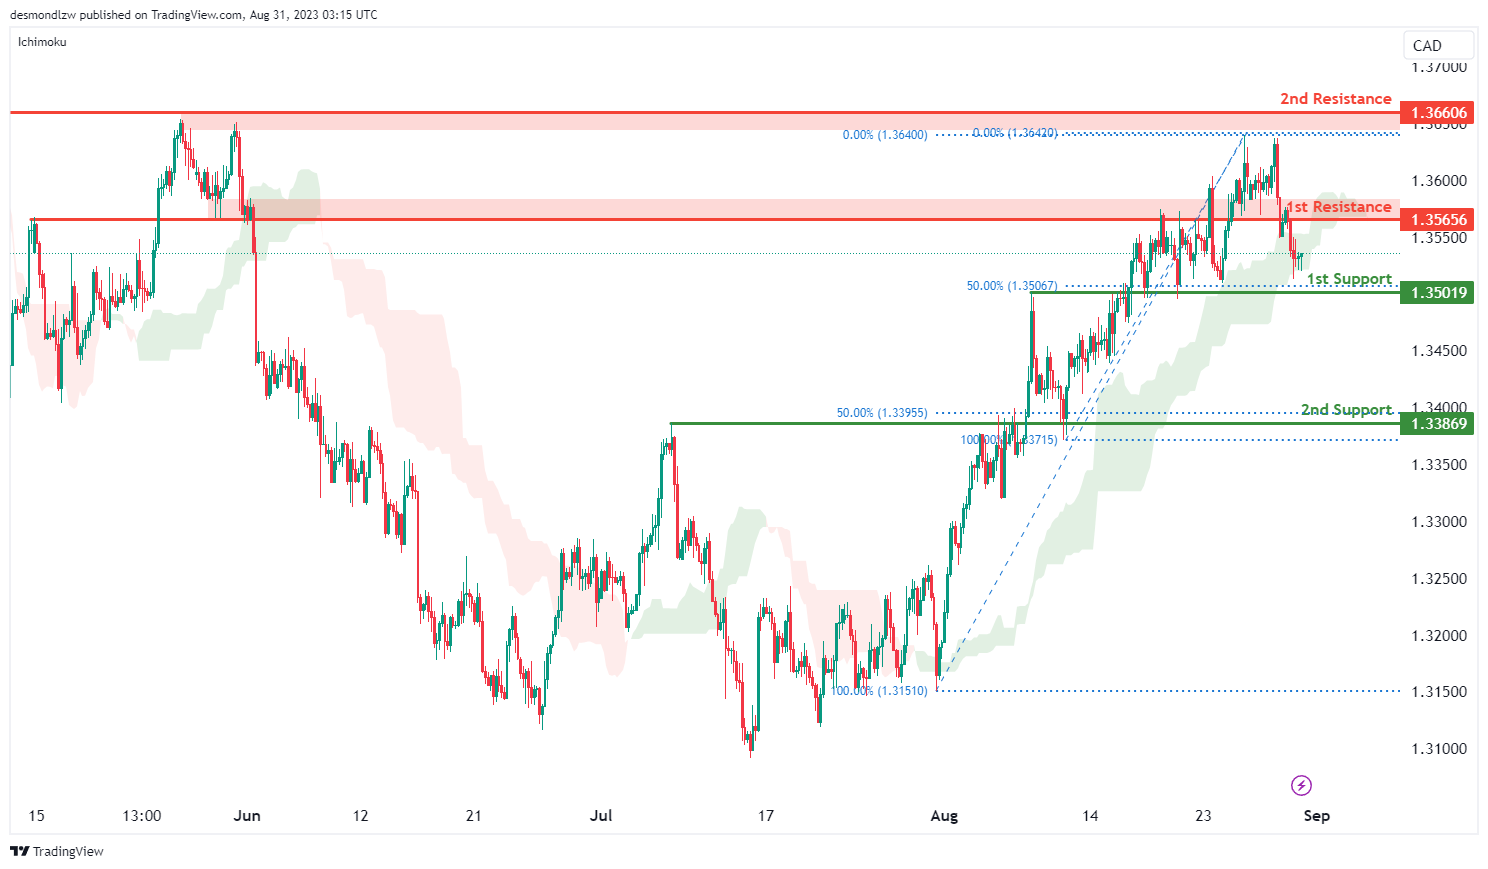
USD/CAD:
The USD/CAD chart is currently exhibiting a weak bullish momentum with low confidence. One supporting factor for the weak bullish movement is that price is currently situated within the bullish Ichimoku cloud, offering potential support for an upward movement towards the 1st resistance level.
The 1st resistance level at 1.3566 is marked as an overlap resistance while the 2nd resistance level at 1.3661 is also identified as an overlap resistance which could act as a potential barrier to further price appreciation.
To the downside, the 1st support level at 1.3502 is identified as an overlap support that aligns with the 50.00% Fibonacci retracement level. Similarly, the 2nd support level at 1.3387 is also identified as an overlap support that aligns with the 50.00% Fibonacci retracement level.
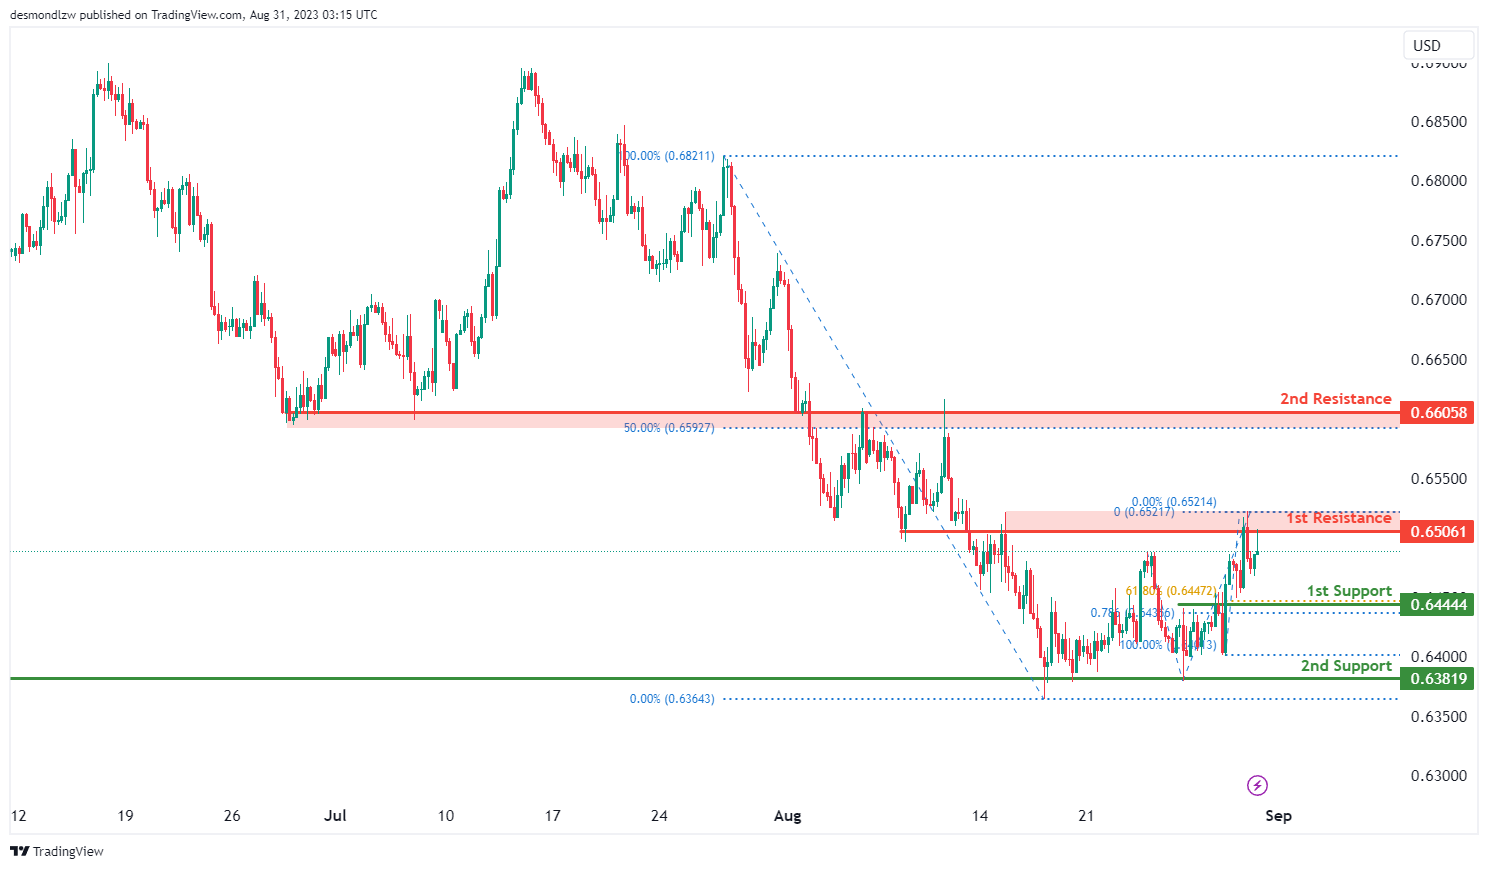
AUD/USD:
The AUD/USD chart is currently demonstrating a bearish overall momentum, indicating a potential for price to react bearishly off the 1st resistance level and subsequently decline towards the 1st support level.
The 1st resistance level at 0.6506 is identified as an overlap resistance while the 2nd resistance at 0.6606 is also marked as an overlap resistance that aligns with the 50.00% Fibonacci retracement level, acting as a potential significant barrier to further upward movement.
The 1st support level at 0.6444 is marked as an overlap support that aligns with a confluence Fibonacci levels i.e. the 61.80% retracement and the 78.60% projection levels. Furthermore, the 2nd support at 0.6382 is identified as a pullback support.
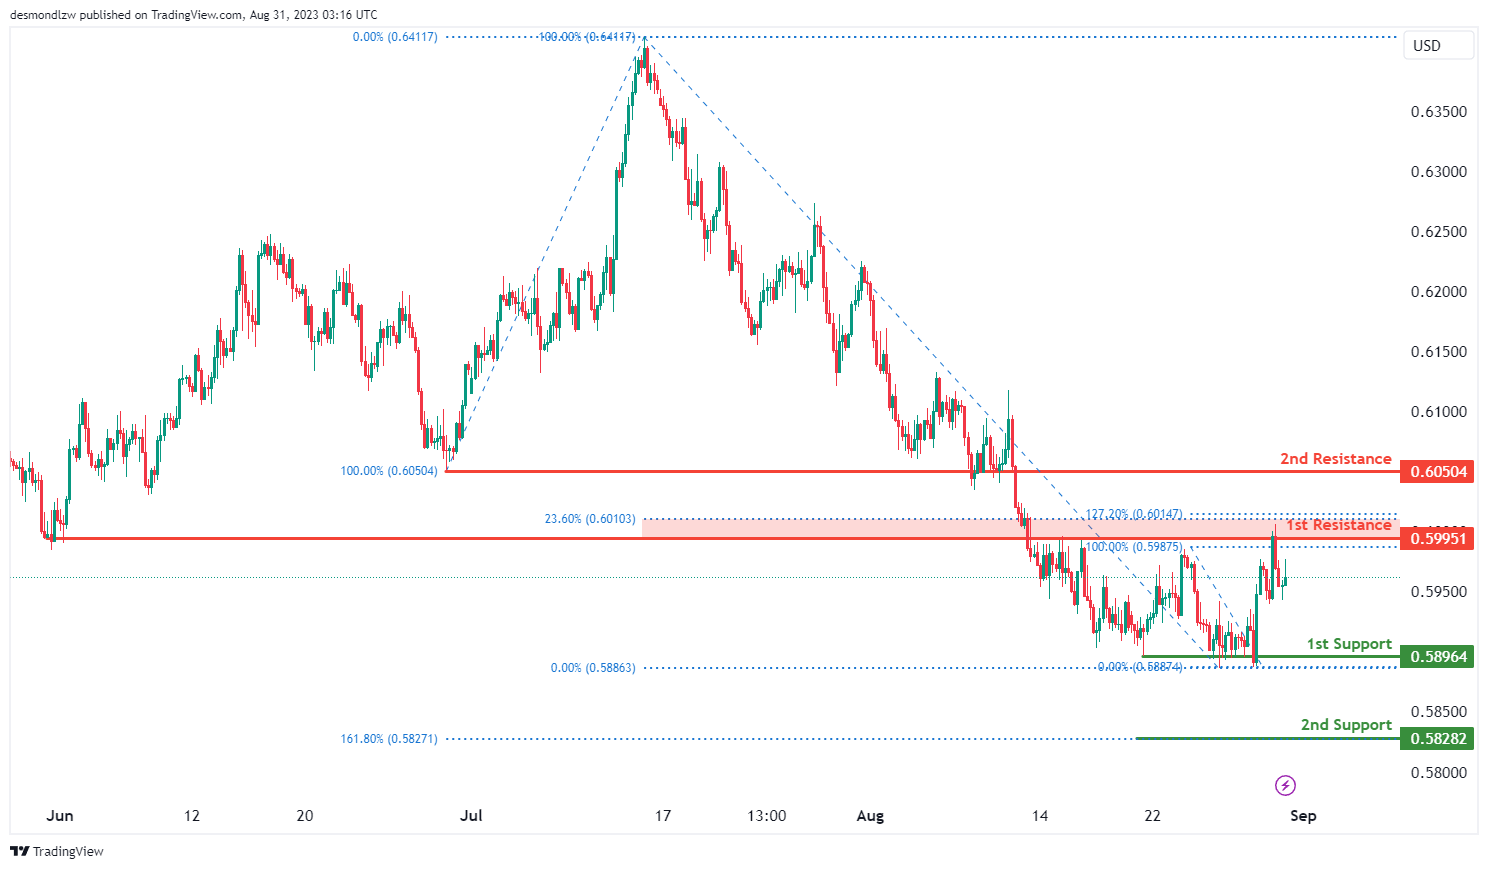
NZD/USD
The NZD/USD chart is currently exhibiting a bearish overall momentum, indicating a possibility that price could react bearishly off the 1st resistance level and subsequently decline towards the 1st support level.
The 1st resistance level of 0.5995 is identified as an overlap resistance that aligns with a confluence of Fibonacci levels i.e. the 23.60% retracement and the 127.20% extension levels. Furthermore, the 2nd resistance level at 0.6050 is also identified as an overlap resistance.
The 1st support level at 0.5896 is identified as a multi-swing low support while the 2nd support level at 0.5828 is identified as a pullback support that aligns with the 161.80% Fibonacci extension level.
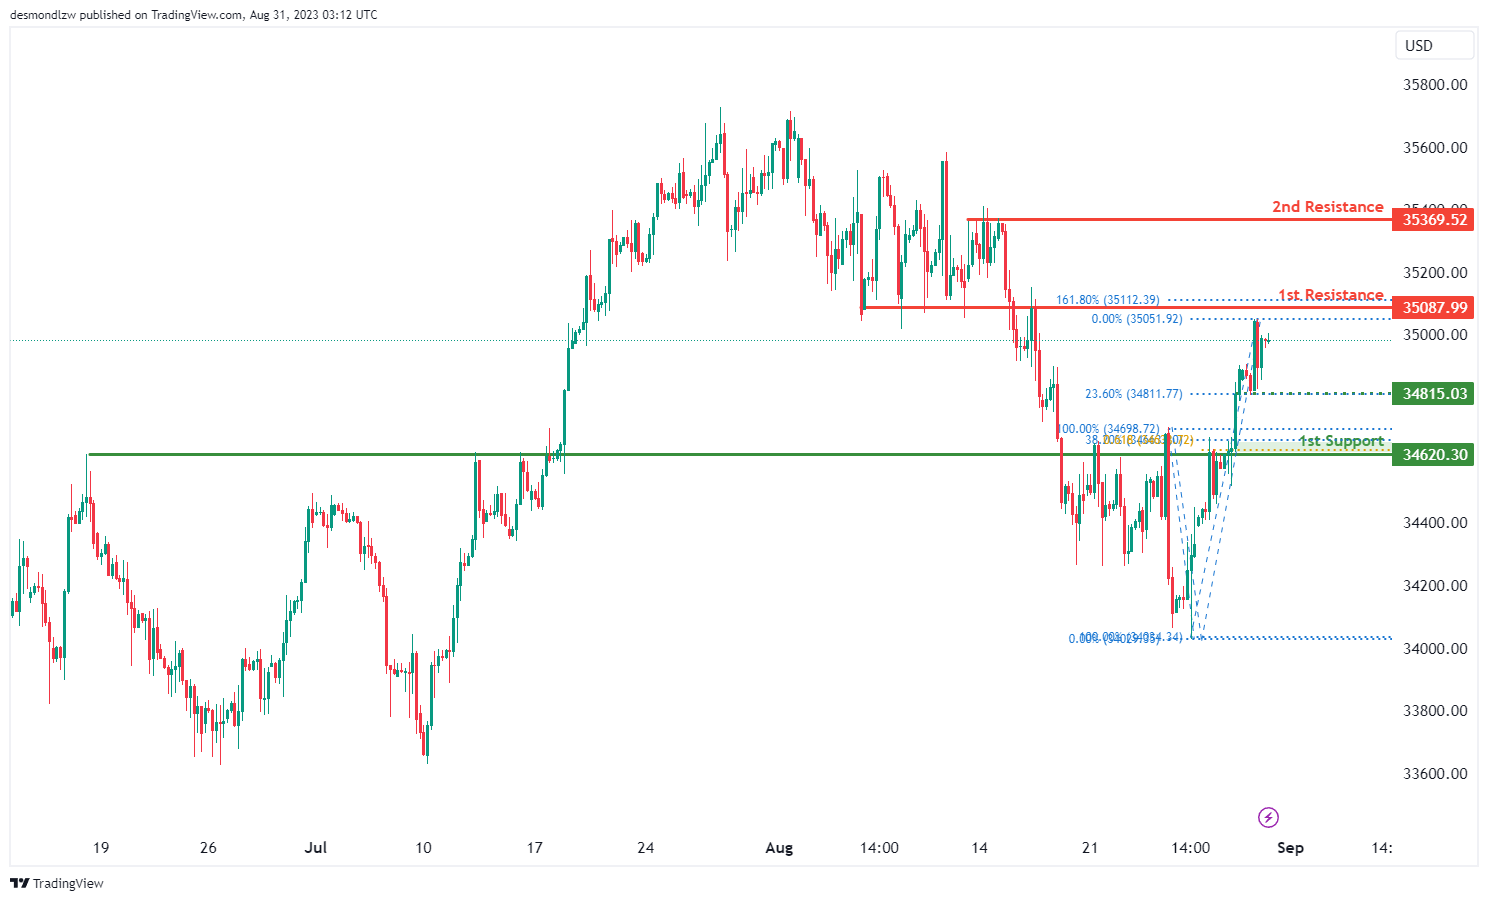
DJ30:
For DJ30, the chart indicates a bearish overall momentum.
The 1st support level at 34620.30 is an overlap support, suggesting that there might be historical price activity around this level that could act as support.
The 1st resistance level at 35087.90 is also an overlap resistance. This level aligns with the 161.80% Fibonacci extension, which indicates a potential resistance point that could lead to a reversal.
The 2nd resistance level at 35369.50 is a multi-swing high resistance. This level might present a stronger barrier to upward movement due to its historical significance.
The intermediate support level at 34815.00 is an overlap support and is further reinforced by the presence of the 23.60% Fibonacci retracement.
GER30:
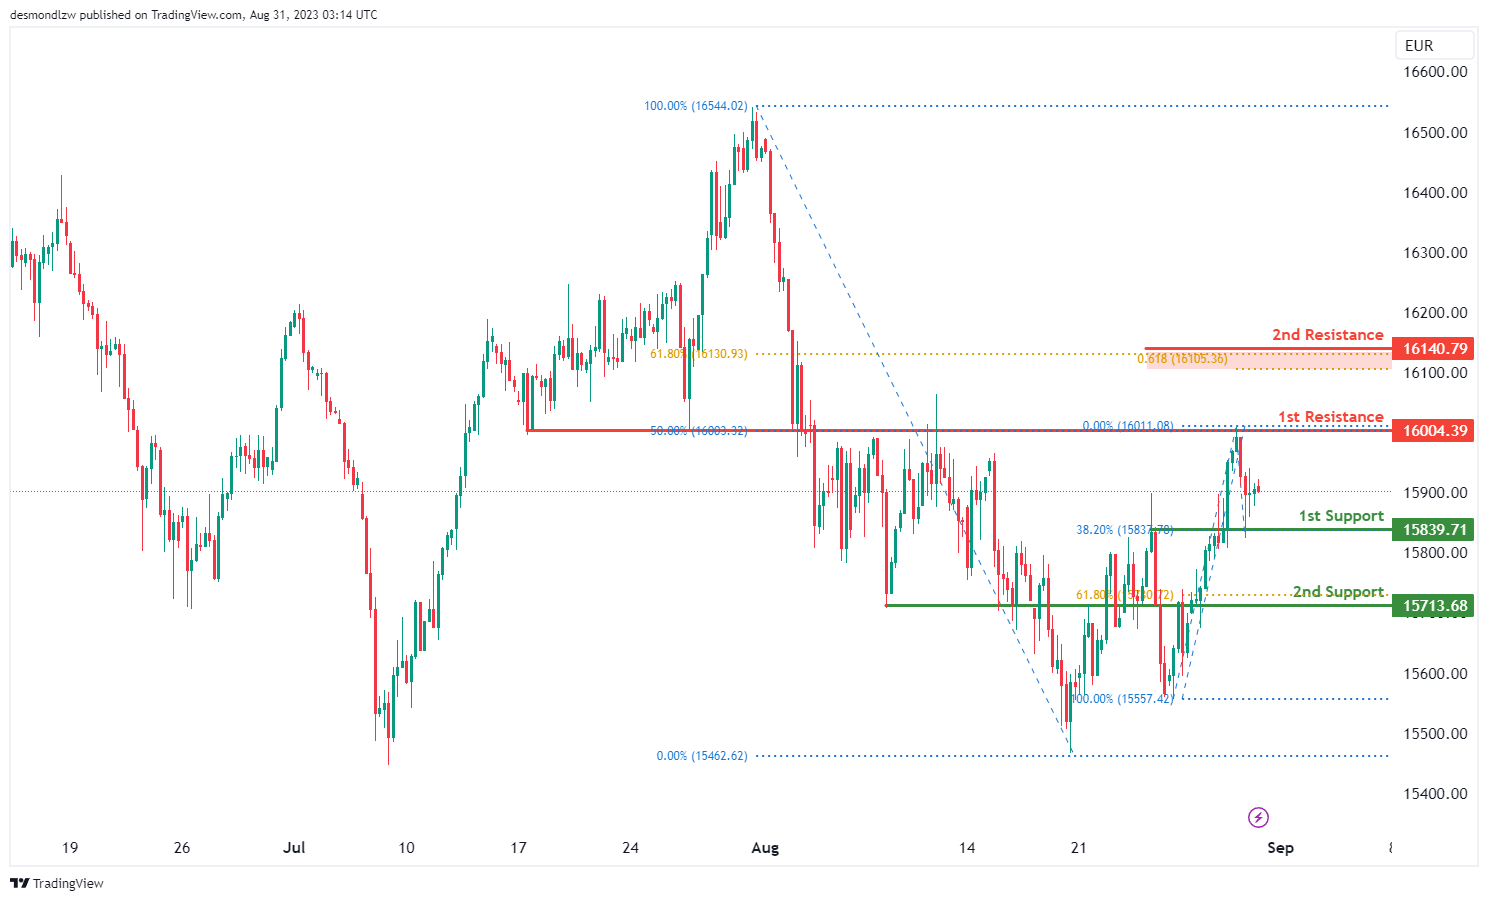
For GER30, the chart indicates a bearish overall momentum.
The 1st support level at 15839.70 is an overlap support and aligns with the 38.20% Fibonacci retracement level. This level might provide some buying interest due to historical price activity and the Fibonacci confluence.
The 2nd support level at 15713.60 is a pullback support and coincides with the 61.80% Fibonacci retracement. This level could potentially act as a stronger support point.
The 1st resistance level at 16004.30 is an overlap resistance and also aligns with the 50% Fibonacci retracement. This level might pose a resistance barrier that could lead to a reversal.
The 2nd resistance level at 16140.70 presents a Fibonacci confluence, with both the 61.80% Fibonacci retracement and the 61.80% Fibonacci projection indicating potential resistance.
US500
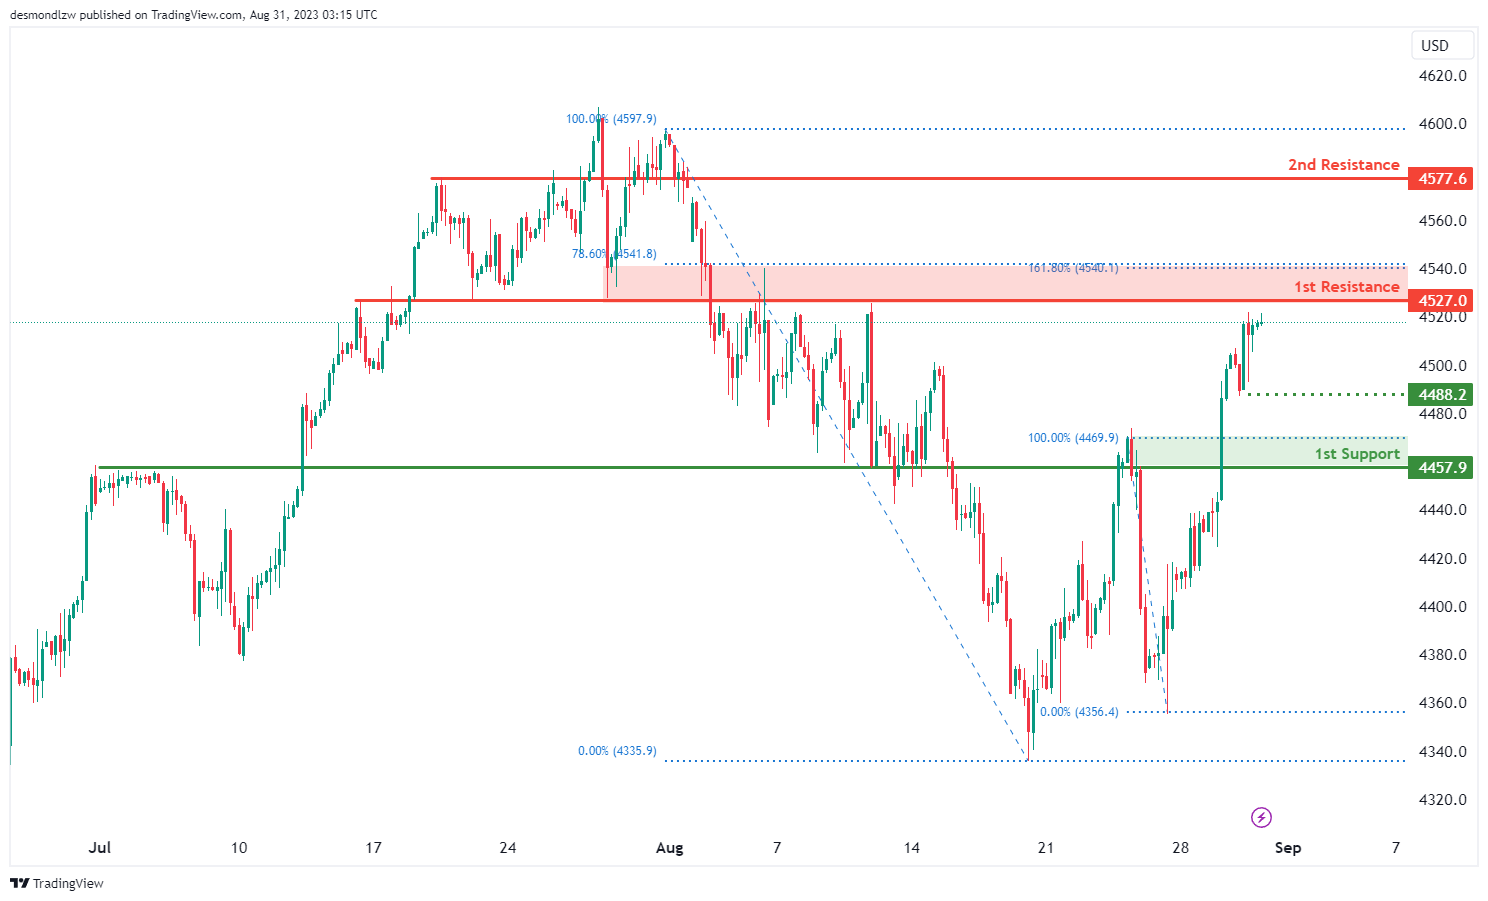
For US500, the chart suggests a bearish overall momentum.
The 1st support level at 4457.9 is a pullback support. This level might offer buying interest as it aligns with the pullback support.
The 1st resistance level at 4527.0 is an overlap resistance and aligns with both the 78.60% Fibonacci retracement and the 161.80% Fibonacci extension. This indicates a potential strong resistance zone.
The 2nd resistance level at 4577.6 is a pullback resistance. This level might also act as a resistance barrier.
BTC/USD:
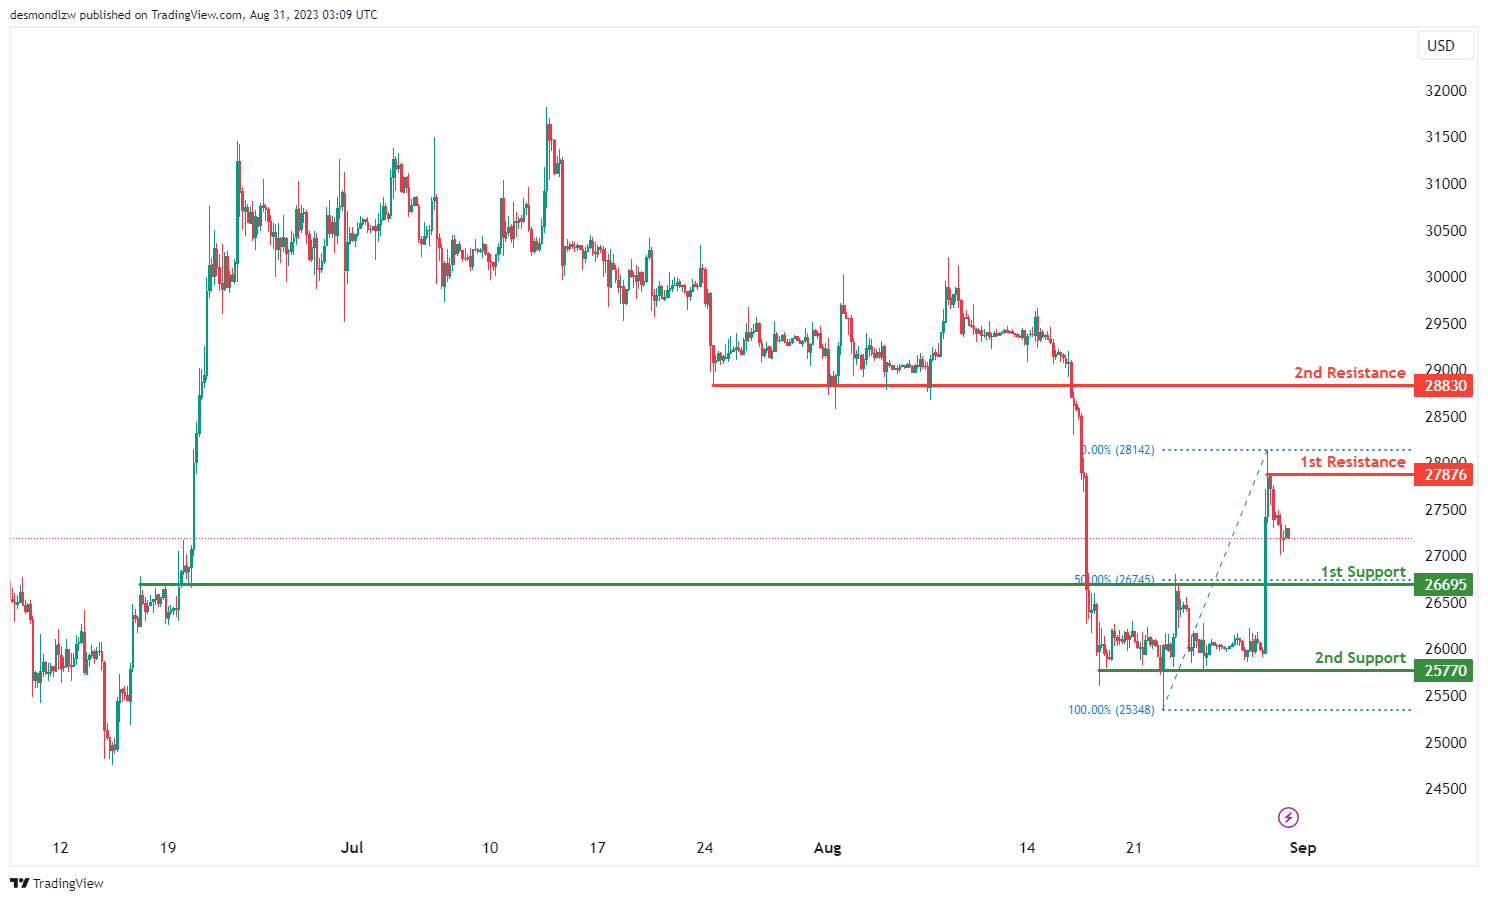
The BTC/USD chart indicates a bearish overall momentum.
The 1st support level at 26695 is an important level due to its characteristics as an overlap support and coincides with the 50% Fibonacci retracement level.
The 2nd support level at 25770 holds significance as a multi-swing low support.
On the resistance side, the 1st resistance level at 27876 is considered a swing high resistance.
The 2nd resistance level at 28830 gains importance as a pullback resistance.
ETH/USD:
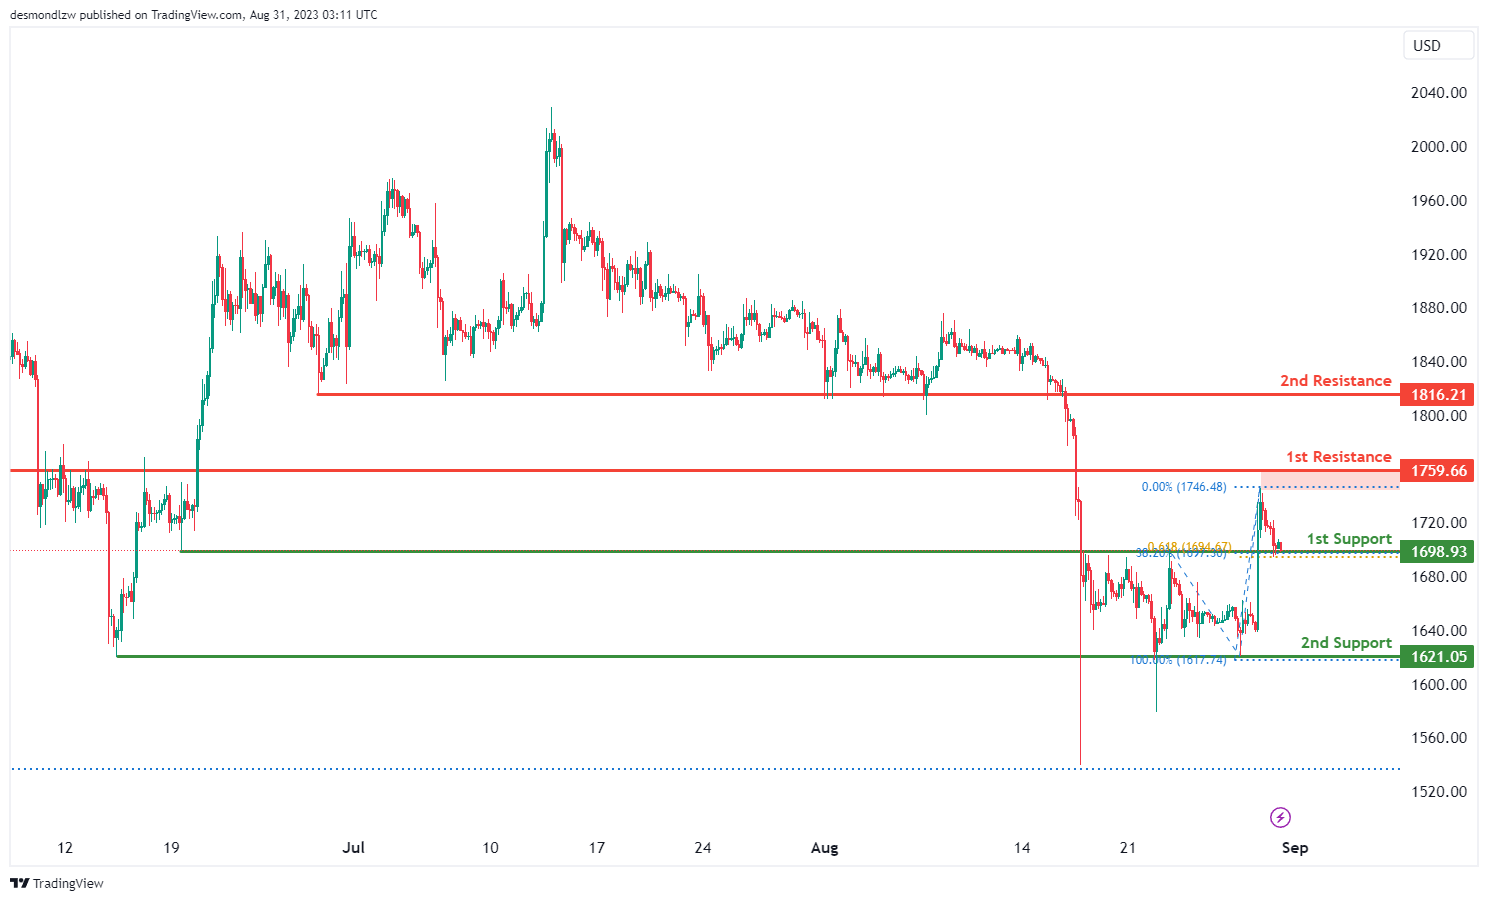
For ETH/USD, the chart indicates a bullish overall momentum.
The 1st support level at 1698.90 is an overlap support and aligns with both the 38.20% Fibonacci retracement and the 61.80% Fibonacci projection. This confluence of Fibonacci levels makes it a potentially strong support area.
The 2nd support level at 1621.00 is a multi-swing low support, which could provide additional reinforcement to its potential as a support zone.
On the resistance side, the 1st resistance level at 1759.60 is an overlap resistance. This level could present a potential barrier to further bullish movement.
The 2nd resistance level at 1816.20 is a pullback resistance. This level might act as a psychological resistance point as it is the higher end of the projected bullish movement.
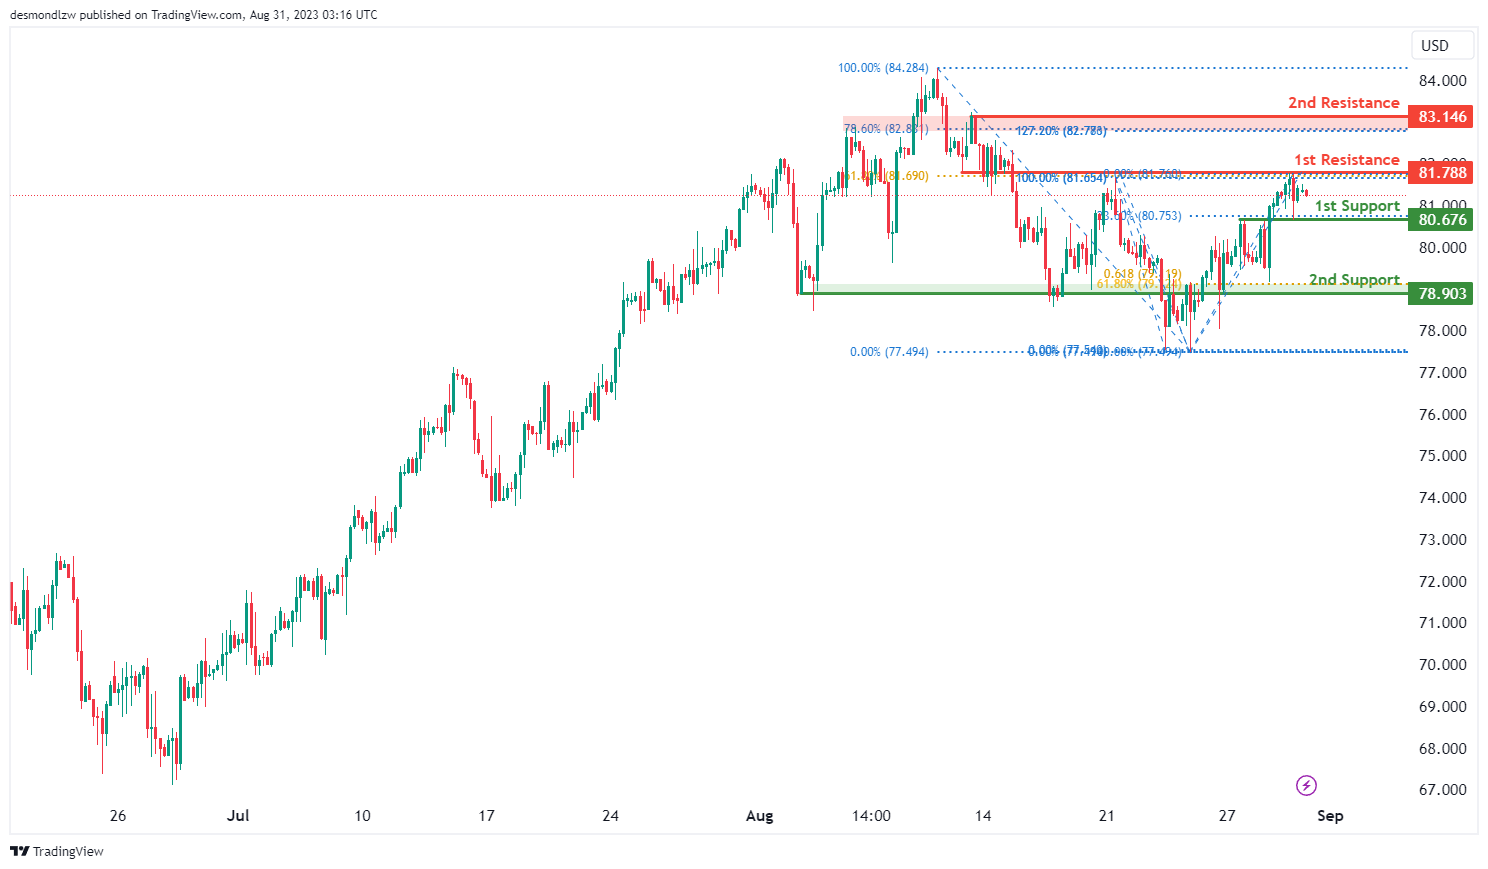
WTI/USD:
The WTI chart is currently displaying a bearish overall momentum, indicating a downward trend in the price movement. In this scenario, there is a possibility that price could continue its bearish movement towards the 1st support level.
The 1st support level at 80.68 is identified as a pullback support that aligns with the 23.60% Fibonacci retracement level. In addition, the 2nd support level at 78.90 is identified as an overlap support that aligns with a confluence of Fibonacci levels i.e. the 61.80% retracement and the 61.80% projection levels, potentially acting as a stronger support zone.
To the upside, the 1st resistance level at 81.79 is identified as an overlap resistance that aligns with the 61.80% Fibonacci retracement level. Furthermore, the 2nd resistance at 83.15 is identified as a pullback resistance that aligns with a confluence of Fibonacci levels i.e. the 78.60% retracement and the 127.20% extension levels, reinforcing the potential significance of this resistance zone.
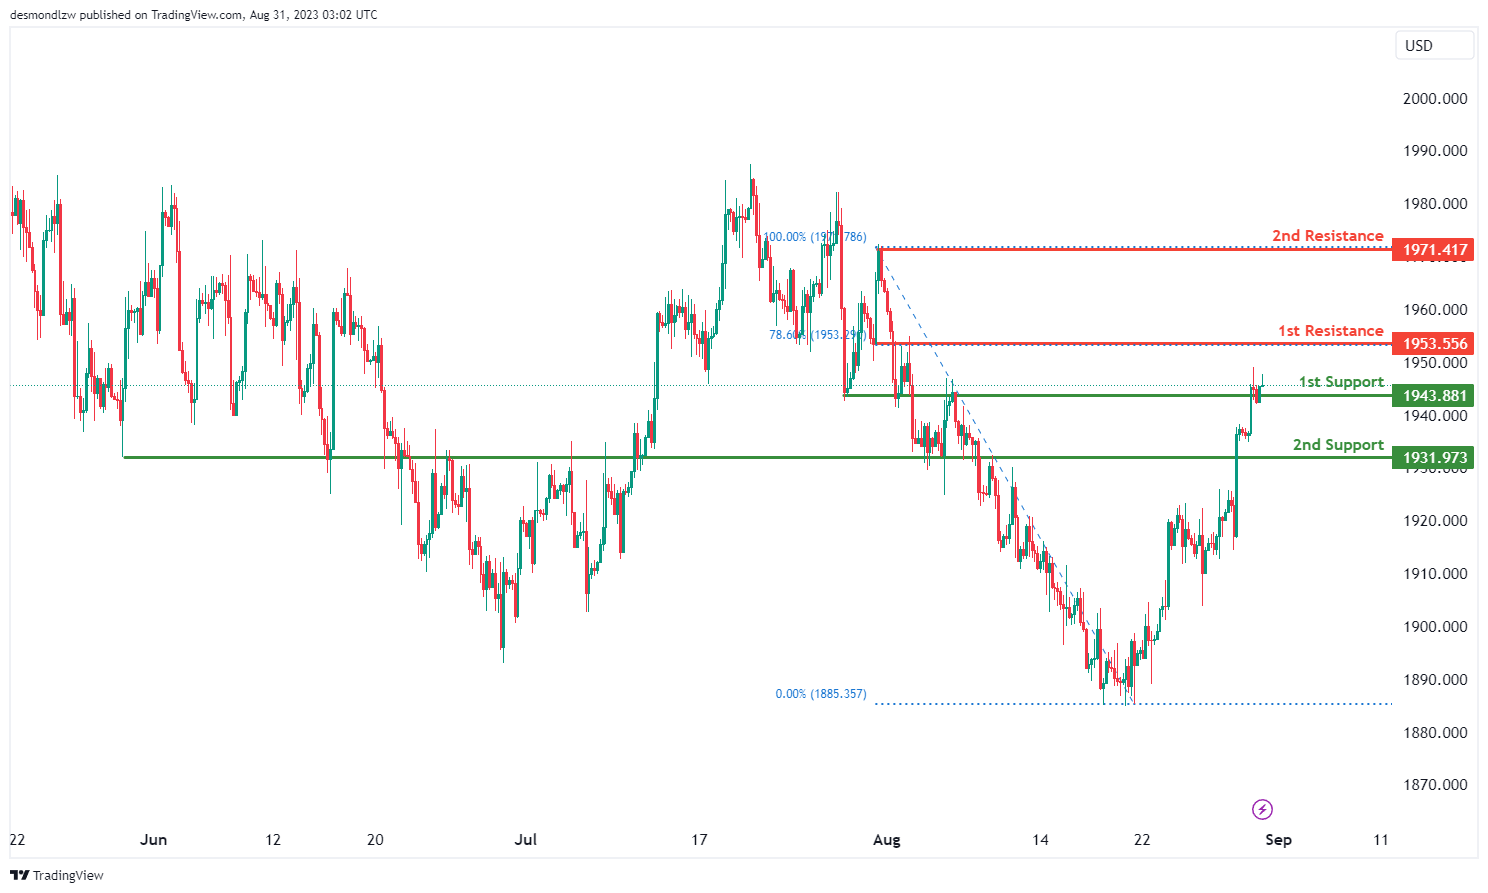
XAU/USD (GOLD):
The XAU/USD chart is currently exhibiting a bullish overall momentum, signaling an upward trend. A plausible scenario entails potential bullish continuation towards the 1st resistance level at 1953.55. The 1st support at 1943.88 holds significance as an overlap support, while the 2nd support at 1931.97 gains importance as a pullback support.
On the upper end, the 1st resistance at 1953.55 serves as an overlap resistance, further reinforced by the presence of the 78.60% Fibonacci Retracement. Additionally, the 2nd resistance at 1971.41 represents a notable swing high resistance. These delineated levels, shaped by historical patterns and Fibonacci retracement, offer key insights into potential support and resistance areas for informed trading decisions.


