
DXY:
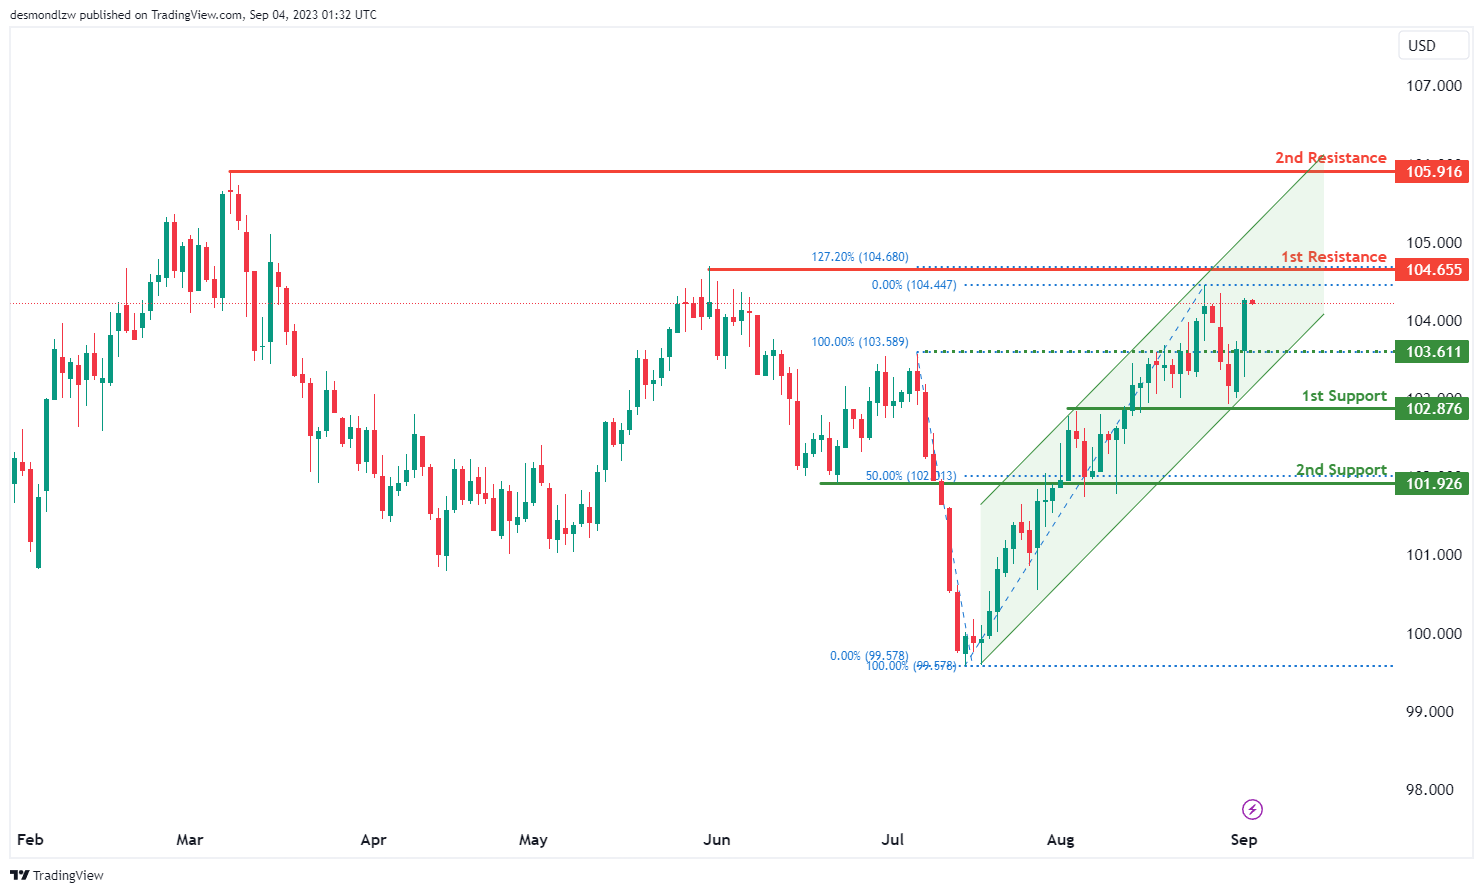
The DXY chart is currently showing a bullish overall momentum, suggesting an upward trend in the price movement. This bullish sentiment is reinforced by the fact that the price is within a bullish ascending channel, indicating a potential continuation of the upward trajectory.
The 1st support level at 102.87 is identified as an overlap support, indicating that historical price action has found support around this level. It serves as a foundation for potential upward movements.
The 2nd support level at 101.92 is also marked as an overlap support and aligns with the 50% Fibonacci Retracement level. This confluence of support factors adds to its significance, potentially strengthening its role as a support zone.
On the resistance side, the 1st resistance level at 104.65 is noted as a swing high resistance, suggesting that historical price action has faced resistance at this level in the past. Traders often pay close attention to these levels for potential reversal or continuation patterns.
The 2nd resistance level at 105.91 is also identified as a swing high resistance, further confirming its potential significance as a barrier for upward price movement.
Additionally, an intermediate support level at 103.61 is recognized as a pullback support, indicating a level where the price could potentially find support during a pullback.
EUR/USD:
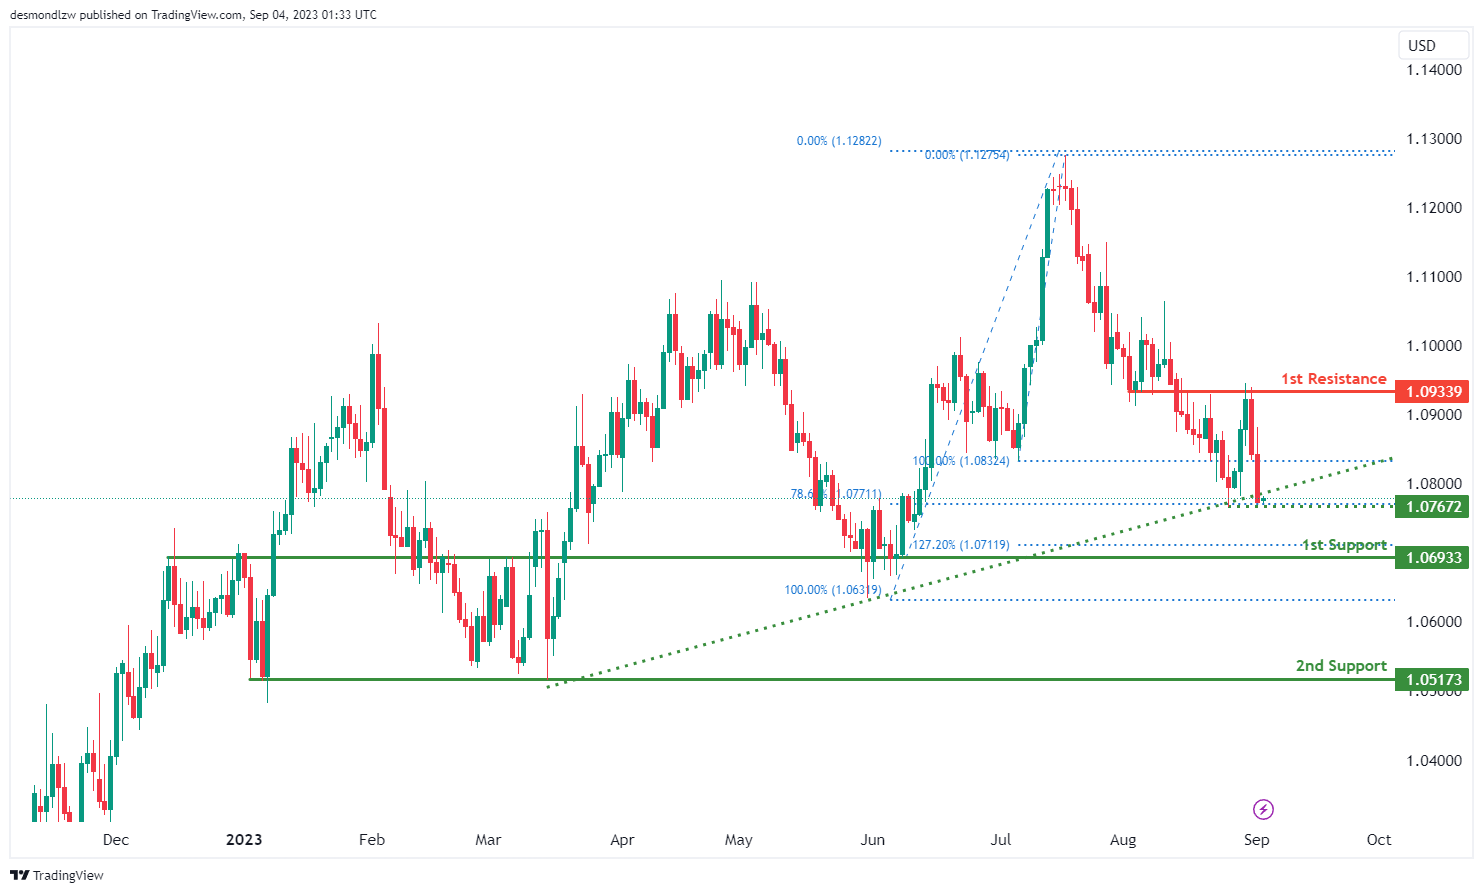
The EUR/USD chart is currently demonstrating a bullish overall momentum, implying an upward trend in price movement. This bullish sentiment is bolstered by the fact that the price is positioned above a major ascending trend line, indicating the potential for further bullish momentum ahead.
In the short term, there’s potential for the price to drop further before initiating a rebound. The 1st support level at 1.0693 is identified as a pullback support, and it aligns with the 127.20% Fibonacci Extension. This confluence of support factors increases its importance as a potential support zone.
The 2nd support level at 1.0517 is noted as a multi-swing low support, indicating that historical price action has found support around this level. This further solidifies its role as a potential area of support.
In the event of a bounce from the support, the price could rise towards the 1st resistance level at 1.0933. This level is marked as an overlap resistance, suggesting that historical price action has faced resistance in this region before.
Additionally, an intermediate support level at 1.0767 is recognized as a swing low support, and it aligns with the 78.60% Fibonacci Retracement level. This level could potentially provide support during pullbacks.
EUR/JPY:
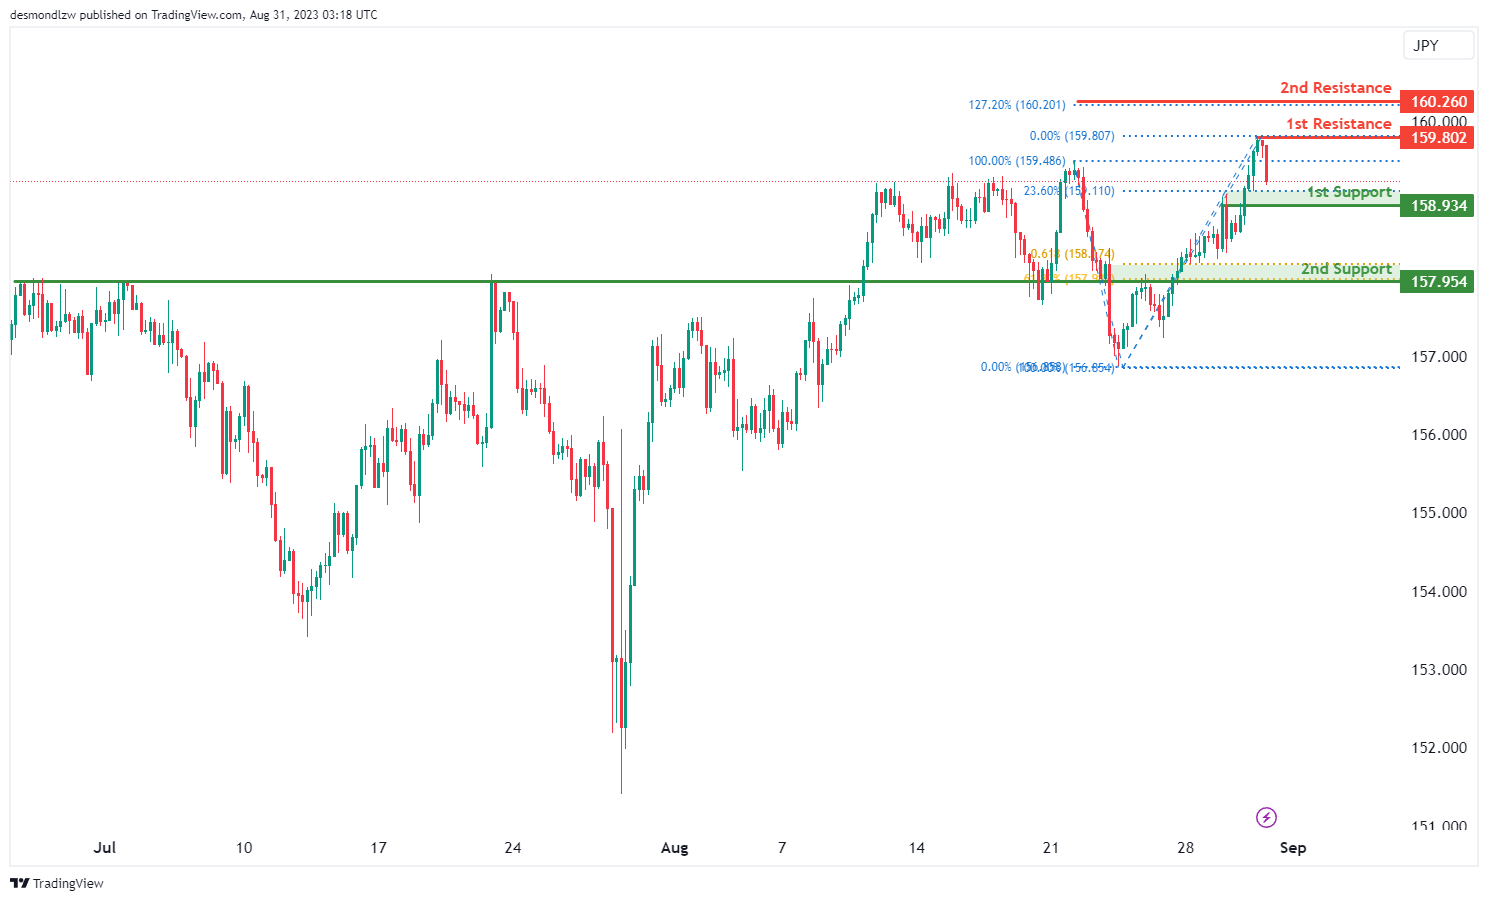
The EUR/JPY pair currently exhibits a bullish momentum. Given this upward trajectory, there’s a notable possibility for the currency pair to take a bullish bounce off its 1st support level, which is positioned at 156.91. This support level stands out mainly due to its classification as a multi-swing low support.
Should the price dip further, the 2nd support level is pegged at 155.48. This support level is recognized as a swing low support and is also reinforced by the 50% Fibonacci Retracement, which adds to its significance as a potential zone of stabilization in the event of a pullback.
On the potential upside, the 1st resistance is identified at 159.32. This resistance level is termed as an overlap resistance. What amplifies its significance is the association with the 127.20% Fibonacci Extension, suggesting that it could serve as a formidable barrier or pivot point in the market, especially for bullish movements.
EUR/GBP:
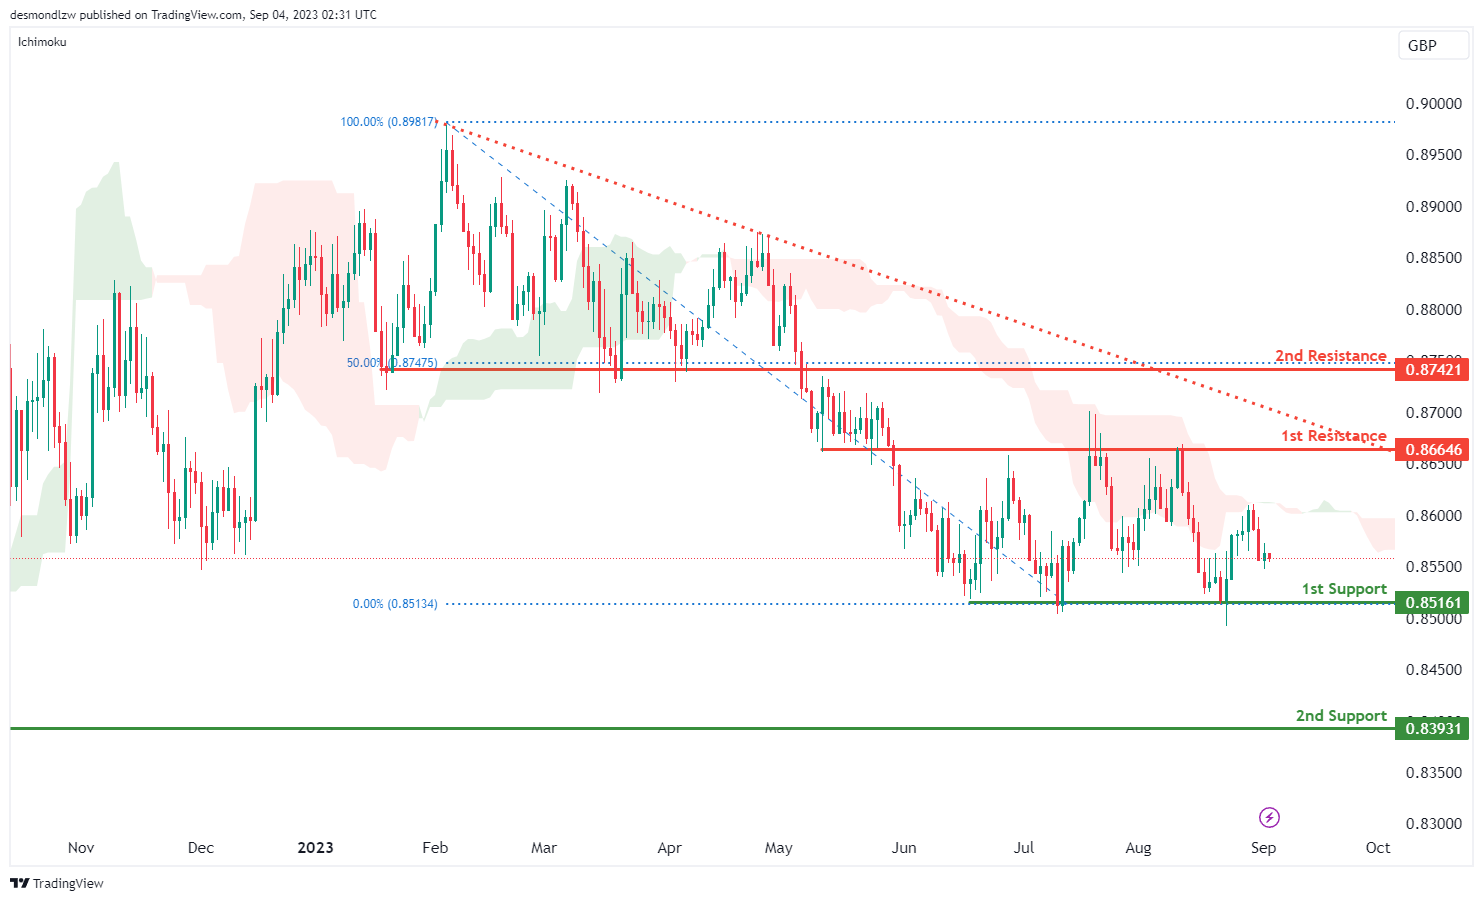
The EUR/GBP pair is currently indicating a bearish momentum. One of the significant factors underscoring this bearish trend is the price’s positioning below a major descending trend line. This pattern suggests that the bearish momentum might persist and continue further.
Given this context, there’s a possibility for the pair to sustain its bearish movement, targeting the 1st support level at 0.8516. This support level is significant due to its characterization as a multi-swing low support, indicating areas where the price has found support in the past.
If the bearish momentum pushes the price even lower, the 2nd support to watch is at 0.8393. This level stands out as an overlap support, representing levels where the price has shown historical interactions.
On the upside, should there be any short-term bullish retractions, the 1st resistance is pegged at 0.8664. This resistance level is noteworthy as an overlap resistance, suggesting zones where past price action might have encountered barriers.
Beyond that, the 2nd resistance is identified at 0.8742. This level serves not only as a pullback resistance but is also aligned with the 50% Fibonacci Retracement, emphasizing its potential importance as a barrier against further bullish movements.
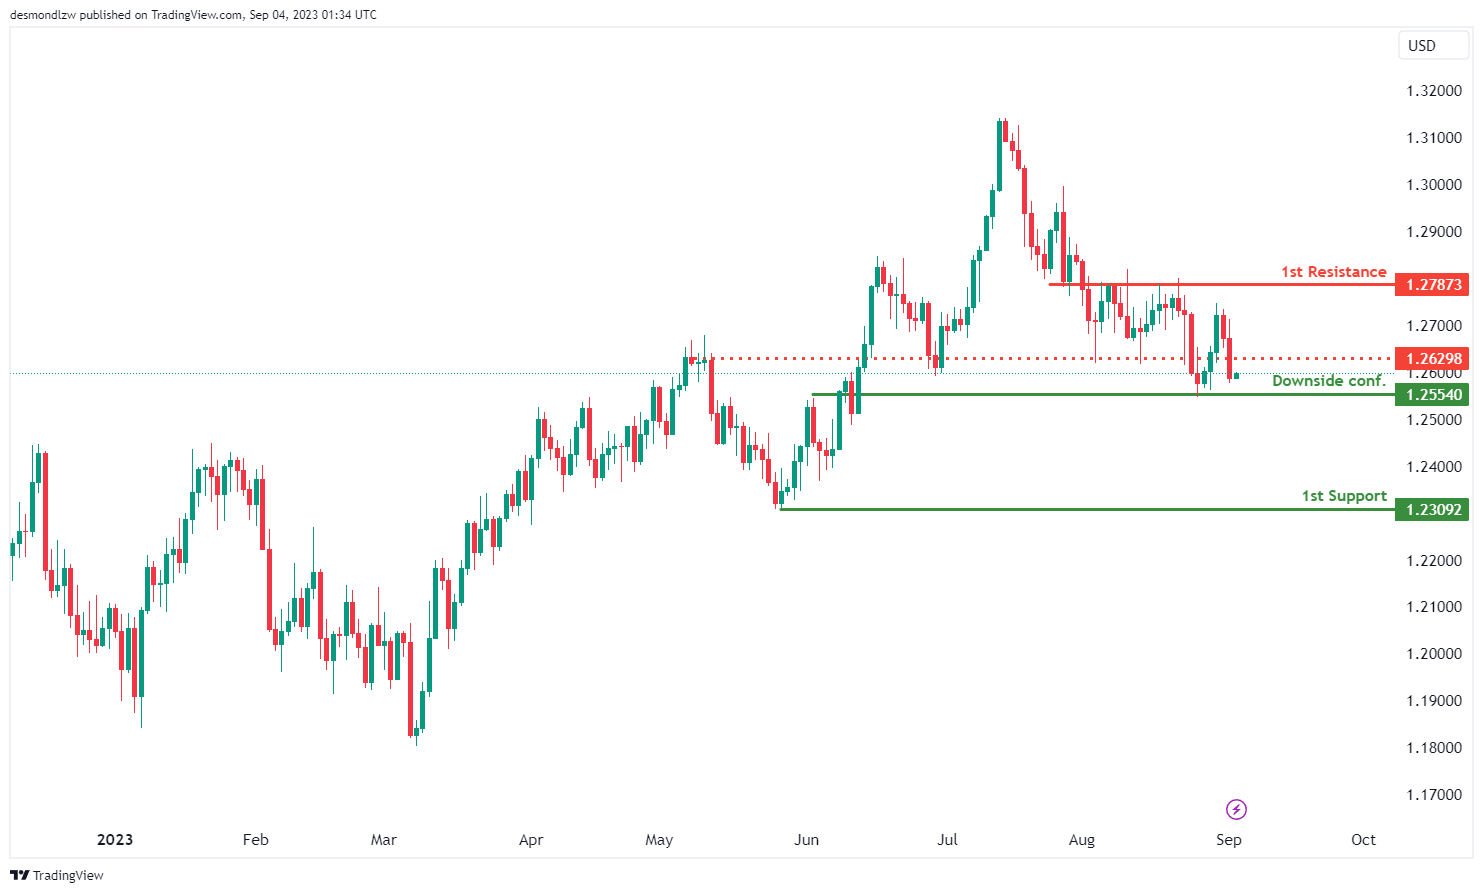
GBP/USD:
The GBP/USD chart is currently exhibiting a bullish overall momentum, indicating an upward trend in price movement. There’s potential for the price to experience a bullish bounce off the 1st support level and subsequently move towards the 1st resistance level.
Before considering potential bullish movement, it’s advised to wait for downside confirmation at 1.2554. This level is identified as an overlap support, indicating that historical price action has found support around this area. Waiting for confirmation can help ensure a stronger foundation for potential price movements.
The 1st support level at 1.2309 is significant as it’s a swing low support. This suggests that historical price action has previously encountered support at this level, potentially serving as a key reference point for future movements.
Should the price exhibit a bullish rebound, the 1st resistance level at 1.2787 becomes relevant. This level is marked as an overlap resistance, implying that historical price action has faced resistance in this region before.
Additionally, an intermediate resistance at 1.2629 is identified as a pullback resistance. This level could play a role in temporarily halting a bullish movement before further potential advancement.
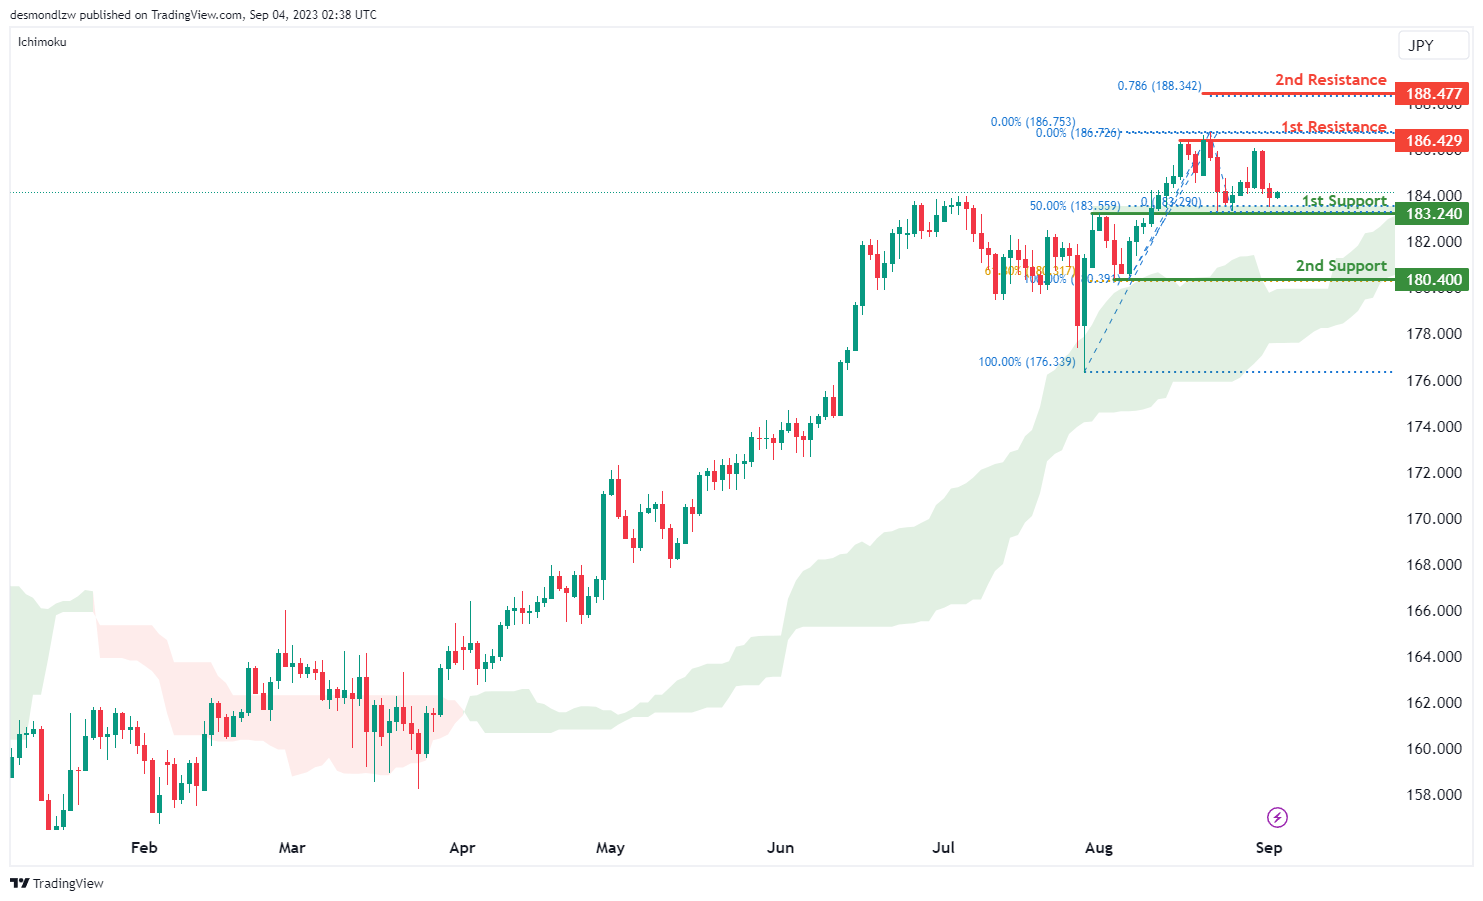
GBP/JPY:
The GBP/JPY chart currently exhibits a bullish trend, primarily because the price is positioned above the bullish Ichimoku cloud.
Given this momentum, there’s a chance for a bullish bounce from the 1st support at 183.24, which is distinguished as an overlap support and aligns with the 50% Fibonacci Retracement. Should the price decline further, the 2nd support to note is at 180.40, a swing low support strengthened by the 61.80% Fibonacci Retracement.
On the bullish front, the 1st resistance is marked at 186.42, identified as a multi-swing high resistance. Beyond that, the 2nd resistance is at 188.47, aligning with the 78.60% Fibonacci Projection.
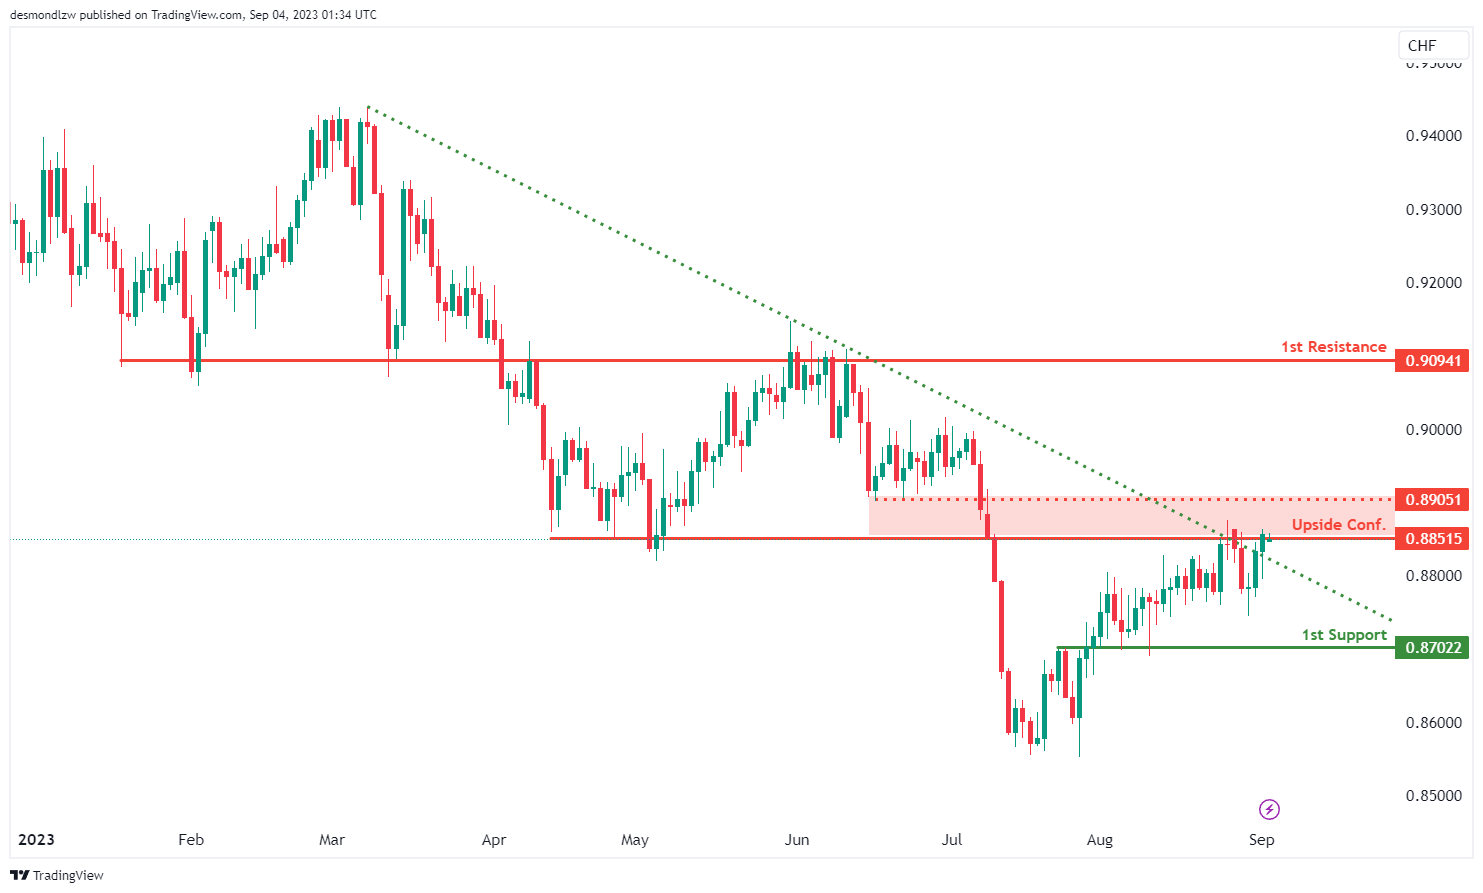
USD/CHF:
The USD/CHF chart is currently displaying a bullish overall momentum, marked by a breakout above a descending resistance line. This breakout has triggered a potential bullish move in the price.
In the short term, there’s potential for the price to experience a drop towards the 1st support level at 0.8702. This level is identified as an overlap support, indicating that historical price action has found support around this area.
Should the price exhibit a drop and reach the 1st support level, a bounce could be anticipated from there. Following this bounce, a potential upward movement towards the 1st resistance level at 0.9094 could occur. This level is marked as an overlap resistance, implying that historical price action has encountered resistance in this region before.
Before considering the upward move, waiting for upside confirmation at 0.8851 is recommended. This level is identified as a multi-swing high resistance, and waiting for confirmation can provide stronger indications of a potential bullish breakout.
Furthermore, an intermediate resistance at 0.8905 is noted as a pullback resistance. This level might act as a temporary barrier to any bullish movement before further potential advancement.
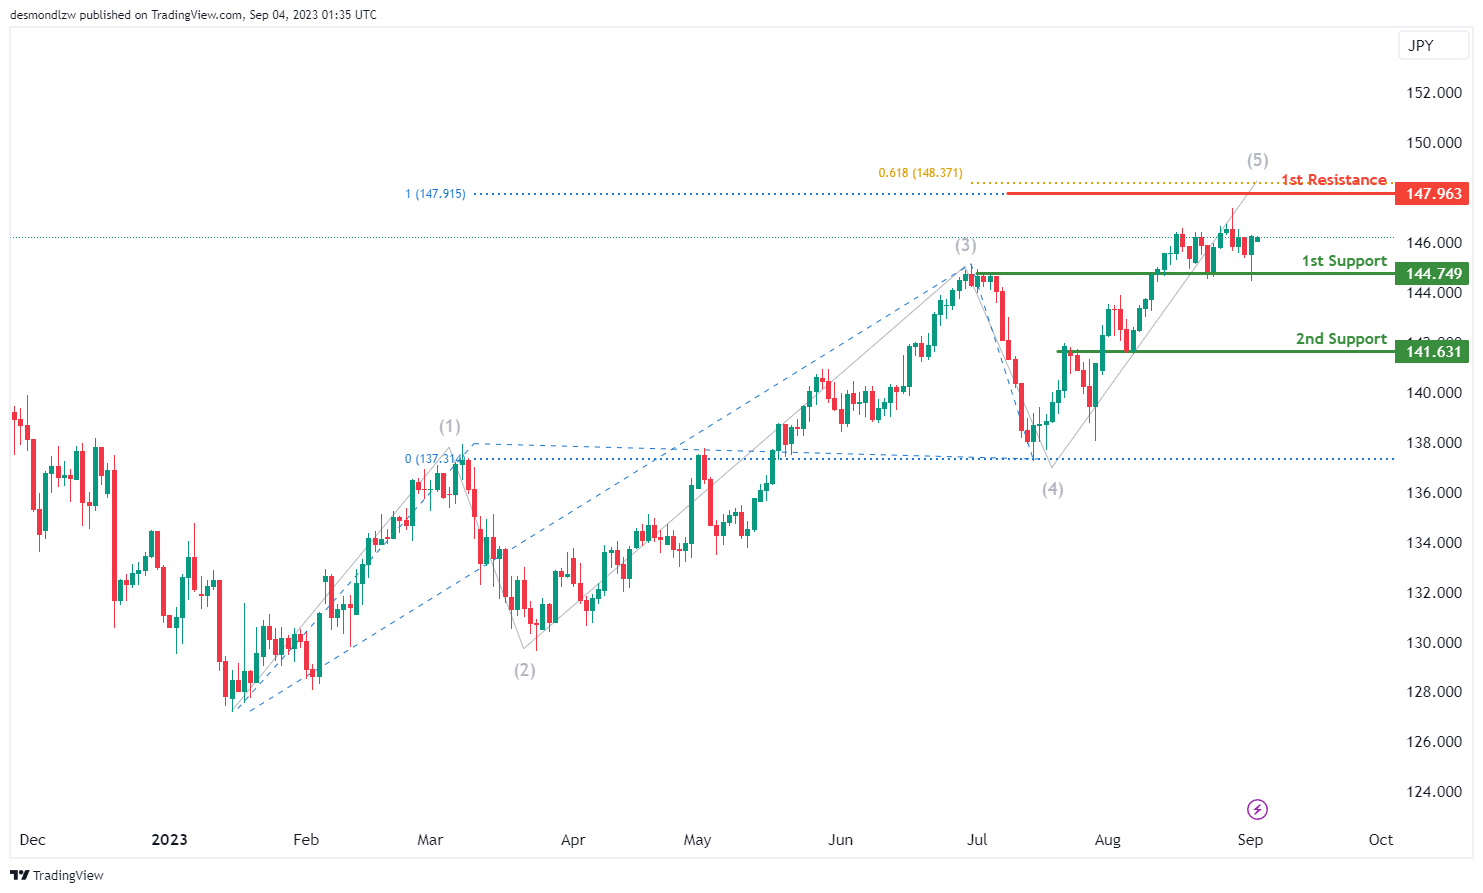
USD/JPY:
The USD/JPY chart is currently demonstrating a bullish overall momentum, indicating an upward trend in the price movement. There is potential for the price to continue its bullish trajectory and possibly reach the 1st resistance level.
The 1st support level at 144.74 is recognized as an overlap support, highlighting historical price action finding support around this region. This level establishes a foundation for potential upward movements.
Similarly, the 2nd support level at 141.63 is also considered an overlap support, suggesting that previous price action has seen support in this area as well.
Looking towards potential resistance levels, the 1st resistance at 147.96 holds significance due to its alignment with the 100% and 61.80% Fibonacci projections. This confluence of Fibonacci levels adds to the importance of this resistance level, making it a point of interest for potential price reactions.
USD/CAD:
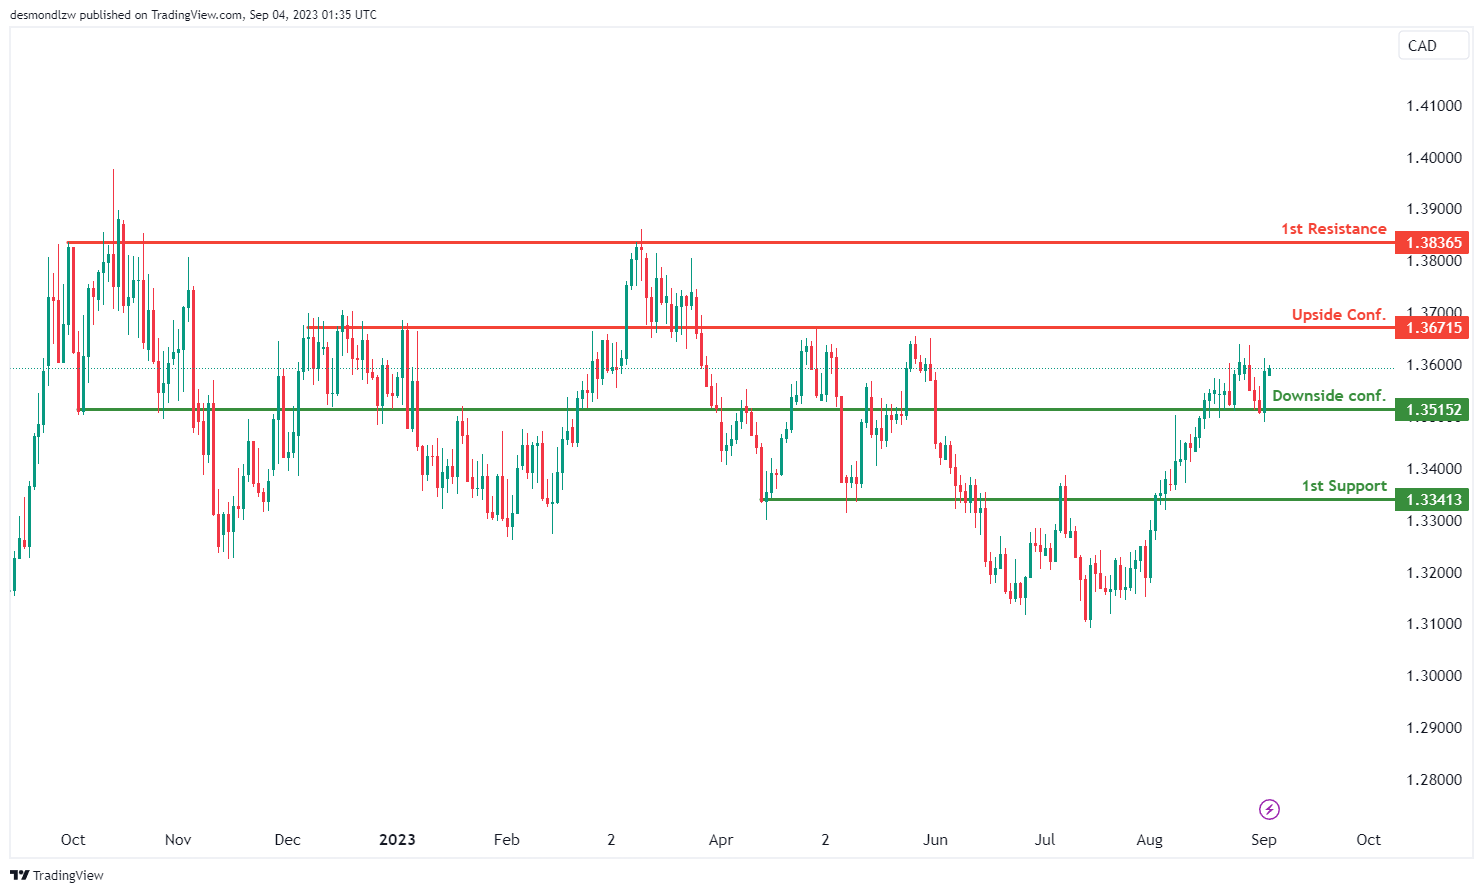
The USD/CAD chart is currently displaying an overall neutral momentum, indicating a lack of a clear trend direction. In this scenario, there’s a possibility that price could fluctuate within the boundaries as defined by the 1st resistance and the 1st support levels.
The 1st support at 1.3341 is identified as an overlap support while the 1st resistance level at 1.3837 is marked as a multi-swing high resistance.
The intermediate support level at 1.3515 is identified as an overlap support and is also marked as a downside confirmation level, indicating that if price breaks under this level, there is potential for further downside movement towards the 1st support.
The intermediate resistance level at 1.3672 is identified as an overlap resistance and is also marked as an upside confirmation level, indicating that if price breaks above this level, there is potential for further upward movement towards the 1st resistance.
AUD/USD:
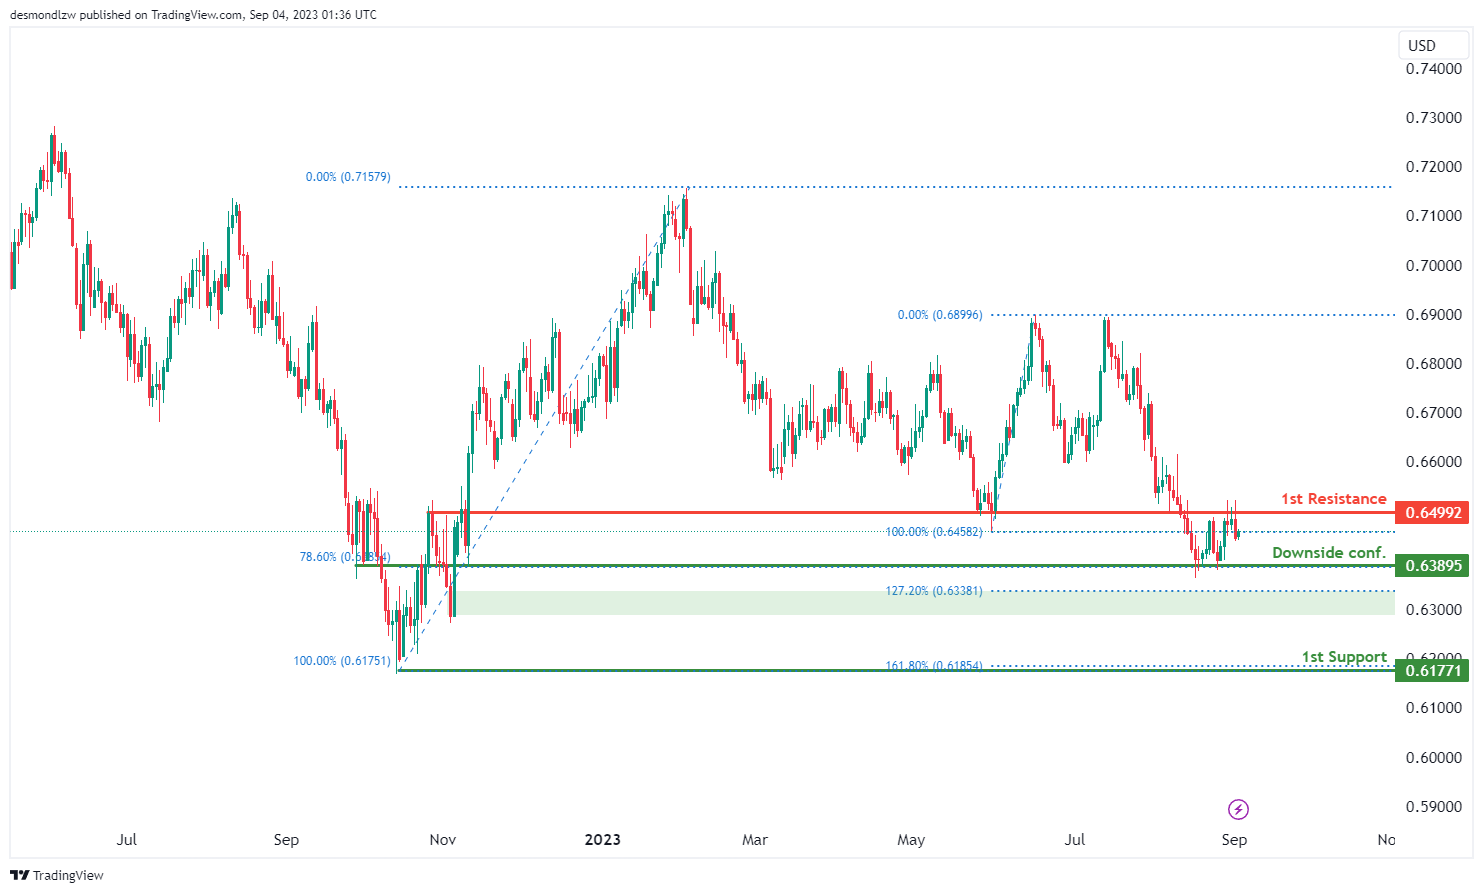
The AUD/USD chart is currently exhibiting an overall neutral momentum, suggesting a lack of a distinct trend direction. Given this scenario, there’s a potential scenario where the price might fluctuate between the 1st resistance and the 1st support levels.
The intermediate support at 0.6390 is noted as pullback support that coincides with the 78.60% Fibonacci retracement level and is also marked as a downside confirmation level, indicating that if price breaks under this level, there is potential for further downside movement towards the 1st support.
The 1st support level at 0.6177 is identified as an overlap support that aligns with the 161.80% Fibonacci extension level, adding to its potential significance as a support zone.
To the upside, the 1st resistance at 0.6499 is identified as an overlap resistance, implying that historical price action has encountered resistance around this level before.
NZD/USD
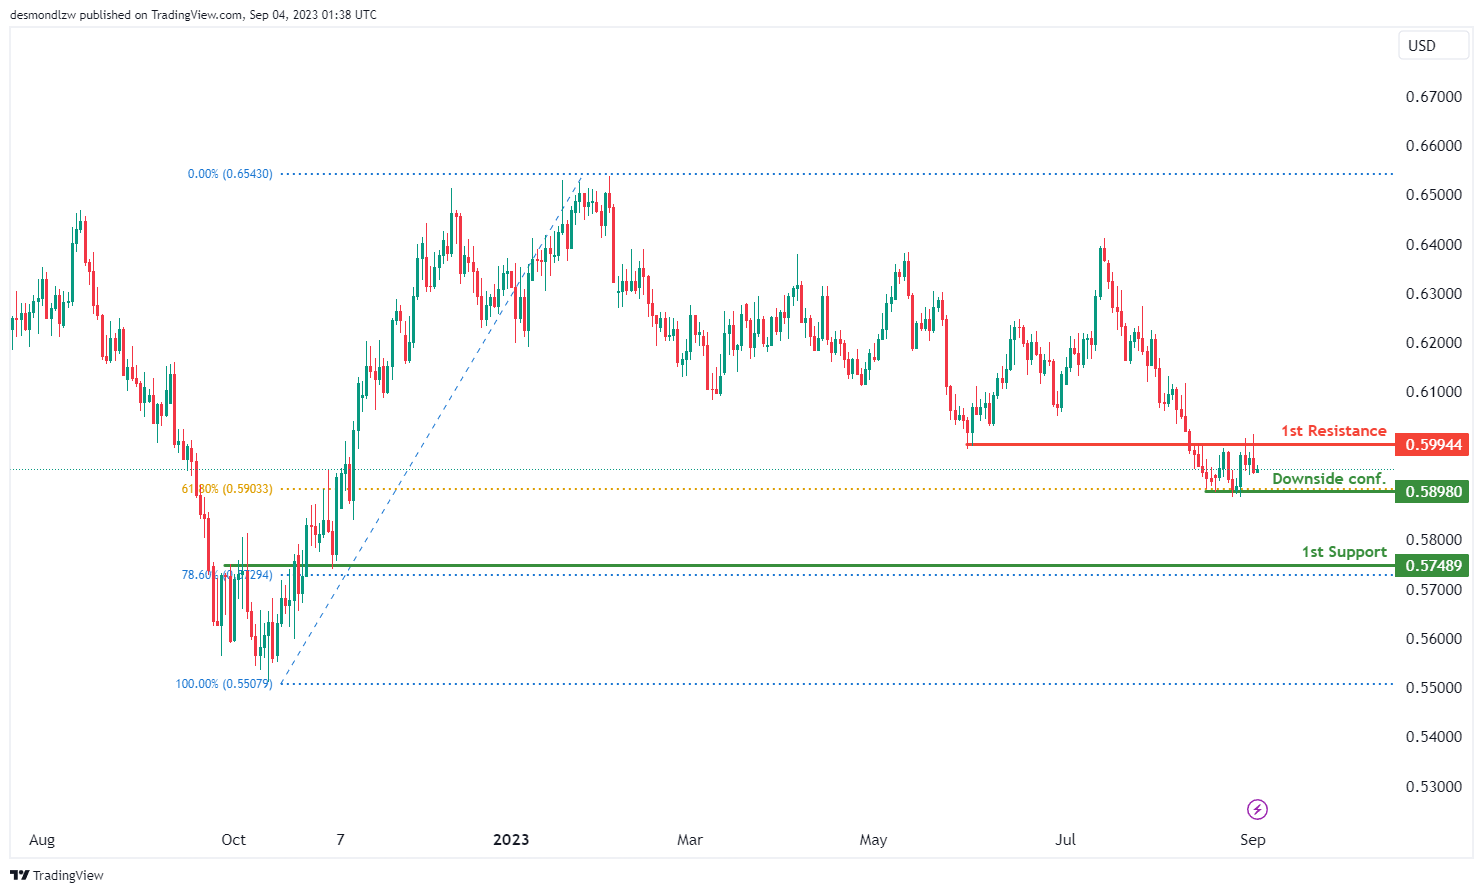
The NZD/USD chart currently presents an overall neutral momentum, suggesting a lack of clear trend direction. In this scenario, there’s a possibility that the price might fluctuate within a range between the 1st resistance and the 1st support levels.
The intermediate support at 0.5898 is identified as pullback support that aligns with the 61.8% Fibonacci retracement level and is also marked as a downside confirmation level, indicating that if price breaks under this level, there is potential for further downside movement towards the 1st support.
The 1st support level at 0.5748 is identified as an overlap support that aligns with the 78.6% Fibonacci retracement level. To the upside, the 1st resistance level at 0.5994 is noted as an overlap resistance, suggesting that historical price action has encountered resistance around this level before.
DJ30:
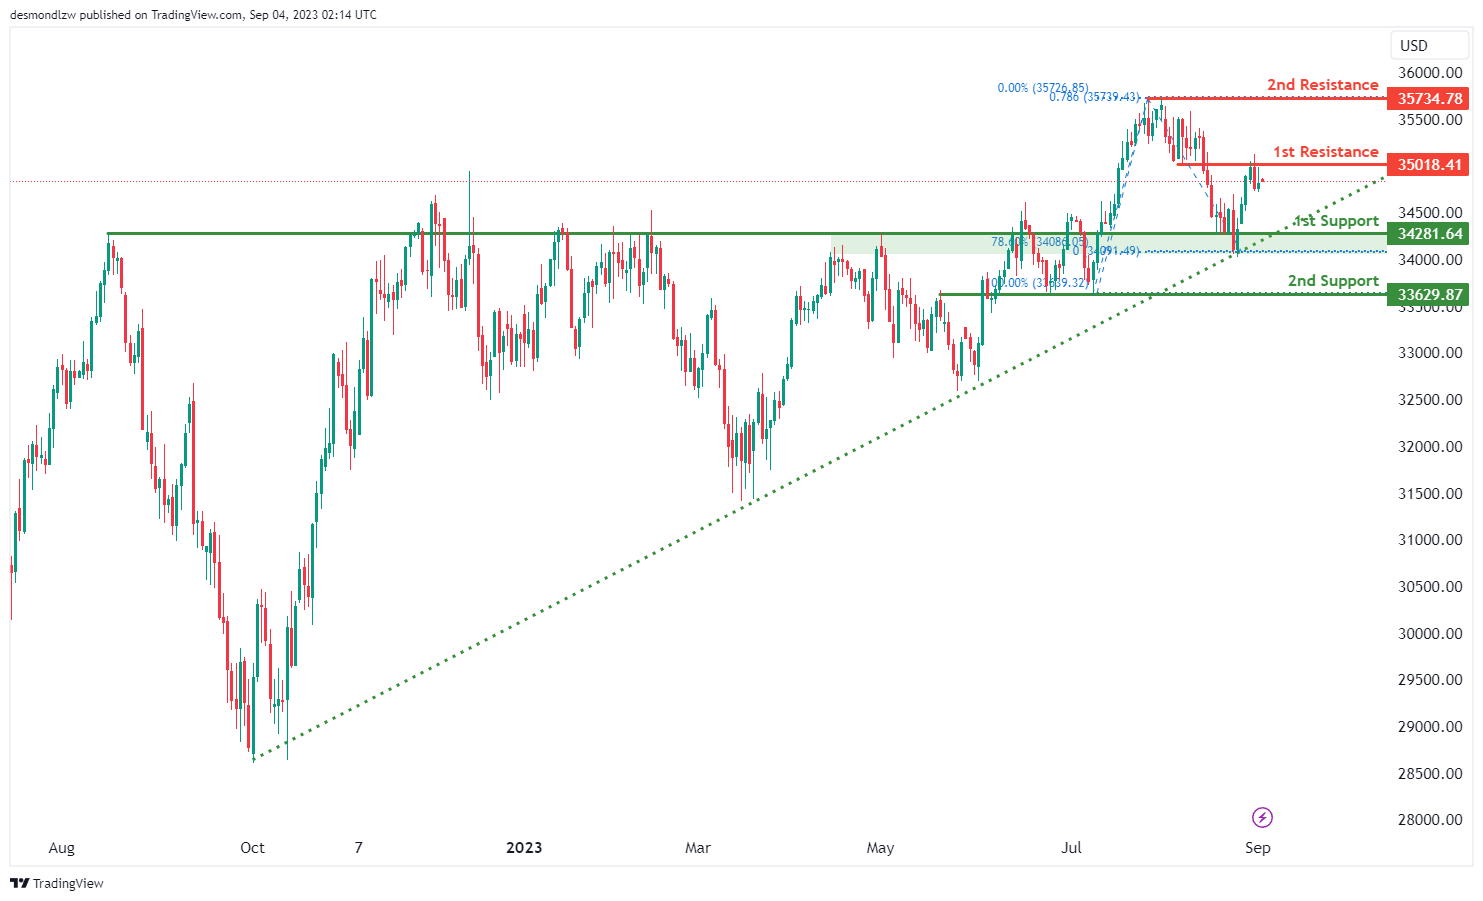
For DJ30, the chart indicates a bearish overall momentum.
The 1st support level at 34281.60 aligns with an overlap support and coincides with the 78.60% Fibonacci retracement level. This makes it a significant level where price could potentially find support.
The 2nd support level at 33629.80 is also identified as an overlap support, further strengthening its significance as a potential level for price to bounce.
The 1st resistance level at 35018.40 is marked as an overlap resistance, which suggests it could act as a barrier to further upward movement.
The 2nd resistance level at 35734.70 coincides with a swing high resistance and the 78.60% Fibonacci projection. This level could serve as a significant hurdle for any bullish attempts.
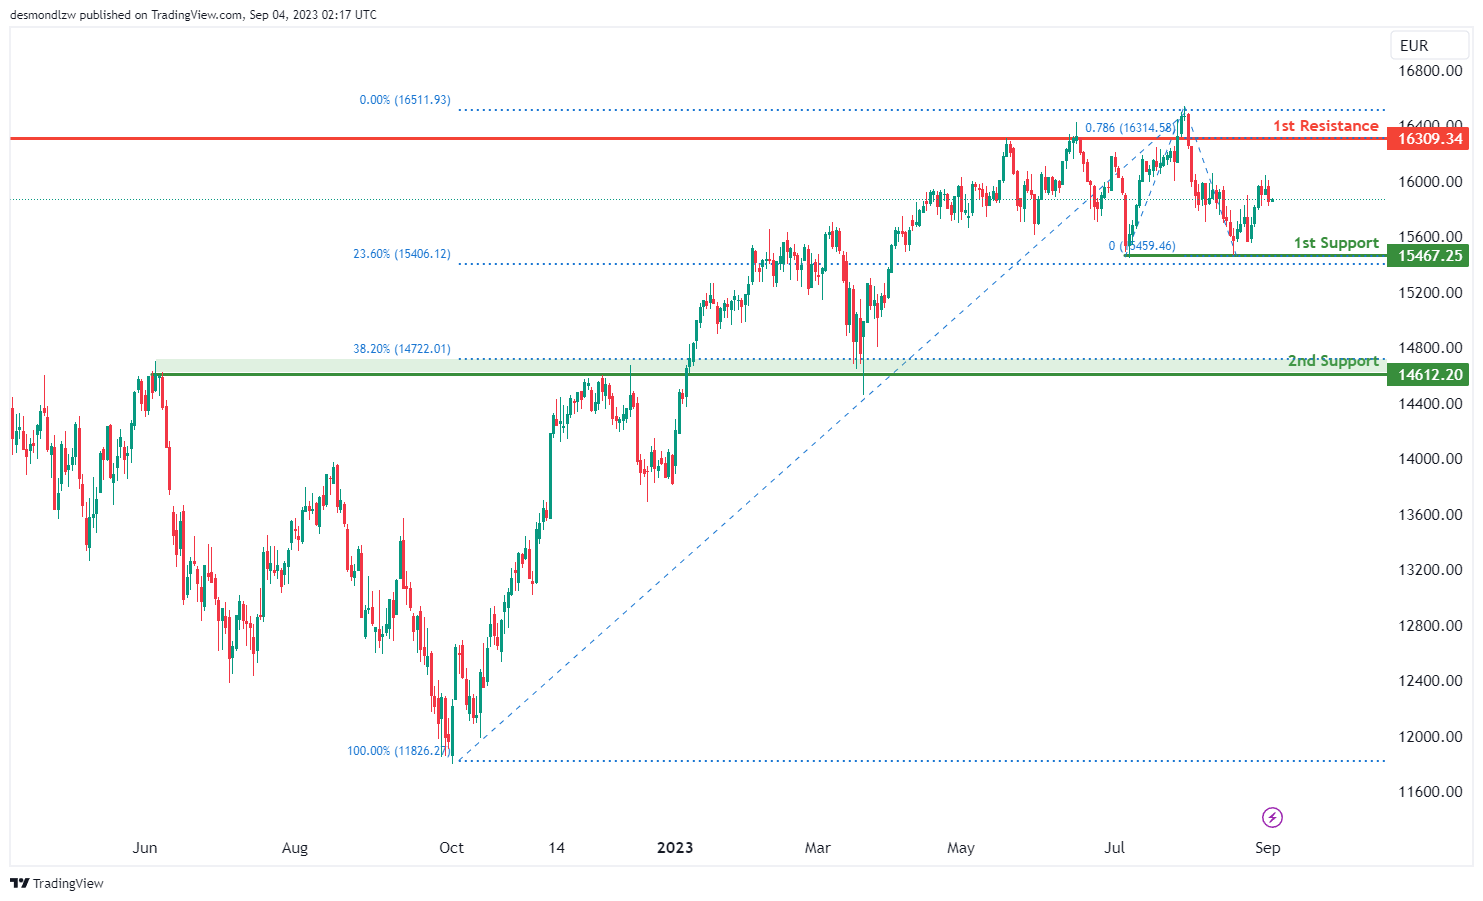
GER30:
For GER30, the chart suggests a bearish overall momentum.
The 1st support level at 15467.20 is significant as it aligns with a multi-swing low support and coincides with the 23.60% Fibonacci retracement level. This makes it a strong candidate for potential support.
The 2nd support level at 14612.20 is identified as an overlap support and further strengthens its importance as a potential area where the price could find support.
The 1st resistance level at 16309.30 is marked as an overlap resistance, indicating it could act as a barrier to any upward movements.
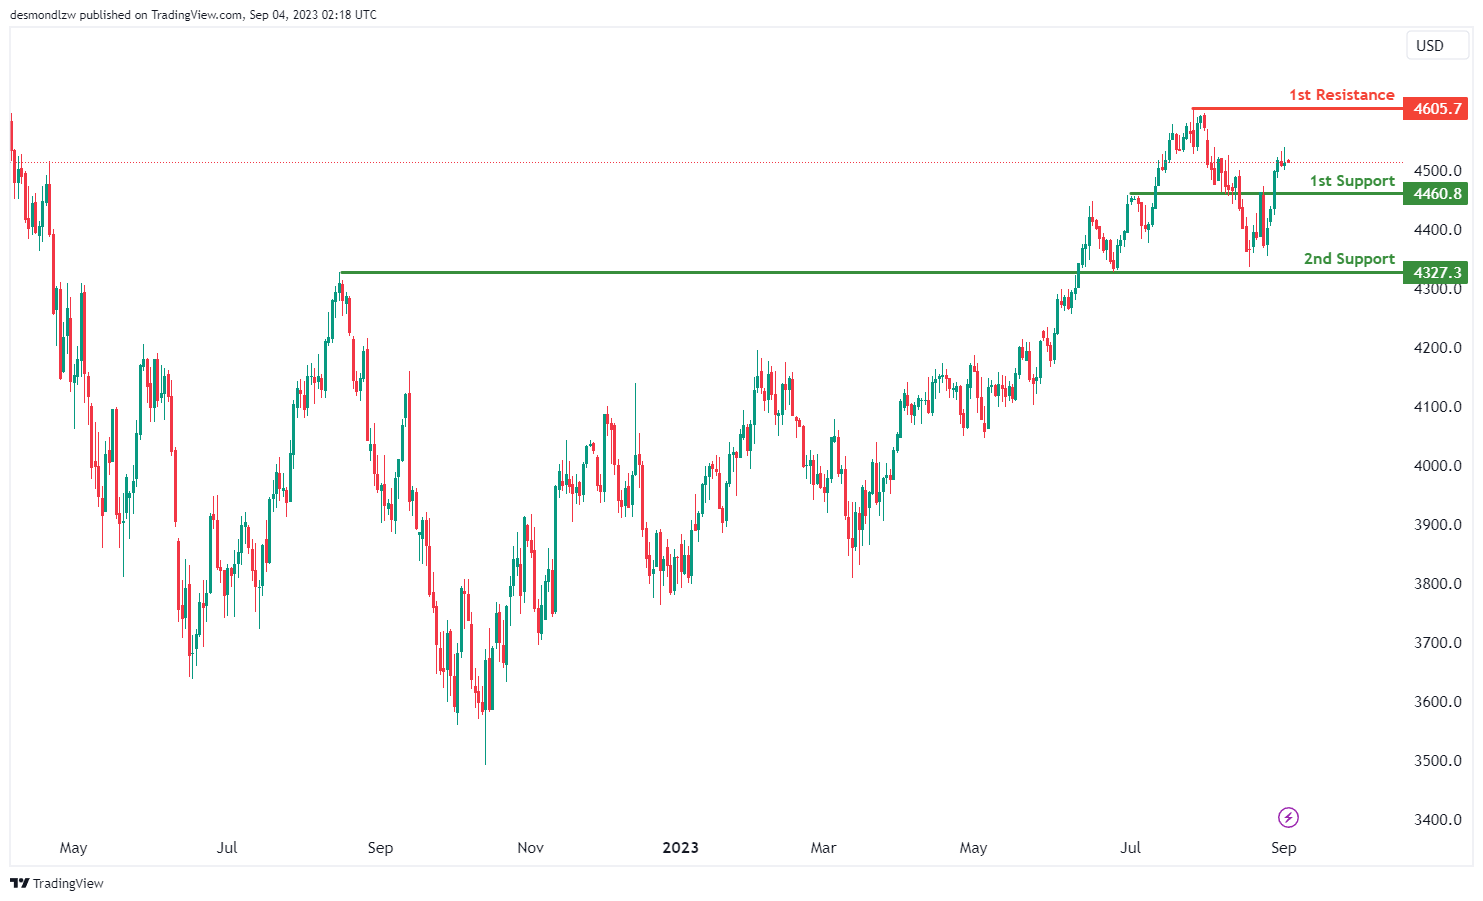
US500
The chart for US500 suggests a bullish momentum, with the price above the bullish Ichimoku cloud.
The 1st support level is at 4460.8, which is considered as a pullback support, and the 2nd support level is at 4327.3, which is an overlap support. These support levels may attract buyers after a short decline.
The 1st resistance is at 4605.7, which is a swing high resistance, often a tough level for price to break past. Given the bullish trend, there could be a brief drop to the 1st support before a potential bounce towards the 1st resistance.
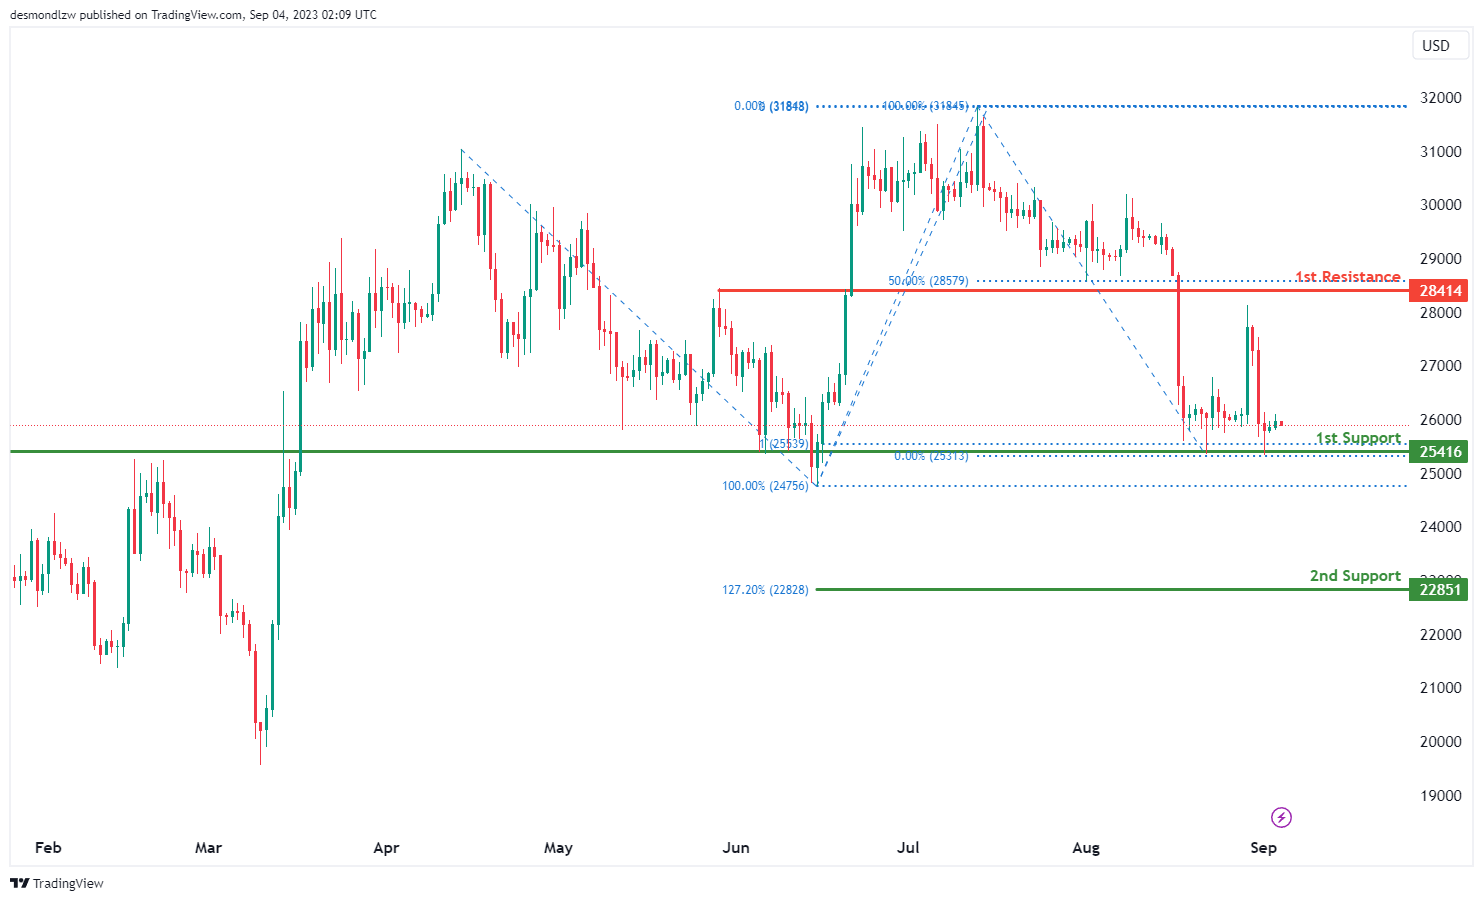
BTC/USD:
For BTC/USD, the chart suggests a bullish overall momentum.
The 1st support level at 25416 aligns with an overlap support and coincides with the 100% Fibonacci projection. This level could act as a strong support area for the price.
The 2nd support level at 22851 aligns with the 127.20% Fibonacci extension, providing additional support in case of a retracement.
The 1st resistance level at 28414 is identified as a pullback resistance, which could serve as a significant barrier to further upward movement.
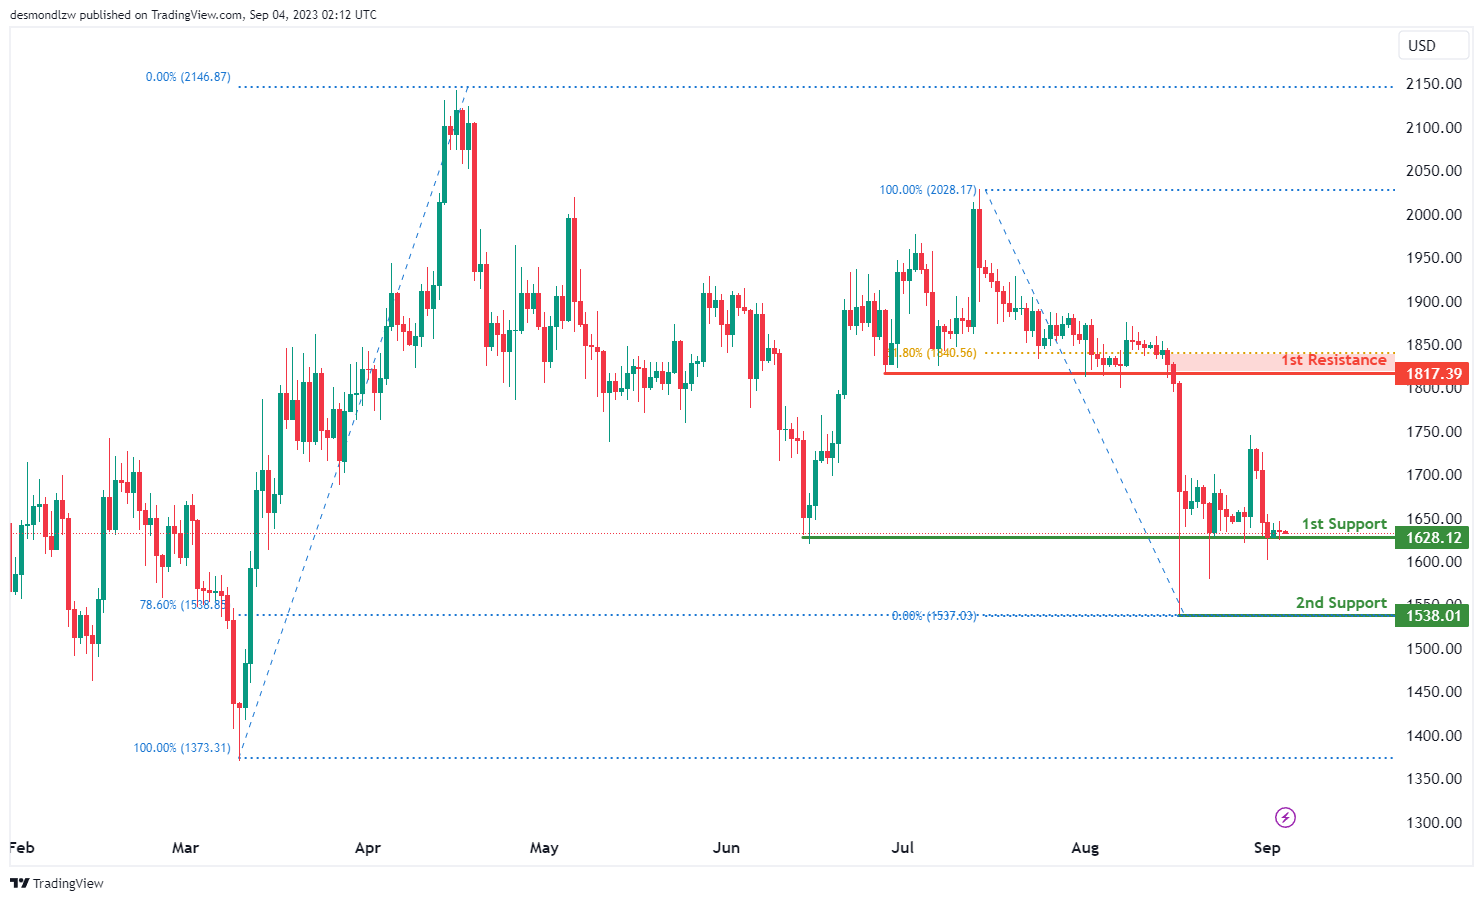
ETH/USD:
For ETH/USD, the chart indicates a bullish overall momentum.
The 1st support level at 1628.12 is based on multi-swing low support, suggesting it’s a significant level for potential price reversals or bounces.
The 2nd support level at 1538.01 aligns with a swing low support and coincides with the 78.60% Fibonacci retracement level. This adds strength to the support level.
The 1st resistance level at 1817.39 is identified as a pullback resistance, indicating that it could act as a significant barrier to further upward movement.
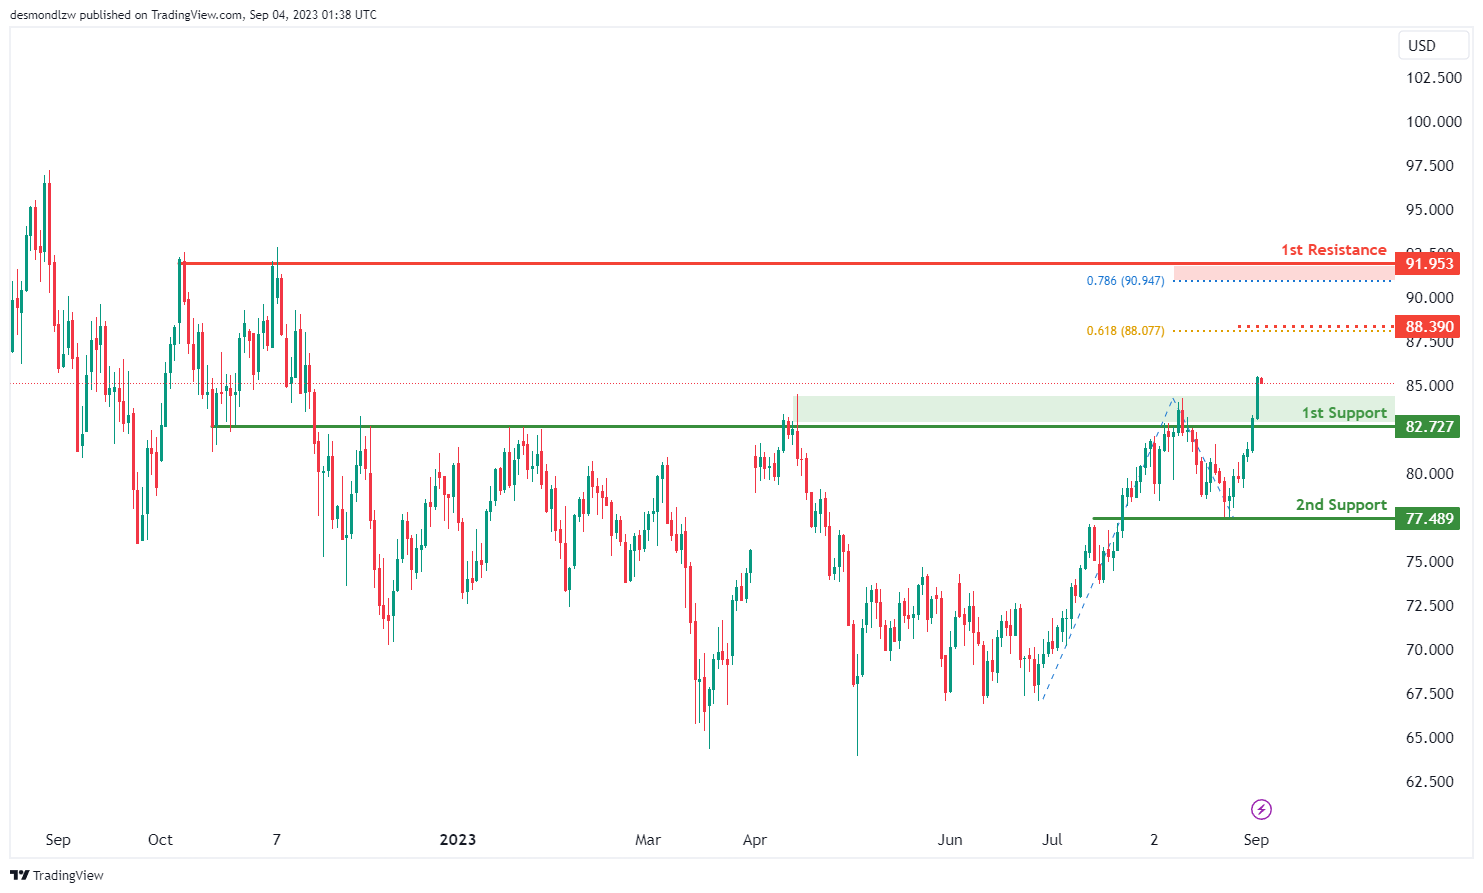
WTI/USD:
The WTI chart currently displays a bullish overall momentum, indicating an upward trend in the price movement. There’s a potential scenario for the price to continue its bullish trend and potentially reach the 1st resistance level.
The 1st support level at 82.72 is marked as pullback support, suggesting that this level could act as a base for potential upward movements. This level is where price might find support if it experiences a temporary pullback.
The 2nd support level at 77.48 is identified as an overlap support, indicating historical instances of price finding support around this level. It further reinforces the potential significance of this support level.
Looking at resistance levels, the 1st resistance at 91.95 is marked as a multi-swing high resistance. This level holds importance due to its alignment with the 78.60% Fibonacci projection level, adding to its potential significance as a resistance zone.
Additionally, the intermediate resistance at 88.39 is noted for its alignment with the 61.80% Fibonacci projection level. This further reinforces the potential for resistance at this level.
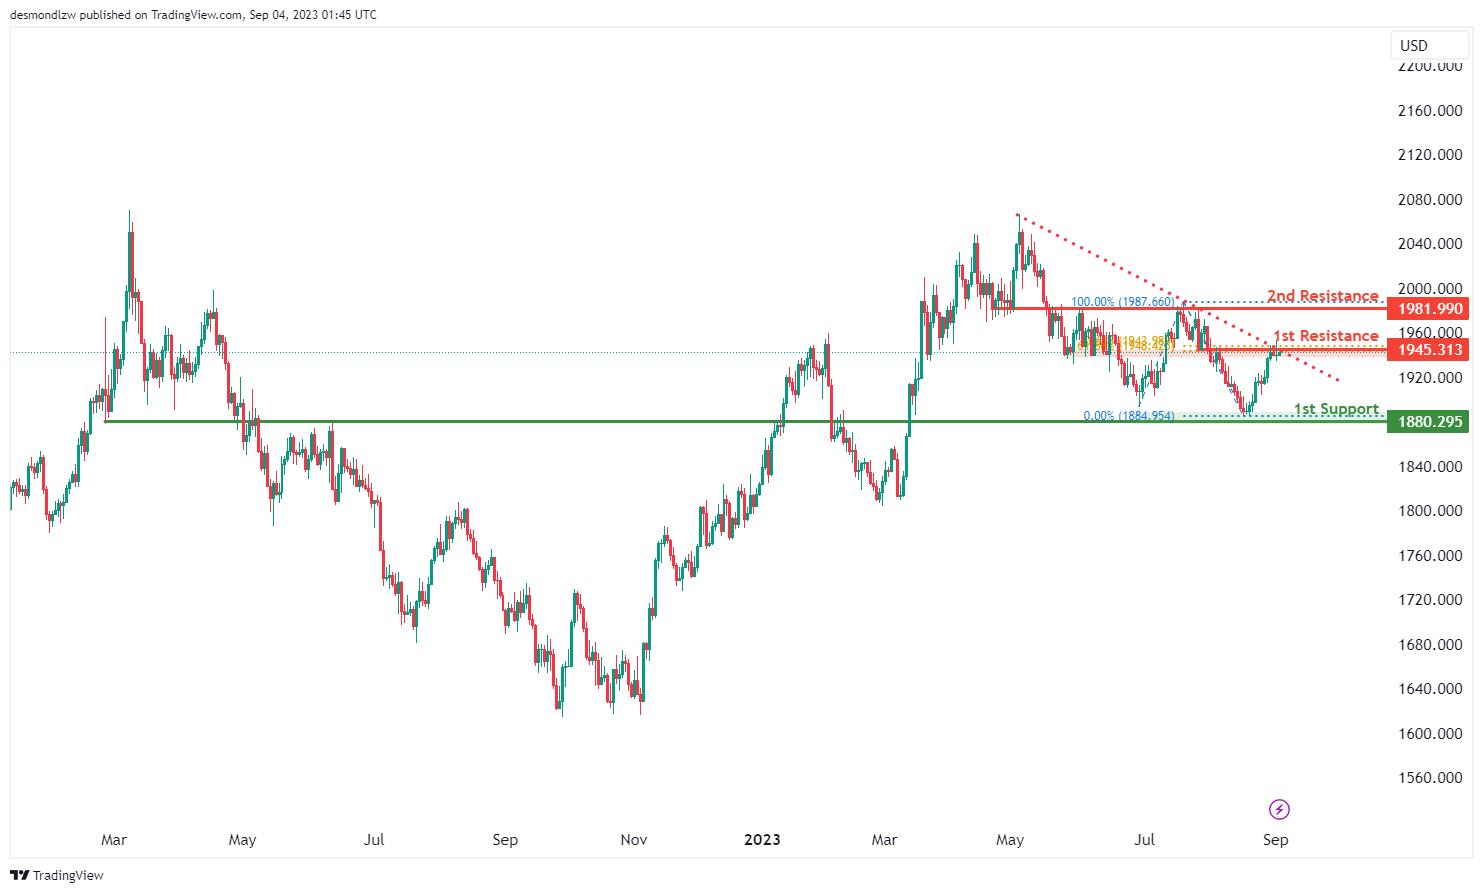
XAU/USD (GOLD):
The XAU/USD chart currently exhibits a bearish overall momentum, signaling a downward trend in the price movement. This bearish sentiment is reinforced by the fact that the price is positioned below a significant descending trend line, which suggests a continuation of bearish momentum.
There’s a potential scenario where the price reacts bearishly at the 1st resistance level, leading to a drop towards the 1st support.
The 1st support level at 1880.29 is identified as an overlap support, indicating historical instances of the price finding support around this level. This support level could act as a base for potential downward movements.
Looking at resistance levels, the 1st resistance at 1945.31 holds particular importance due to its alignment with the 61.80% Fibonacci retracement and 61.80% Fibonacci projection. This confluence of Fibonacci levels enhances the significance of this resistance level, making it a noteworthy zone to monitor for potential price reactions.
Additionally, the 2nd resistance at 1981.99 is also marked as an overlap resistance, suggesting that historical price action has encountered resistance in this area before.


