
- The Japanese Nikkei 225 has outperformed the rest of the world for the dreaded month of August where most global benchmark stock indices recorded their worst losses in three months.
- Since its 18 August 2023 low, it has recorded a gain of 6.1% as of yesterday, 6 September.
- 33,000 is the key short-term support to watch.
The price actions of the Japan 225 (JPY) Index (a proxy of the Nikkei 225 futures) have staged the expected rebound right above the 31,130 key medium-term support as highlighted in the prior report and hit the 32,810 resistance on 30 August 2023.
Thereafter, it continued to rally and staged a bullish breakout from a two-month descending range (“bullish flag” from 16 June 2023 high of 34,015) yesterday, 6 September within a major uptrend phase in place since 3 January 2023 low of 25,585.
All in all, it has gained by +6.1% from its 18 August 2023 swing low to yesterday’s 6 August US session close of 33,148. Also, for the dreaded month of August that negatively impacted almost all major benchmark stock indices, the Nikkei 225 cash index has outperformed the rest of the world with a monthly loss of -1.67% versus a wider monthly loss of -2.91% inflicted on the iShares MSCI All World Index exchange-traded fund over the same period.
Let’s now examine what’s in store for the Japan 225 (JPY) Index from the lens of technical analysis.
Medium-term momentum bullish breakout reinforces price actions breakout from 2-month range
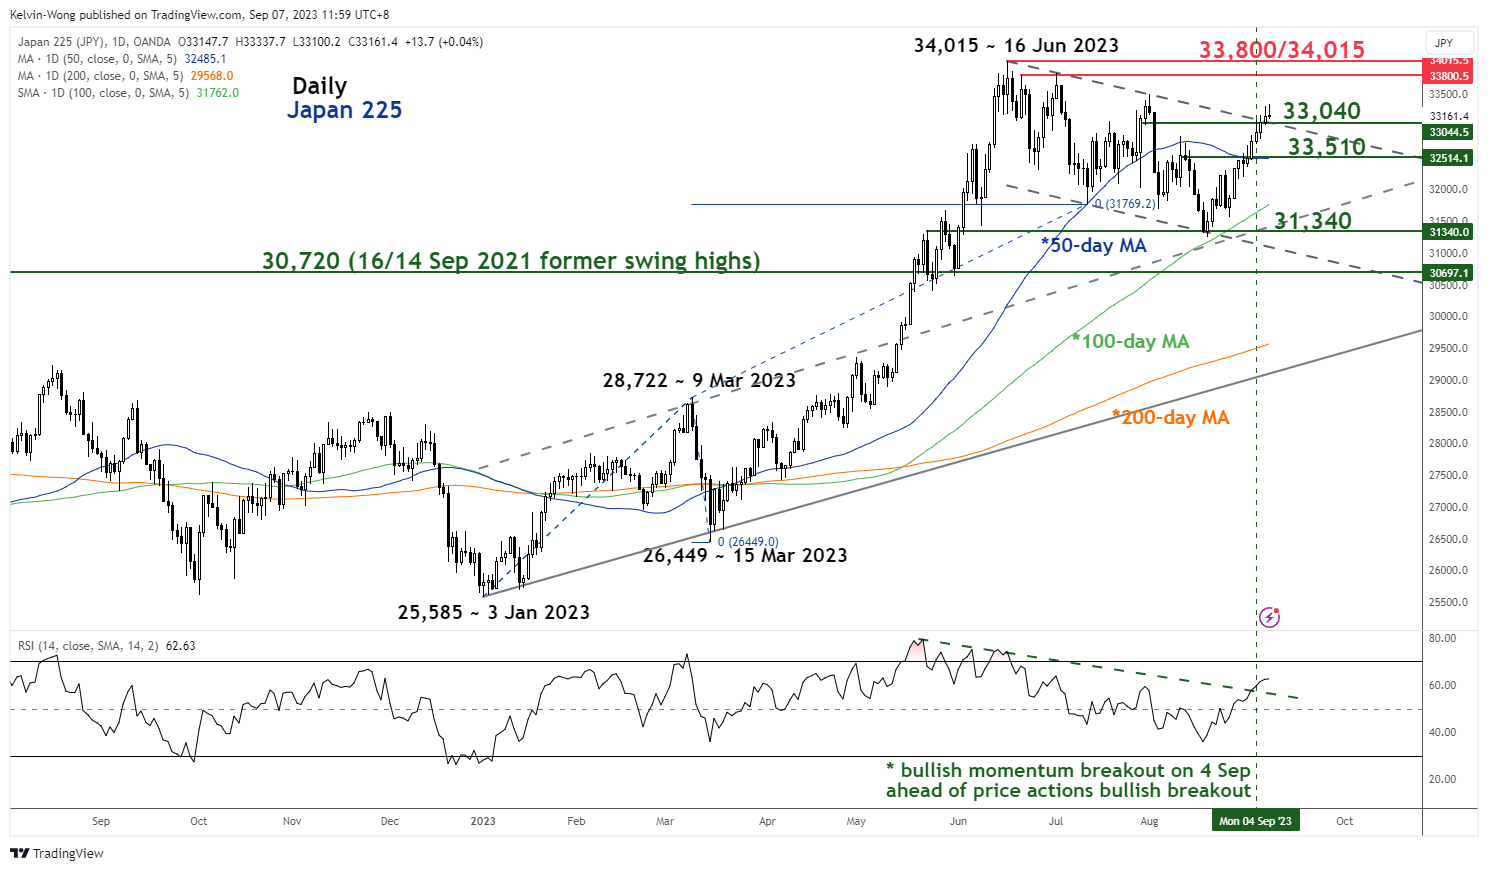
Fig 1: Japan 225 medium-term trend as of 7 Sep 2023 (Source: TradingView, click to enlarge chart)
Prior to yesterday’s price actions’ bullish breakout above the descending range resistance, the daily RSI indicator, a gauge of momentum has staged an earlier bullish breakout on 4 September 2023 above its parallel descending resistance.
These observations have indicated the medium-term upside momentum has resurfaced which in turn reduces the odds of a price action’s failure bullish breakout. Hence, it is likely that the Index has kickstarted a potential medium-term impulsive up-move sequence within its major uptrend phase in place since the 3 January 2023 low.
Price actions are retesting the 33,000 pull-back support
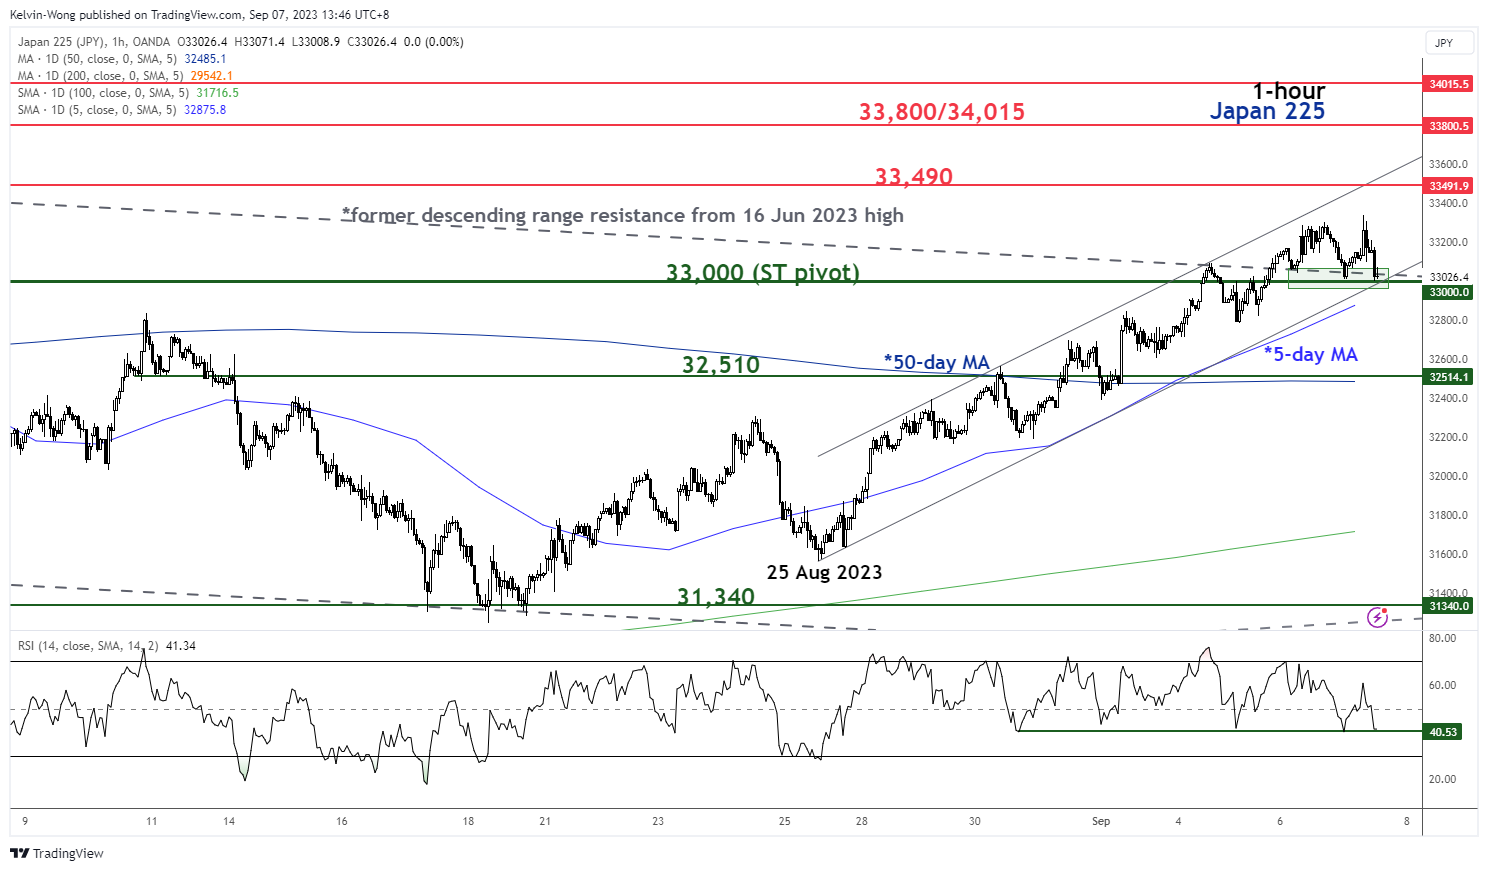
Fig 2: Japan 225 minor short-term trend as of 7 Sep 2023 (Source: TradingView, click to enlarge chart)
As seen on the shorter-term 1-hour chart, the price actions of the Japan 225 (JPY) Index have staged a pull-back and retested the former “descending range’ resistance now turns pull-back support at 33,000 which also confluences with the lower boundary of a minor ascending channel from 25 August 2023 low and upward sloping 5-day moving average.
Watch the 33,000 key short-term pivotal support to maintain the potential short-term bullish bias scenario to see the next intermediate resistance coming in at 33,490 (the upper boundary of the minor descending channel & the 1 August 2023 minor swing high) in the first step.
On the other hand, a break below 33,000 negates the bullish tone to expose the 50-day moving average now acting as a support at 32,510.


 Index (a proxy of the Nikkei 225 futures) have staged the expected rebound right above the 31,130 key medium-term support as highlighted in the prior report and hit the 32,810 resistance on 30 August 2023.)