
- The recent four months of bullish acceleration may have reached a major climax condition at 166.60 resistance.
- The short-term minor trend of CHF/JPY has turned bearish as it traded below the prior upward-sloping 20-day moving average.
- Watch the key short-term resistance at 165.60 on CHF/JPY.
After recording an accumulated gain of +2,378 pips since January 2023, the cross pair CHF/JPY seems to have lost its bullish mojo as it failed to make any headway above the 166.60 key major resistance and broke below its medium-term support at 164.50 (defined by the lower boundary of an ascending channel from 20 March 2023 low) yesterday, 11 September.
A major bullish climax may have been reached
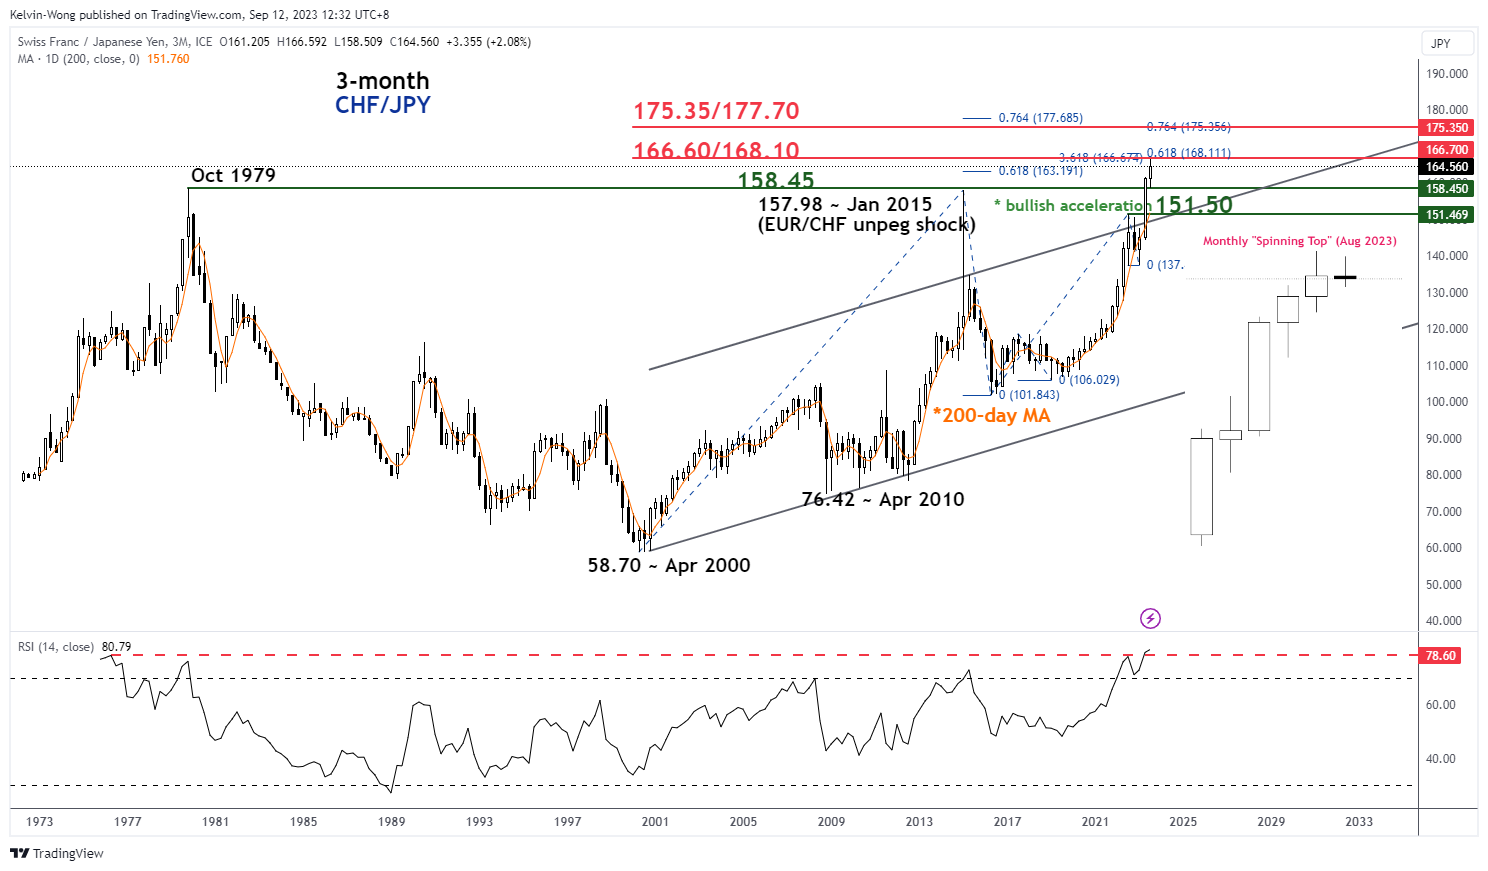
Fig 1: CHF/JPY long-term term secular trend as of 12 Sep 2023 (Source: TradingView, click to enlarge chart)
The recent bullish acceleration move in the past four months may have reached a climax where price actions at the end of August 2023 formed a monthly bearish “Spinning Top” candlestick pattern coupled with the 3-month RSI oscillator hitting an extreme all-time high overbought level of 80.79 at this time of the writing based on data available since April 1972.
Short-term momentum has turned bearish
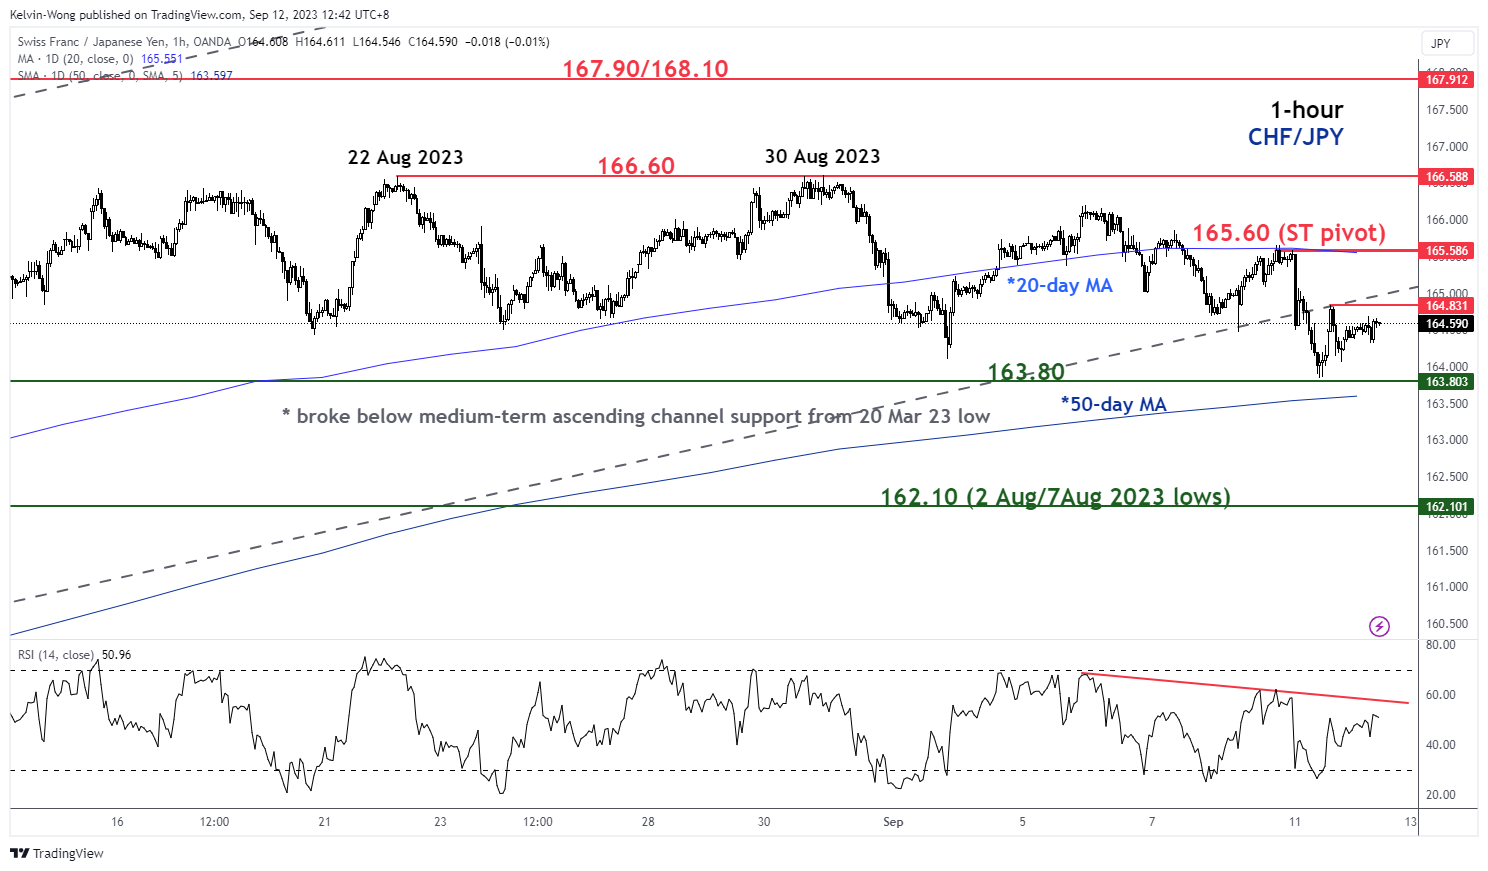
Since 7 September 2022, the CHF/JPY has pierced below its 20-day moving average and started to form a series of “lower highs” and “lower lows”.
In conjunction with the 1-hour RSI oscillator that has also traced out similar “lower highs” below a parallel descending resistance at the 57-level which suggests short-term bearish momentum of price actions remains intact.
Watch the 165.60 key short-term pivotal resistance (also the 20-day moving average) and a break below the intermediate support at 163.80 (former minor range resistance of 21 July to 8 August 2023 & the 50-day moving average) may trigger a further impulsive slide to see the next support coming in at 162.10 in the first step.
However, a clearance above 165.60 negates the bearish tone for a push-up to retest the 166.60 key major resistance.


 yesterday, 11 September.)