
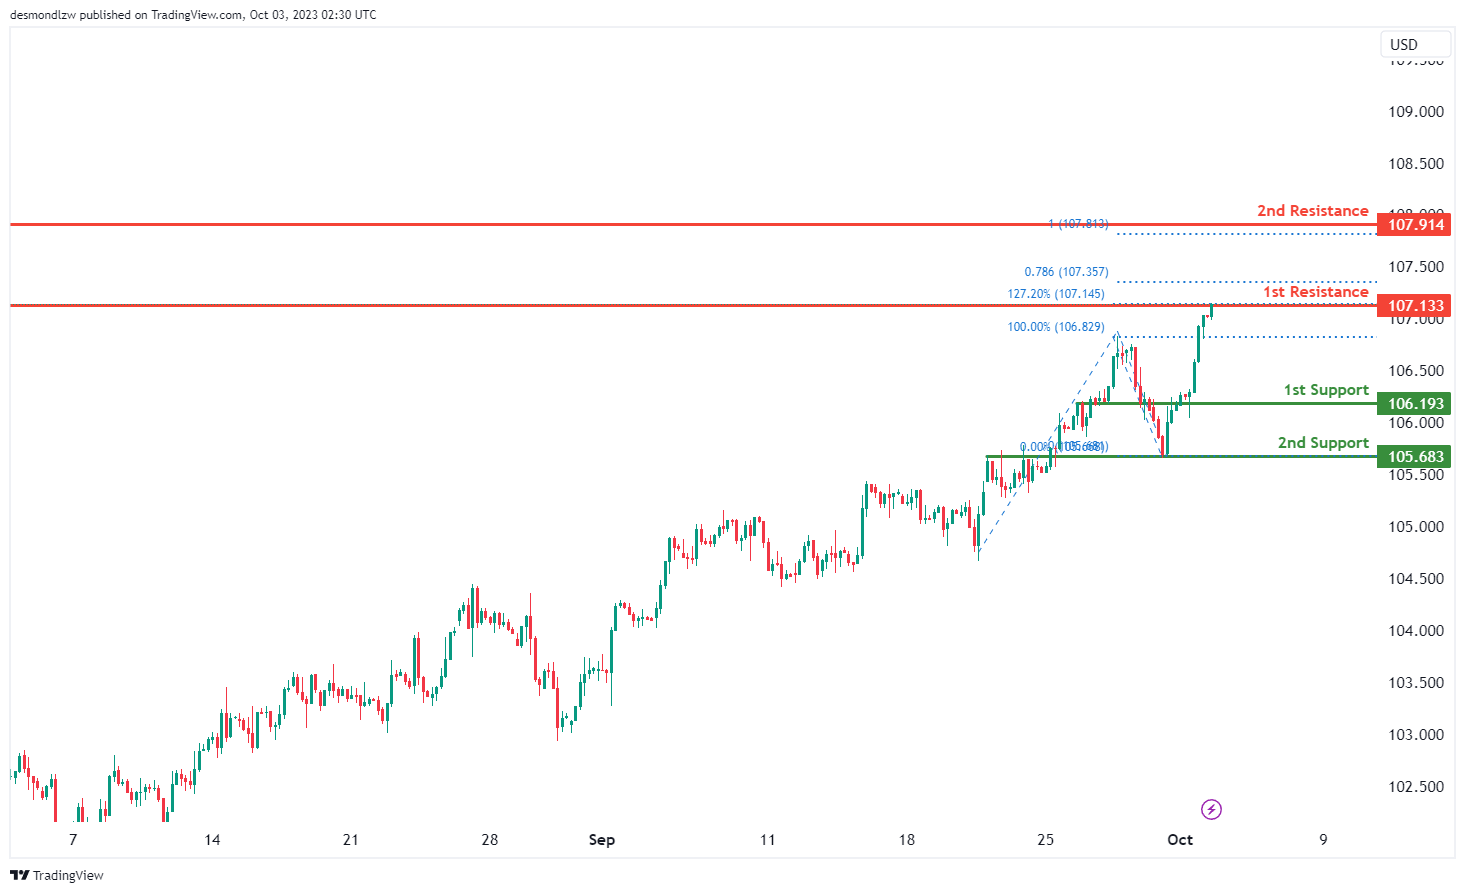
DXY:
The DXY chart currently demonstrates a bullish momentum, with the possibility of a short-term drop to the 1st support level before potentially bouncing and rising towards the 1st resistance level.
The 1st support at 106.19 is identified as an overlap support, which may provide a level of price stability. The 2nd support at 105.68 is also considered an overlap support, potentially offering additional support to price declines.
On the resistance side, the 1st resistance at 107.13 is crucial, with the presence of the 127.20% Fibonacci Extension, indicating its significance as a potential barrier to price increases. Beyond this, the 2nd resistance level at 107.91 is recognized as a swing high resistance
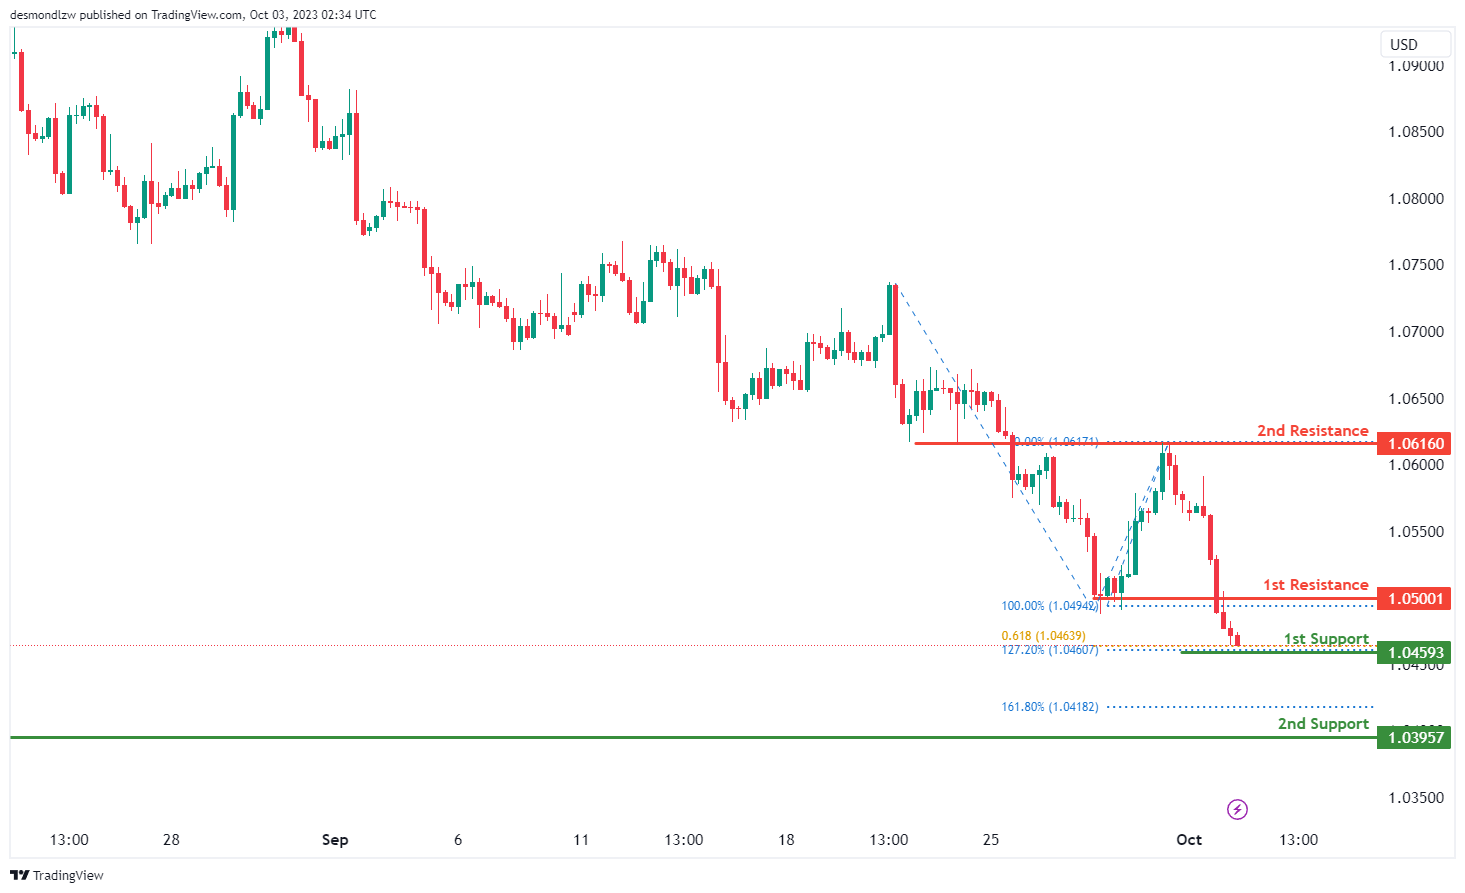
EUR/USD:
The EUR/USD chart currently exhibits bearish momentum, with the potential scenario of a short-term rise towards the 1st resistance level before reversing and moving towards the 1st support.
The 1st support at 1.0459 is considered significant due to the presence of the 61.80% Fibonacci Projection and the 127.20% Fibonacci Extension, suggesting Fibonacci confluence and making it a noteworthy level for potential price reversals. Additionally, the 2nd support at 1.0395 is identified as a swing low support, further reinforcing its importance as a potential support level.
On the resistance side, the 1st resistance at 1.0500 is characterized as an overlap resistance, indicating its potential role as a barrier to price increases. Furthermore, the 2nd resistance at 1.0395 is recognized as a swing high resistance, emphasizing its significance in potential price reversals.
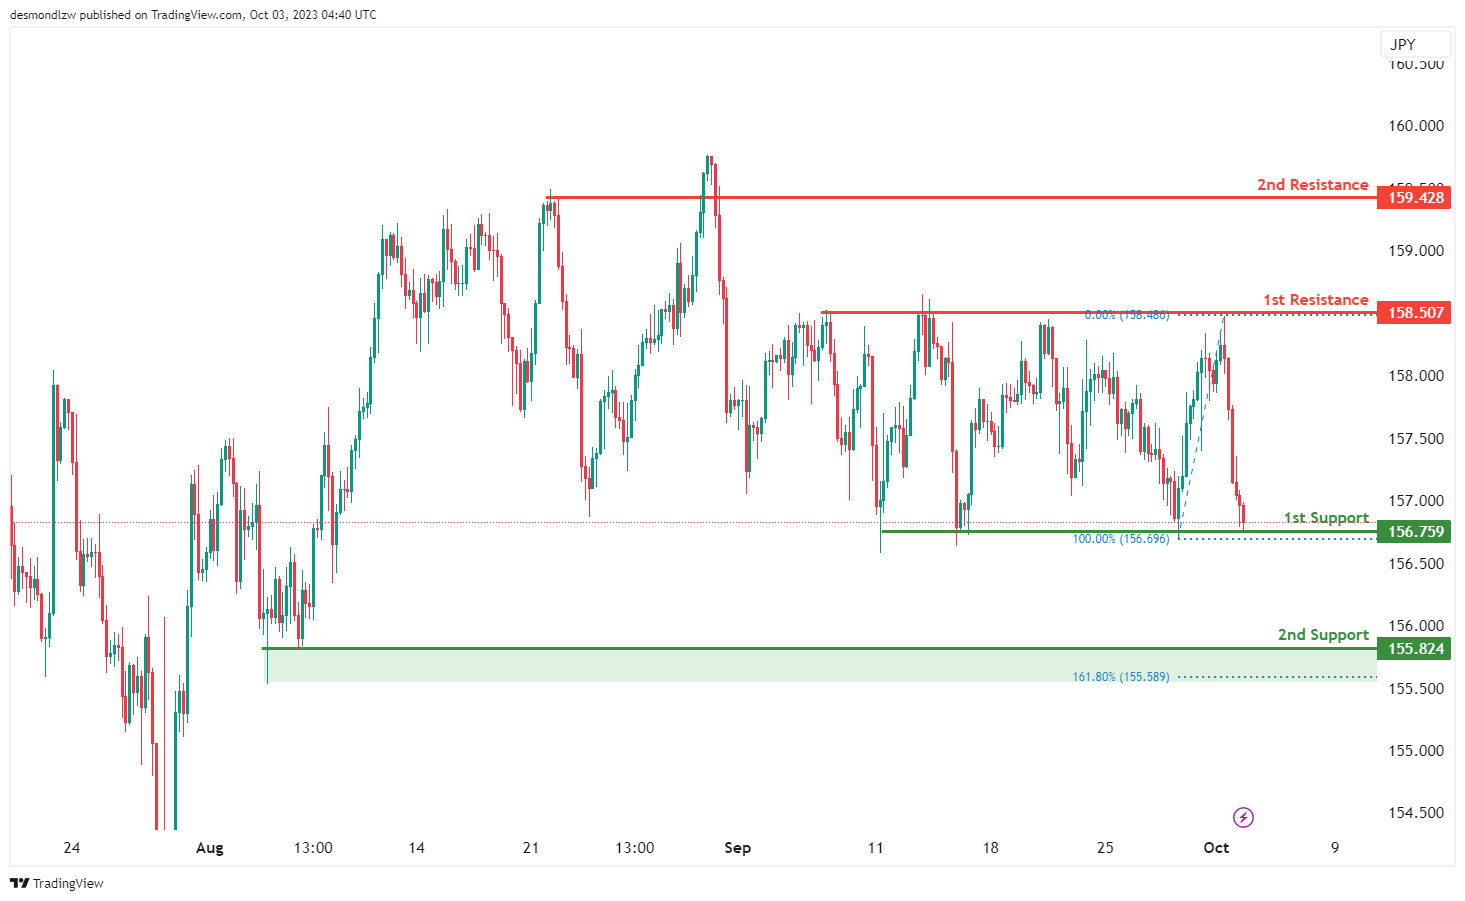
EUR/JPY:
The instrument being analyzed is EUR/JPY, and the current overall momentum of its chart is bullish.
There is a potential scenario where the price could make a bullish bounce off the 1st support level, which is at 156.75, and head towards the 1st resistance level at 158.50.
The 1st support at 156.75 is considered significant because it acts as a multi-swing low support.
Additionally, there is a 2nd support level at 155.82, which is also valuable due to its status as a multi-swing low support. It aligns with a 161.80% Fibonacci Extension level, adding to its importance.
On the resistance side, the 1st resistance level at 158.50 is considered important because it represents a multi-swing high resistance.
Moreover, there is a 2nd resistance level at 159.42, which holds importance as a pullback resistance in the chart analysis.
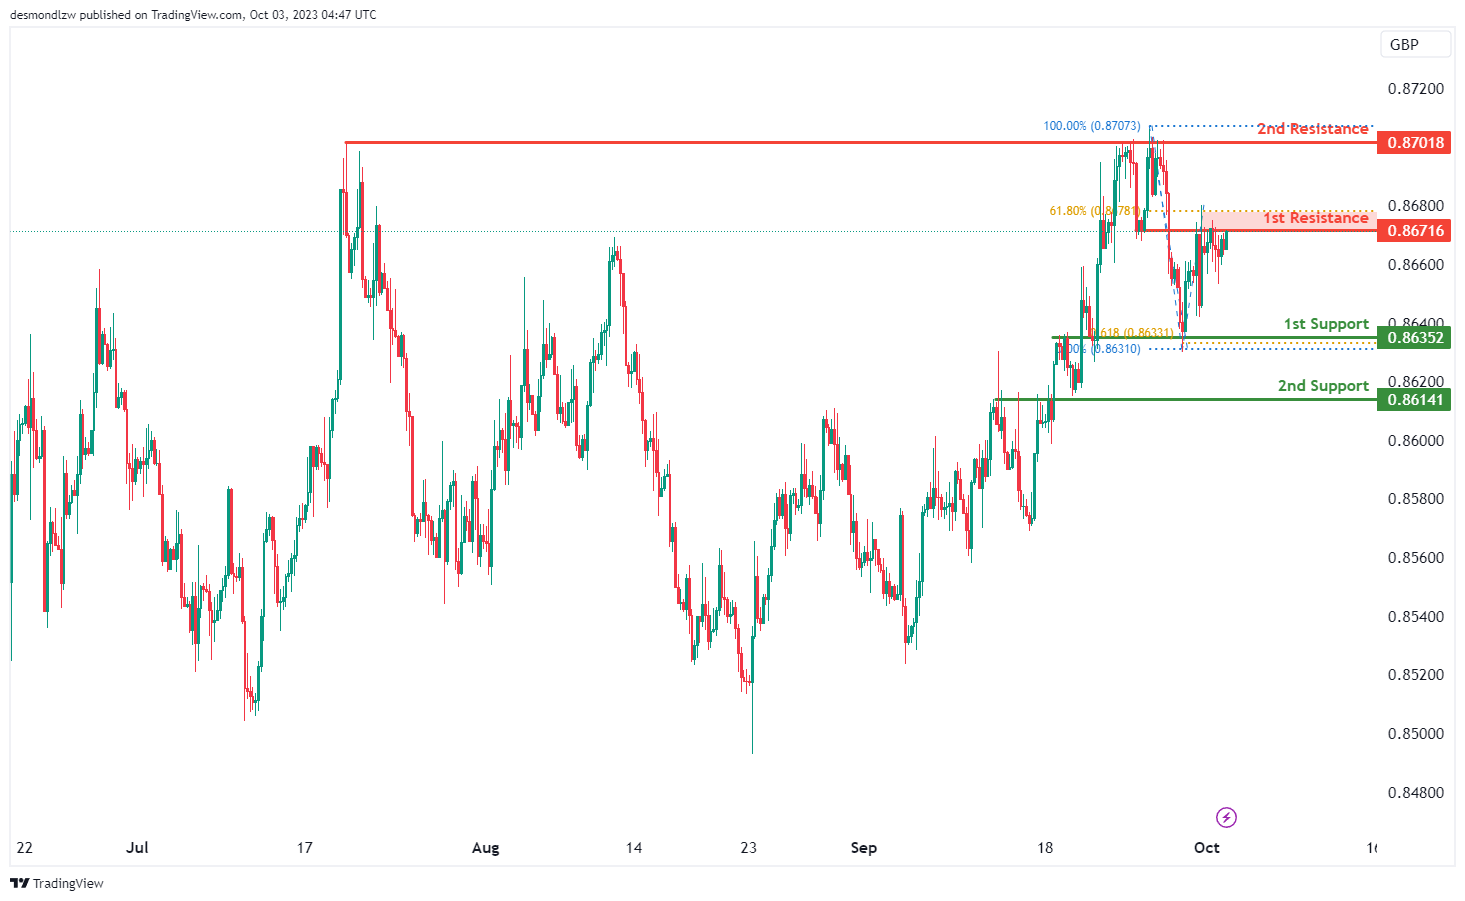
EUR/GBP:
The instrument being analyzed is EUR/GBP, and the current overall momentum of its chart is bearish.
There is a potential scenario where the price could make a bearish reaction off the 1st resistance level, which is at 0.8671, and subsequently drop to the 1st support level at 0.8635.
The 1st support at 0.8635 is considered significant because it acts as an overlap support and corresponds to a 61.80% Fibonacci Projection.
Additionally, there is a 2nd support level at 0.8614, which is also valuable due to its status as an overlap support.
On the resistance side, the 1st resistance level at 0.8671 is considered important because it represents an overlap resistance. Furthermore, this level aligns with a 61.80% Fibonacci Retracement, adding to its significance.
Moreover, there is a 2nd resistance level at 0.8701, which holds importance as a multi-swing high resistance in the chart analysis.
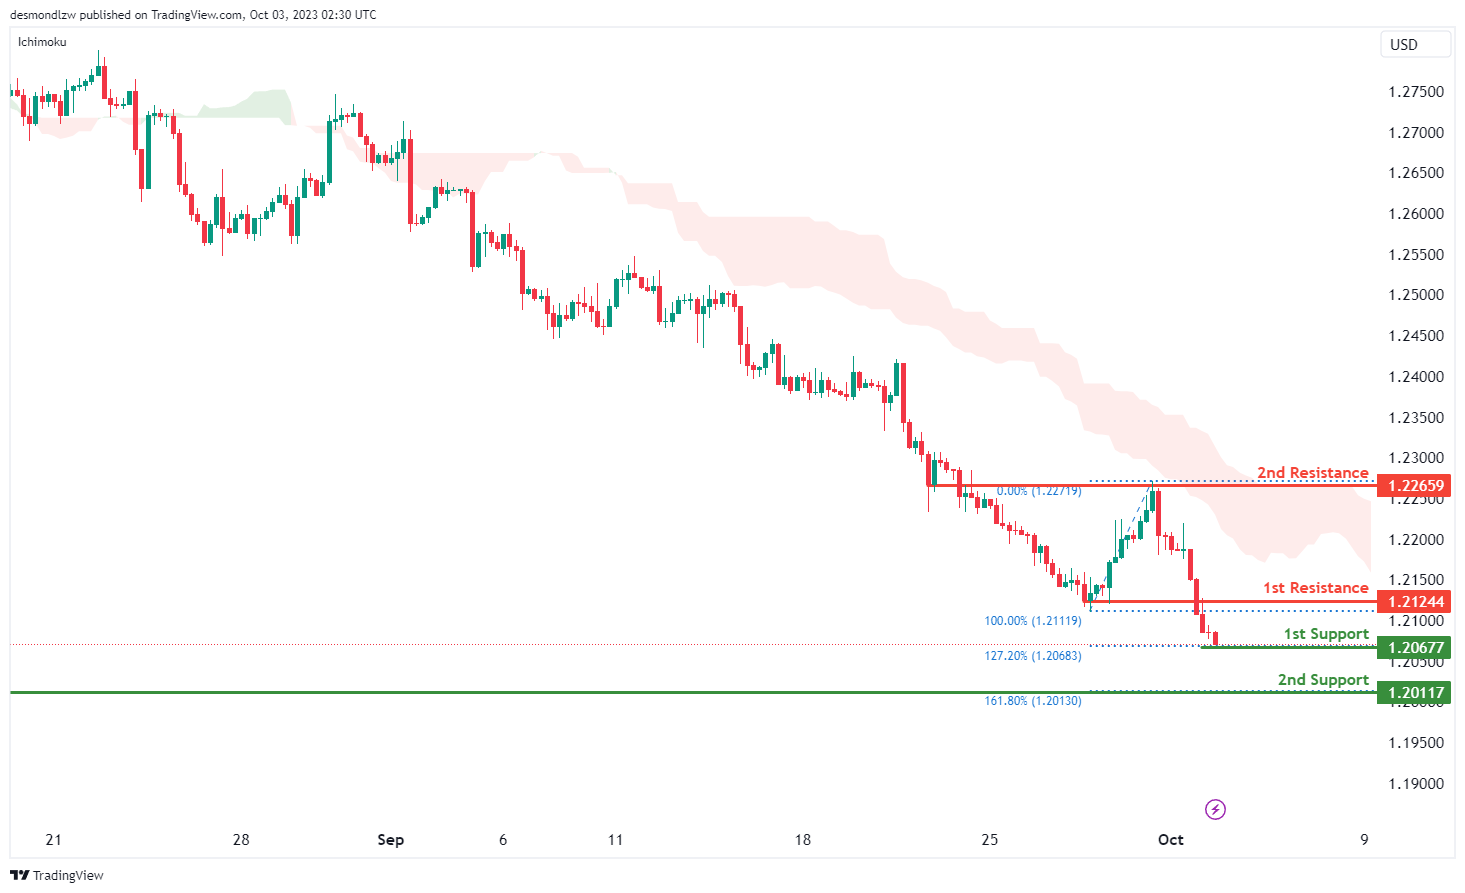
GBP/USD:
The GBP/USD chart currently maintains a bearish momentum, with factors contributing to this momentum being its position below the bearish Ichimoku cloud.
There is a potential scenario of a bullish bounce off the 1st support level at 1.2067, which is supported by the presence of the 127.20% Fibonacci Extension, indicating a possible reversal point. Additionally, the 2nd support at 1.2011 is identified as a swing low support and aligns with the 161.80% Fibonacci Extension, further emphasizing its significance.
On the resistance side, the 1st resistance level at 1.2124 is recognized as an overlap resistance, suggesting it may act as a barrier to bullish movements. Beyond this, the 2nd resistance at 1.2265 is also categorized as an overlap resistance,
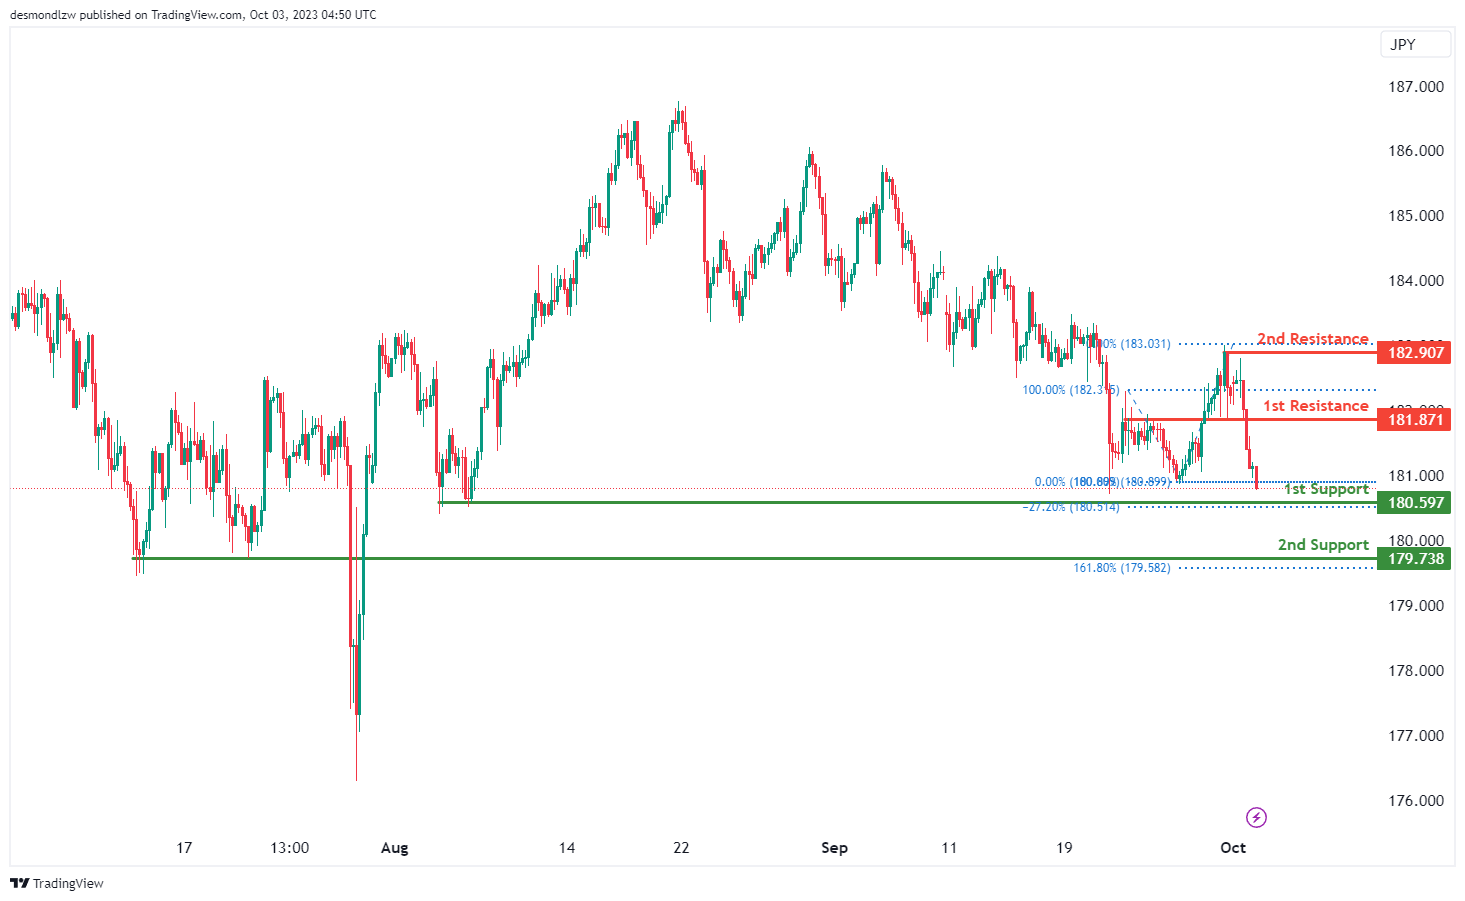
GBP/JPY:
The instrument being analyzed is GBP/JPY, and the current overall momentum of its chart is bullish.
There is a potential scenario where the price could drop further to the 1st support level, which is at 180.59, in the short term before bouncing from there and rising to the 1st resistance level at 181.87.
The 1st support at 180.59 is considered significant because it acts as a multi-swing low support and corresponds to a -27% Fibonacci Expansion.
Additionally, there is a 2nd support level at 179.73, which is also valuable as it functions as a pullback support and aligns with a 161.80% Fibonacci Extension.
On the resistance side, the 1st resistance level at 181.87 is considered important because it represents a pullback resistance.
Moreover, there is a 2nd resistance level at 182.90, which holds significance as a swing high resistance in the chart analysis.
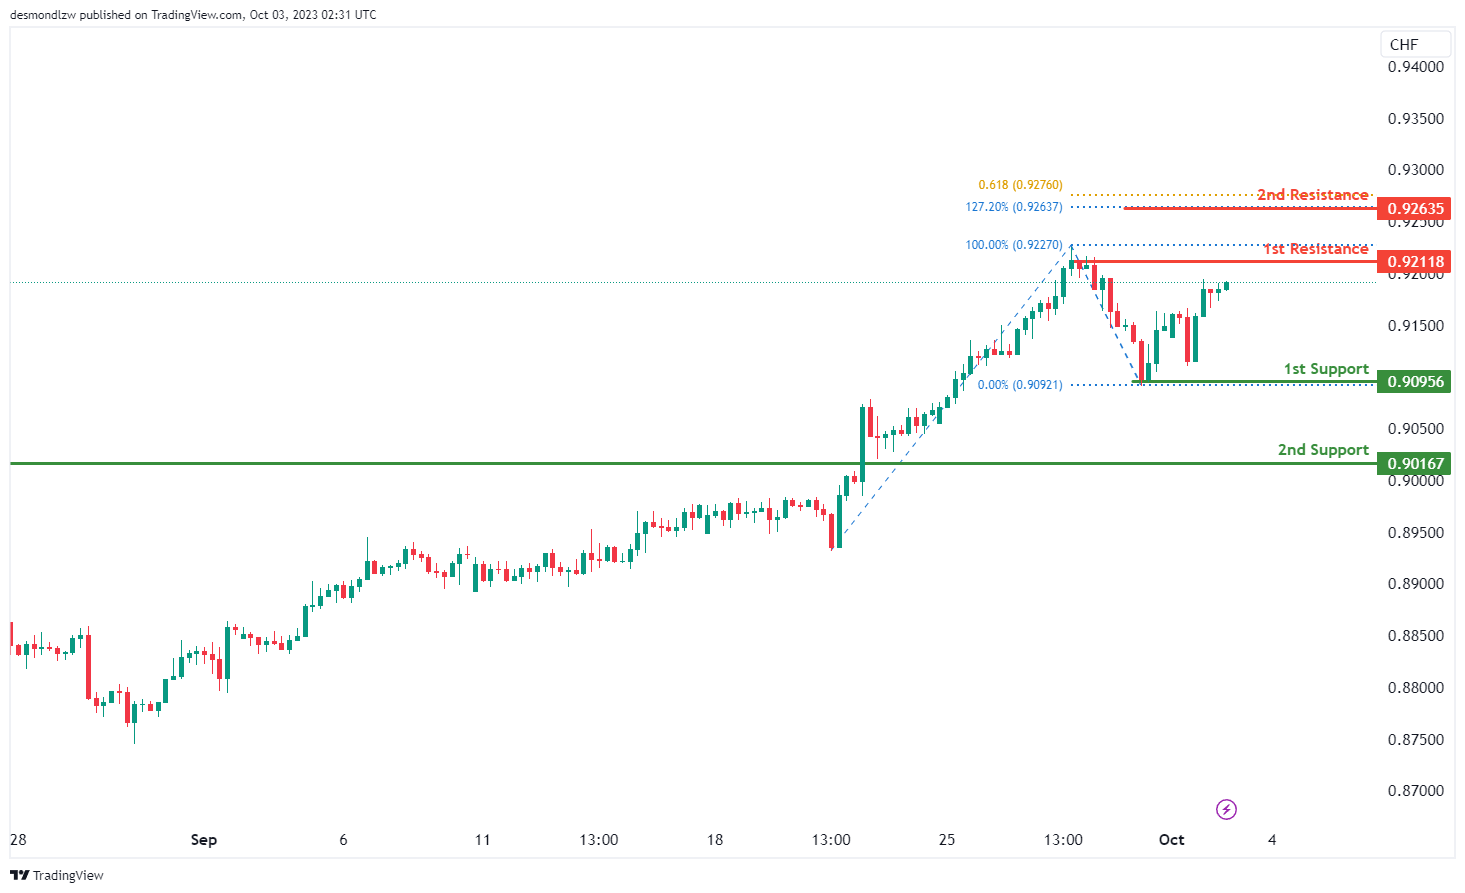
USD/CHF:
The USD/CHF chart currently exhibits a bullish momentum.
There’s a potential scenario of a bullish continuation towards the 1st resistance level at 0.9211. The 1st support at 0.9095 is identified as a swing low support, indicating a potential level where the price might find support. Additionally, the 2nd support at 0.9016 is categorized as a pullback support, further strengthening its significance.
On the resistance side, the 1st resistance level at 0.9211 is recognized as a swing high resistance and marks a potential point where the price could face resistance initially. Beyond this, the 2nd resistance at 0.9263 is notable for the convergence of the 161.80% Fibonacci Extension and the 61.80% Fibonacci Retracement, indicating a Fibonacci confluence and underscoring its importance as a potential resistance zone.
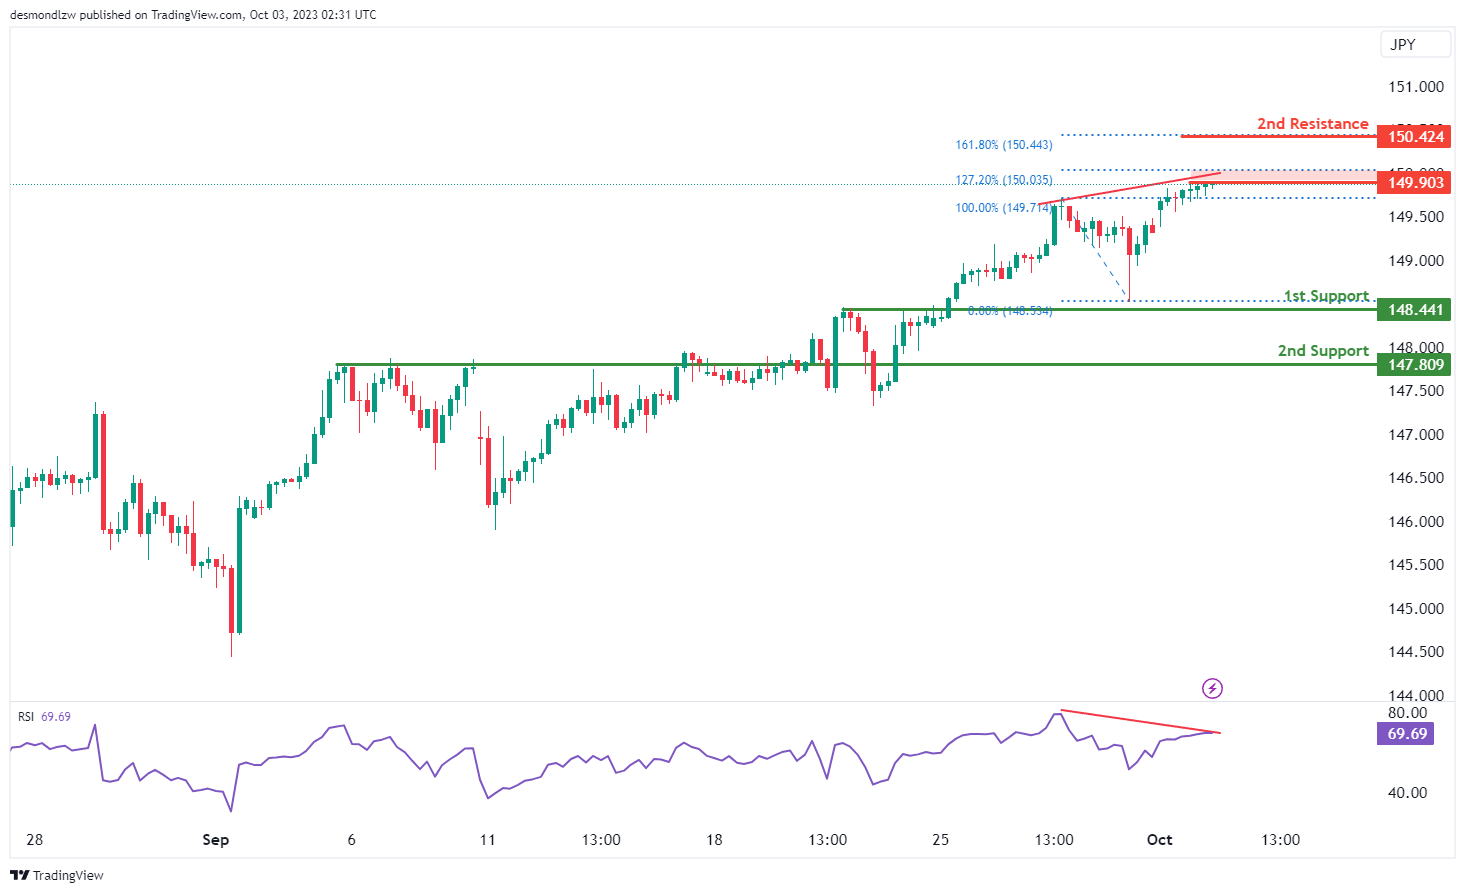
USD/JPY:
The USD/JPY chart currently has a bullish momentum, but there’s a potential scenario of a short-term drop to the 1st support level at 148.44 before bouncing and rising towards the 1st resistance.
The 1st support at 148.44 is identified as an overlap support, making it a significant level for potential price support. Additionally, the 2nd support at 147.80 is categorized as a pullback support, further reinforcing its importance as a potential level where the price might find support.
On the resistance side, the 1st resistance level at 149.90 is crucial, with the presence of the 127.20% Fibonacci Extension, indicating its significance as a potential resistance zone. Beyond this, the 2nd resistance at 150.42 is marked by the 161.80% Fibonacci Extension, further underlining its importance as a potential barrier to upward movements in the price.
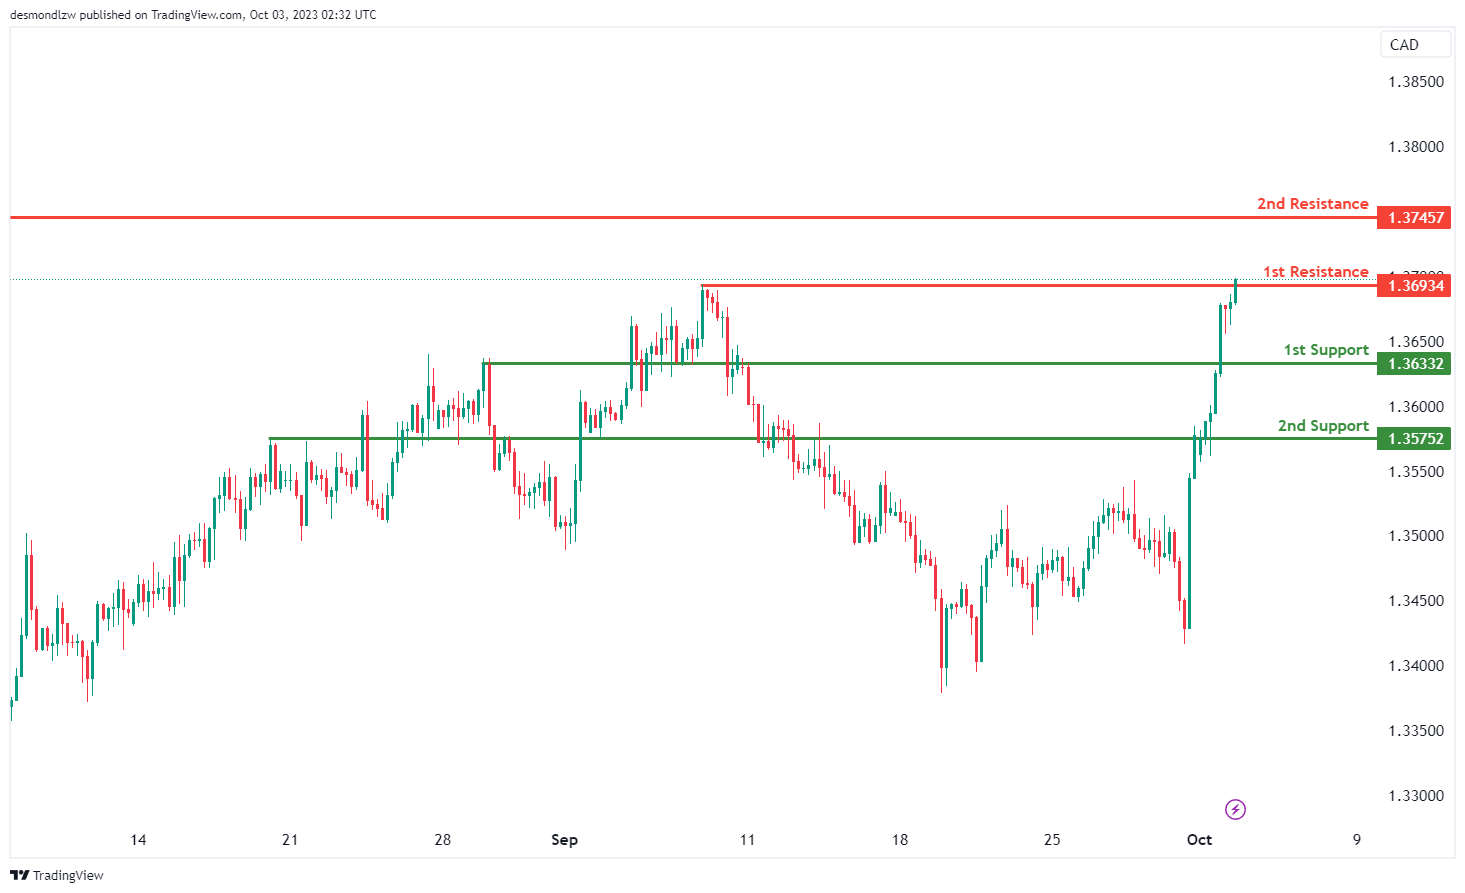
USD/CAD:
The USD/CAD chart currently has a bearish momentum, and there is a potential scenario of a bearish reaction off the 1st resistance level, leading to a drop towards the 1st support.
The 1st support at 1.3633 is considered a good support level, characterized as a pullback support. Additionally, the 2nd support at 1.3575 is identified as an overlap support, which offers another potential zone where the price might find necessary support.
On the resistance side, the 1st resistance level at 1.3693 is crucial, being a swing high resistance. Beyond this, the 2nd resistance level at 1.3745 also serves as a swing high resistance, representing a barrier for potential upward movements in the price.
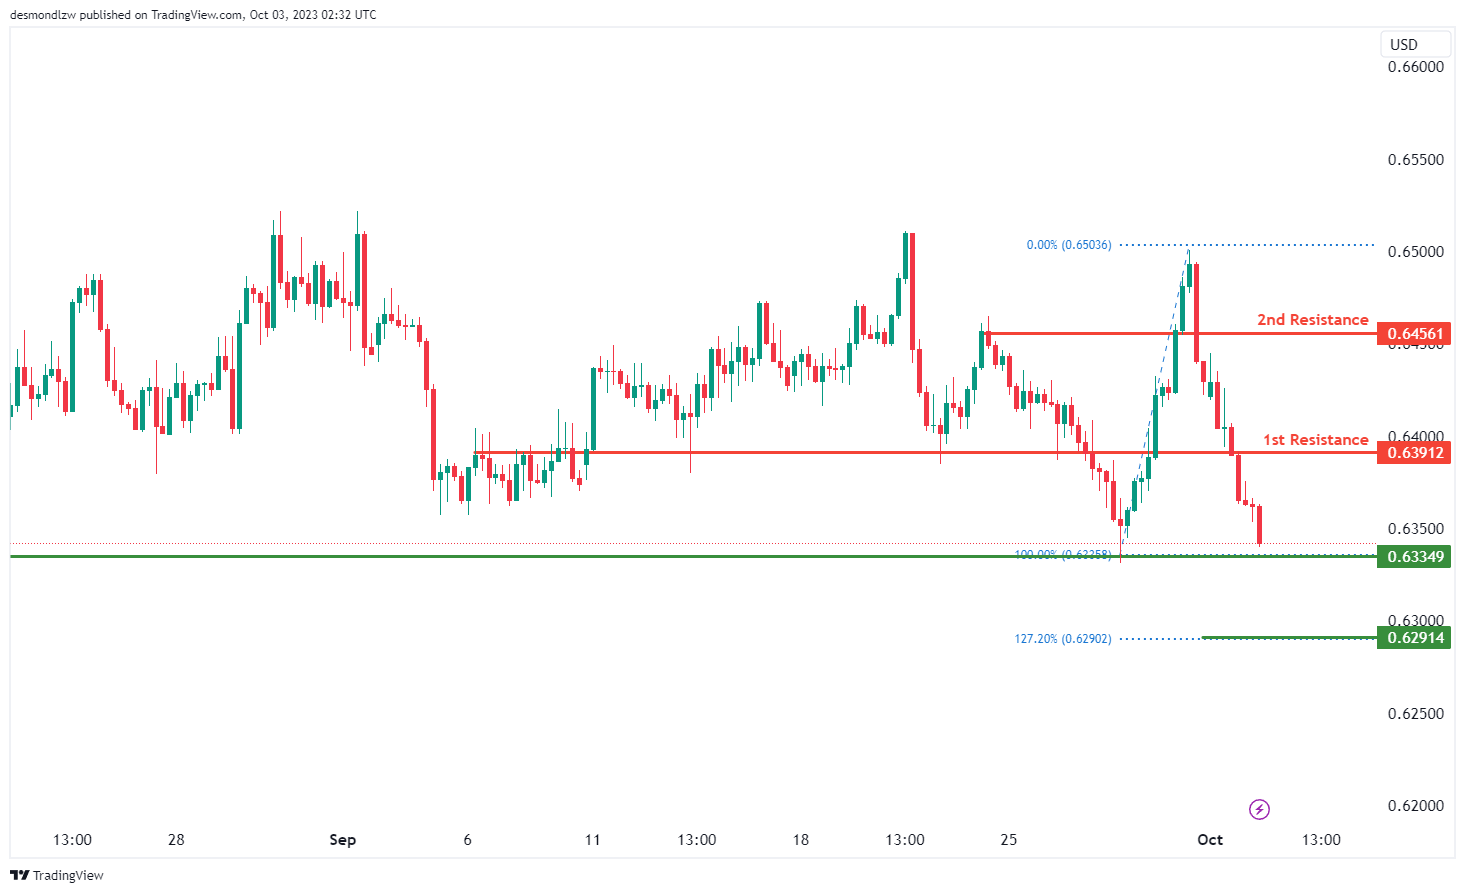
AUD/USD:
The AUD/USD chart currently has a bearish momentum, but there is a potential scenario of a bullish bounce off the 1st support level, heading towards the 1st resistance.
The 1st support at 0.6334 is considered significant as it is a swing low support level. Additionally, the 2nd support at 0.6291 is identified as a level where the price aligns with the 127.20% Fibonacci Retracement, which enhances its role as a key support level.
On the resistance side, the 1st resistance level at 0.6387 is categorized as a pullback resistance, which might initially limit upward movements. Beyond this, the 2nd resistance at 0.6456 also serves as a pullback resistance
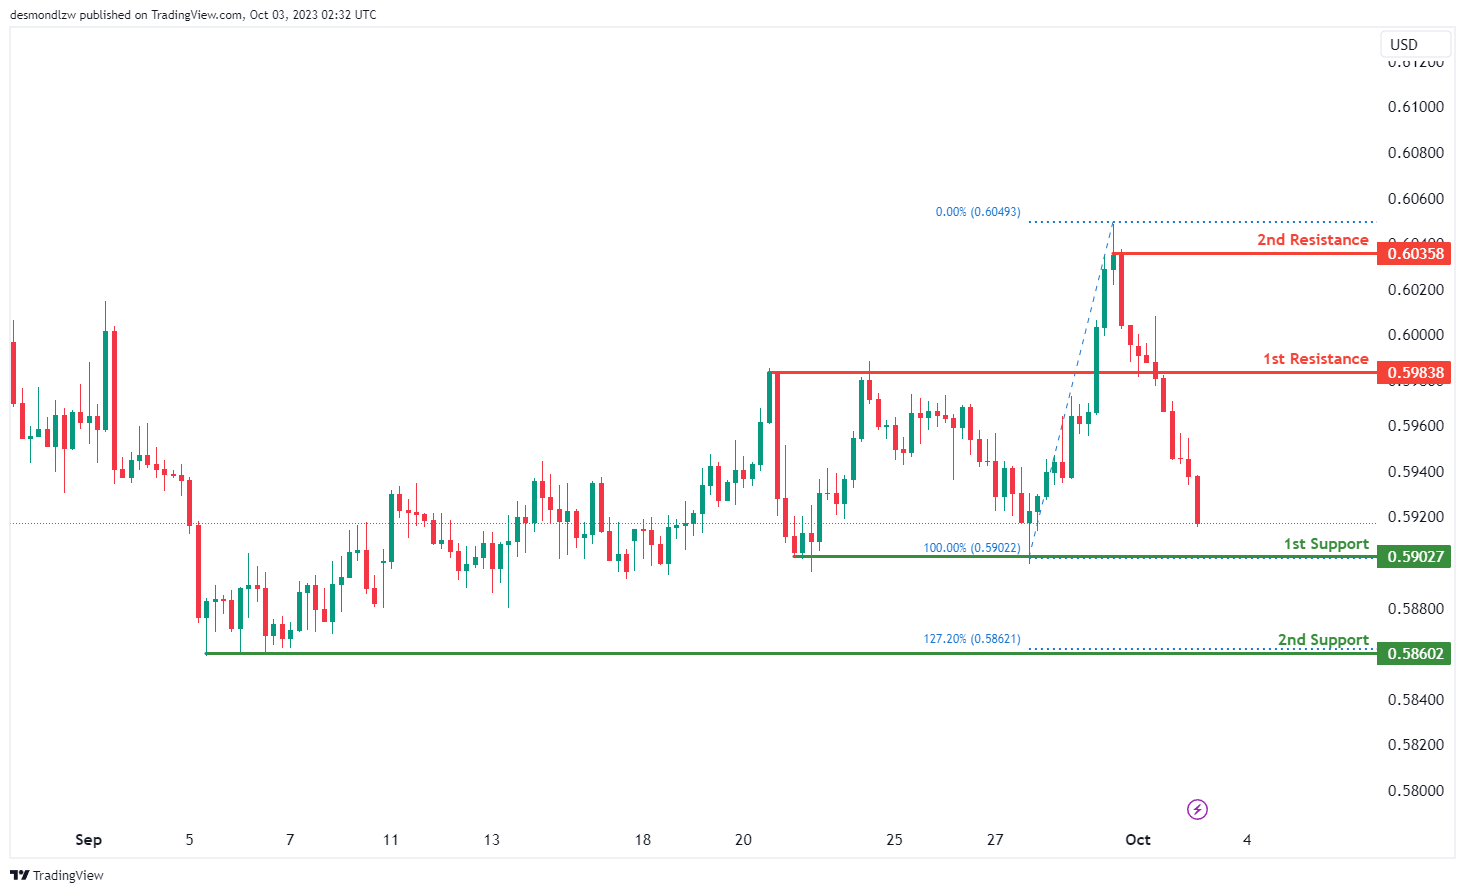
NZD/USD
The NZD/USD chart is currently exhibiting a bearish momentum, and there’s a potential scenario of a bearish continuation towards the 1st support level.
The 1st support at 0.5902 is considered significant as it is a multi-swing low support level. Additionally, the 2nd support at 0.5860 is identified as a multi-swing low support and is further reinforced by the presence of the 127.20% Fibonacci Extension, making it an important level for potential price support.
On the resistance side, the 1st resistance level at 0.5983 is marked as a pullback resistance, which might initially limit upward movements. Beyond this, the 2nd resistance at 0.6035 is identified as a swing high resistance, representing another potential barrier to bullish advancements in the price.
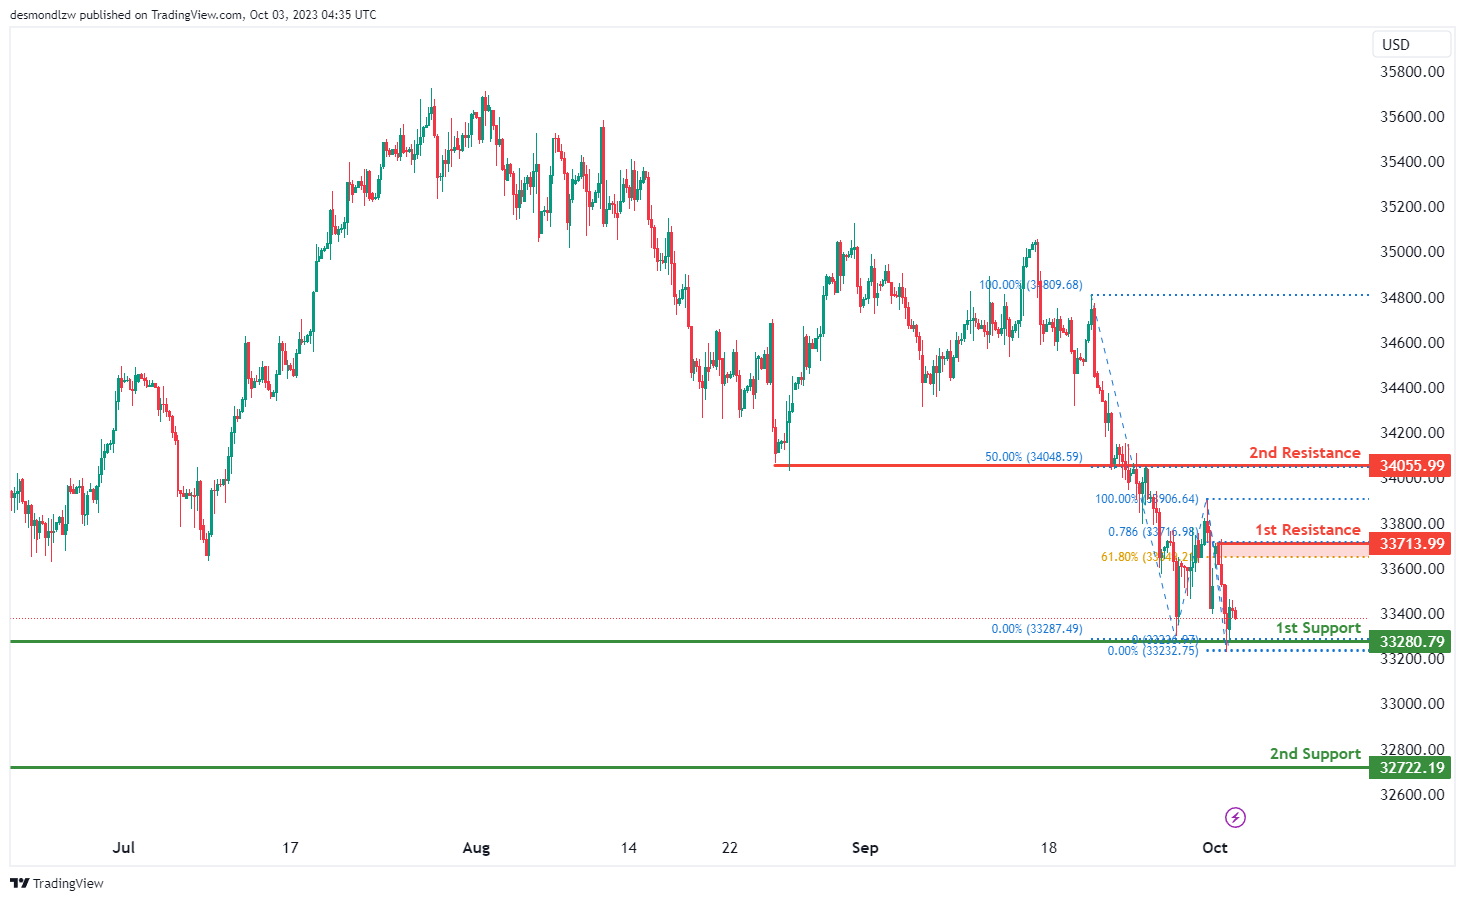
DJ30:
The instrument being analyzed is DJ30, and the current overall momentum of its chart is bullish.
There is a potential scenario where the price could make a bullish bounce off the 1st support level, which is at 33280.79, and head towards the 1st resistance level at 33713.99.
The 1st support at 33280.79 is considered significant because it acts as an overlap support.
Additionally, there is a 2nd support level at 32722.19, which is also valuable as it functions as a swing low support.
On the resistance side, the 1st resistance level at 33713.99 is considered important because it represents a swing high resistance. Furthermore, this level aligns with both a 61.80% Fibonacci Retracement and a 78.60% Fibonacci Projection, indicating Fibonacci confluence and adding to its significance.
Moreover, there is a 2nd resistance level at 34055.99, which is deemed important as it represents an overlap resistance and corresponds to a 50% Fibonacci Retracement, contributing to its significance in the analysis.
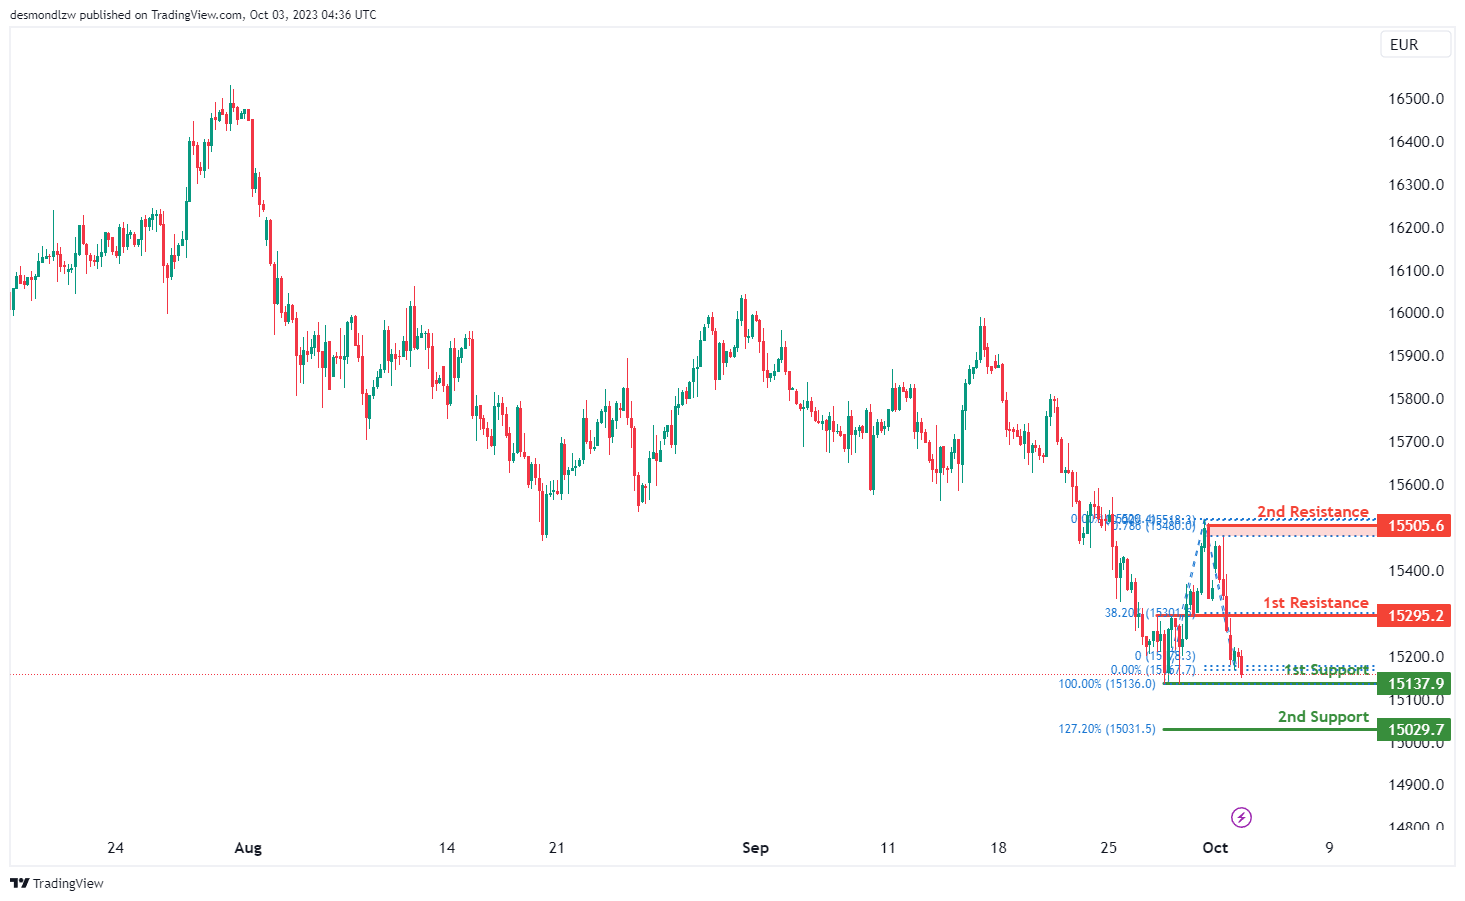
GER40:
The instrument being analyzed is GER40, and the current overall momentum of its chart is bullish.
There is a potential scenario where the price could make a bullish bounce off the 1st support level, which is at 15137.90, and head towards the 1st resistance level at 15295.20.
The 1st support at 15137.90 is considered significant because it acts as a multi-swing low support.
In addition, there is a 2nd support level at 15029.70, which is also notable due to its status as a 127.20% Fibonacci Extension.
On the resistance side, the 1st resistance level at 15295.20 is considered important because it represents a pullback resistance. Furthermore, this level corresponds to a 38.20% Fibonacci Retracement, adding to its significance.
Moreover, there is a 2nd resistance level at 15505.60, which holds importance as a swing high resistance. This level aligns with a 78.60% Fibonacci Projection, contributing to its significance in the analysis.
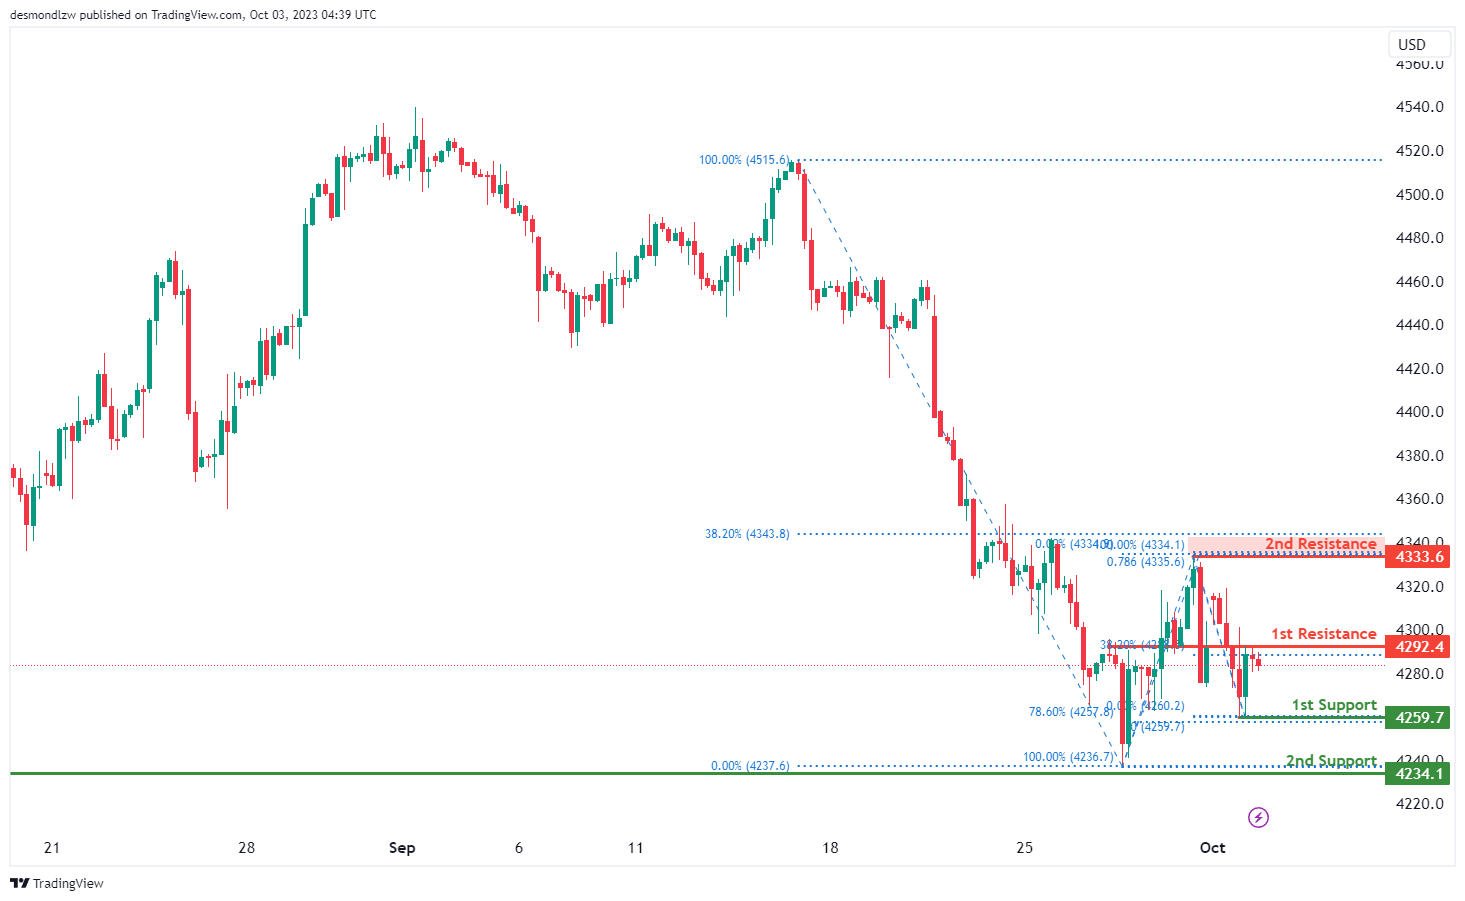
US500
The instrument being analyzed is US500, and the current overall momentum of its chart is bearish. Several factors contribute to this bearish momentum.
There is a potential scenario where the price could make a bearish reaction off the 1st resistance level, which is at 4292.4, and subsequently drop to the 1st support level at 4259.7.
The 1st support at 4259.7 is considered significant because it acts as a swing low support and corresponds to a 78.60% Fibonacci Retracement level.
Additionally, there is a 2nd support level at 4234.1, which is also notable because it functions as an overlap support.
On the resistance side, the 1st resistance level at 4292.4 is considered important because it represents an overlap resistance. Furthermore, this level aligns with a 38.20% Fibonacci Retracement, adding to its significance.
Moreover, there is a 2nd resistance level at 4333.6, which holds importance as a swing high resistance. This level coincides with both a 78.60% Fibonacci Projection and a 38.20% Fibonacci Retracement, indicating Fibonacci confluence and further enhancing its significance in the analysis.
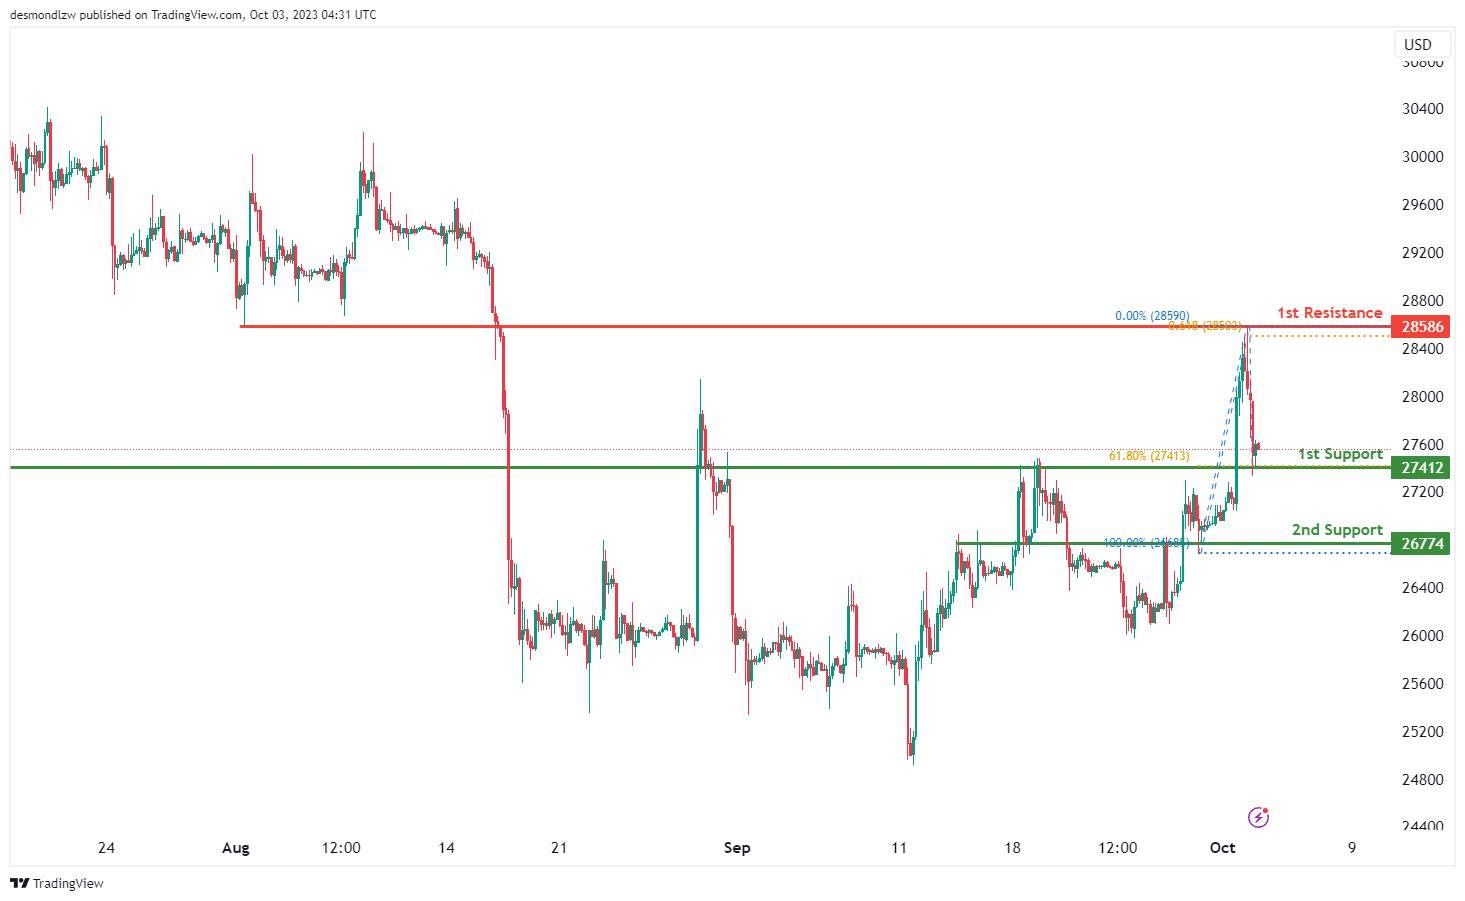
BTC/USD:
The instrument being analyzed is BTC/USD, and the current overall momentum of its chart is bullish. Several factors contribute to this bullish momentum.
There is a potential scenario where the price could make a bullish bounce off the 1st support level, which is at 27412, and head towards the 1st resistance level at 28586.
The 1st support at 27412 is considered significant because it acts as an overlap support and coincides with a 61.80% Fibonacci Retracement level, adding to its importance in the analysis.
Additionally, there is a 2nd support level at 26774, which is also valuable as it functions as an overlap support.
On the resistance side, the 1st resistance level at 28586 is considered important because it represents an overlap resistance. Furthermore, this level aligns with a 61.80% Fibonacci Projection, contributing to its significance in the analysis.
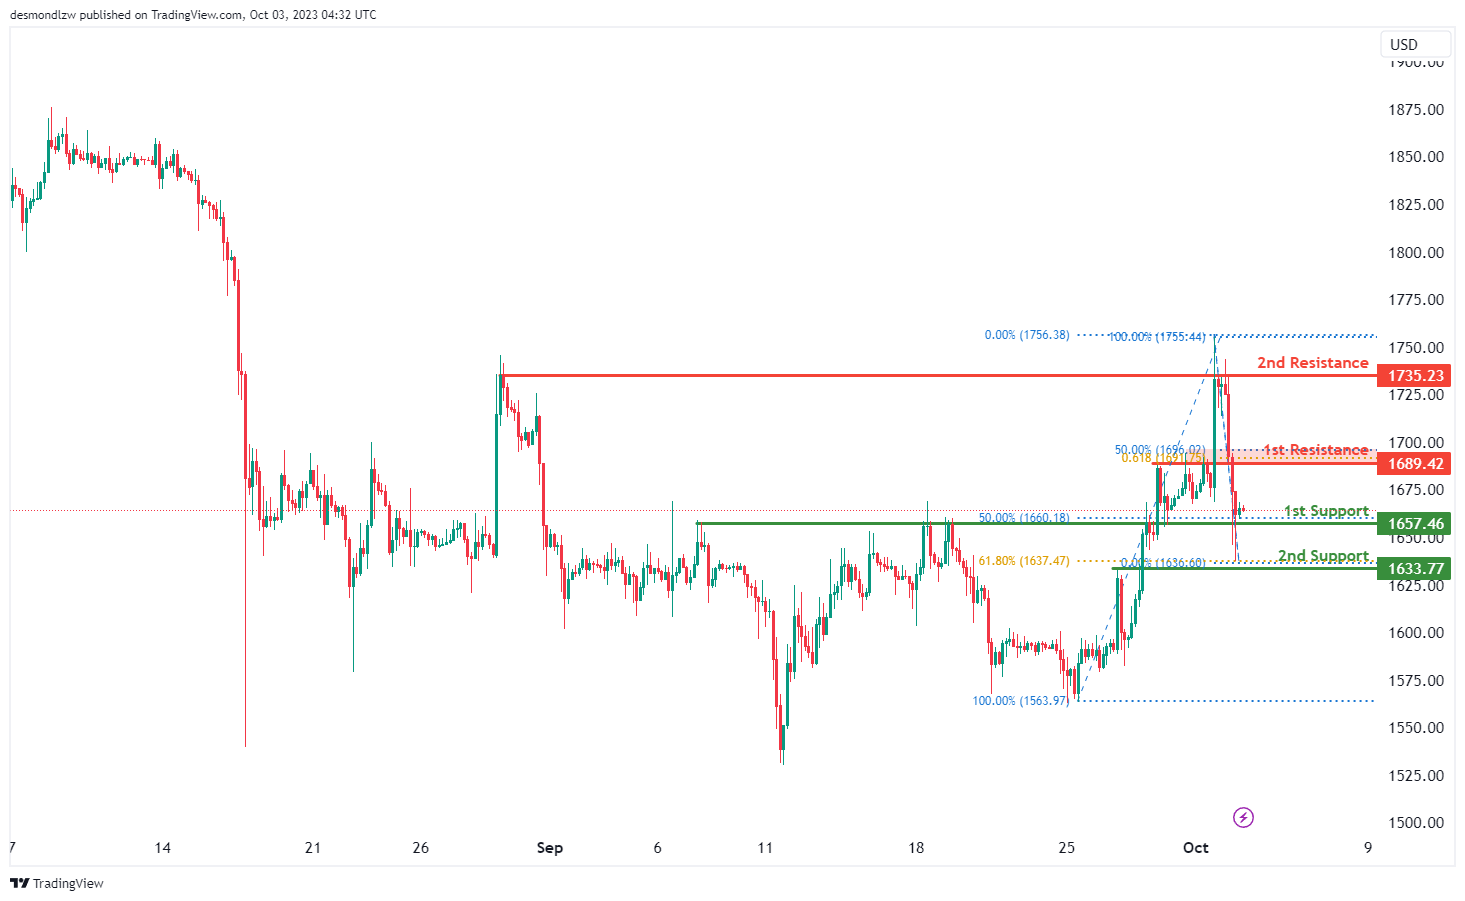
ETH/USD:
The instrument being analyzed is ETH/USD, and the current overall momentum of its chart is bullish.
There is a potential scenario where the price could make a bullish bounce off the 1st support level, which is at 1649.76, and head towards the 1st resistance level at 1689.42.
The 1st support at 1649.76 is considered significant because it acts as an overlap support and corresponds to a 50% Fibonacci Retracement level.
Additionally, there is a 2nd support level at 1633.77, which is also valuable as it functions as a pullback support and aligns with a 61.80% Fibonacci Retracement level.
On the resistance side, the 1st resistance level at 1689.42 is considered important because it represents a pullback resistance. Furthermore, this level coincides with both a 50% Fibonacci Retracement and a 61.80% Fibonacci Projection, indicating Fibonacci confluence and adding to its significance.
Moreover, there is a 2nd resistance level at 1735.23, which holds importance as a multi-swing high resistance in the chart analysis.
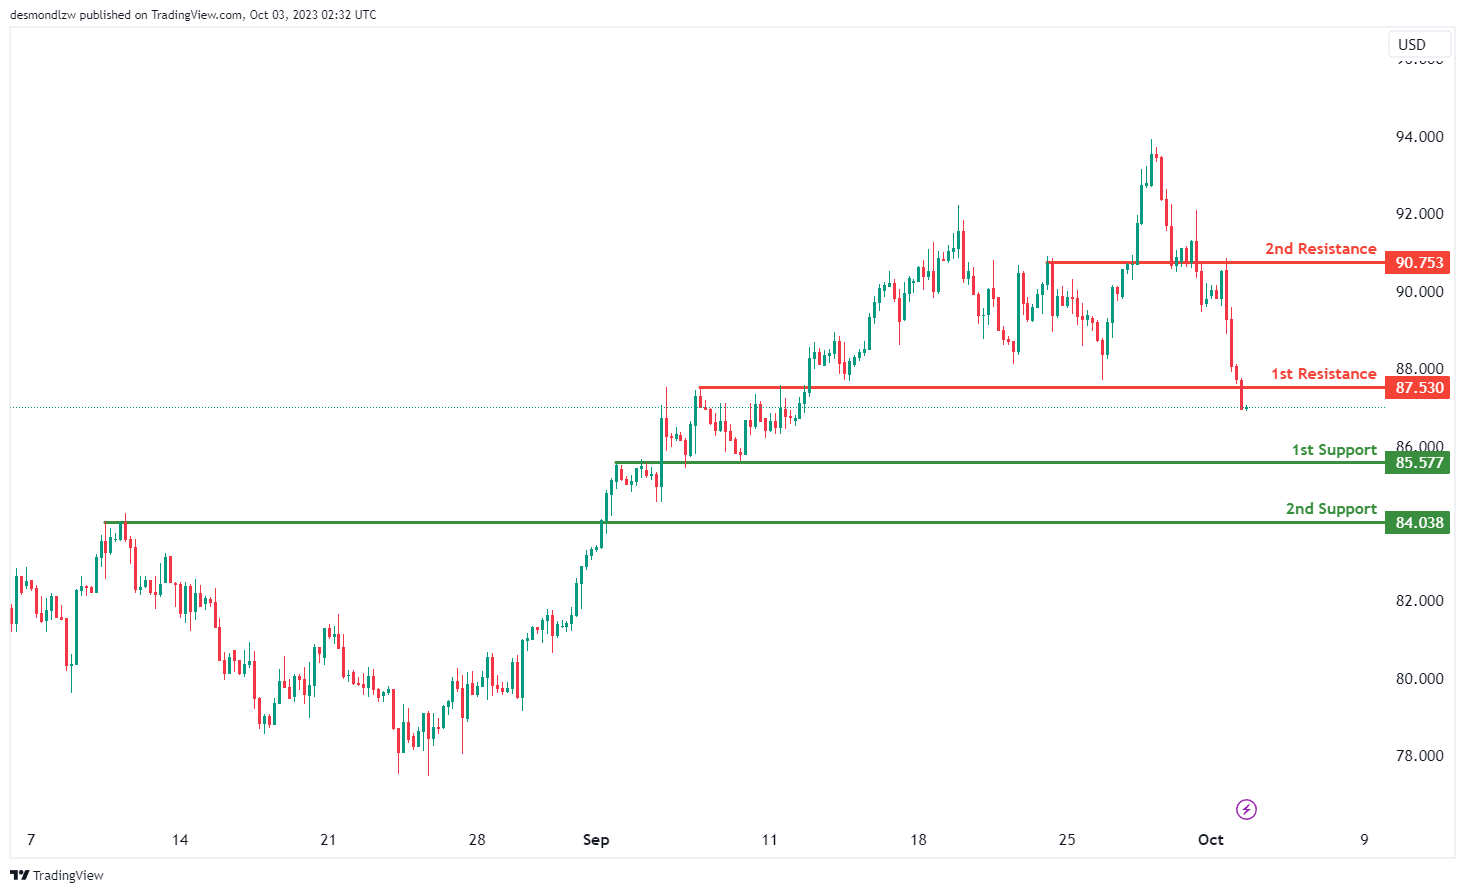
WTI/USD:
The WTI chart currently has a bearish momentum, and there’s a potential scenario of a bearish continuation towards the 1st support level.
The 1st support at 85.57 is considered significant as it’s identified as an overlap support, making it an important level where the price might find some support. Additionally, the 2nd support at 84.03 is categorized as a pullback support, further underpinning its role as a key level for potential price support.
On the resistance side, the 1st resistance level at 87.53 is marked as a pullback resistance, potentially limiting upward movements. Beyond this, the 2nd resistance at 90.75 is identified as an overlap resistance, representing another potential barrier to bullish advancements in the price.
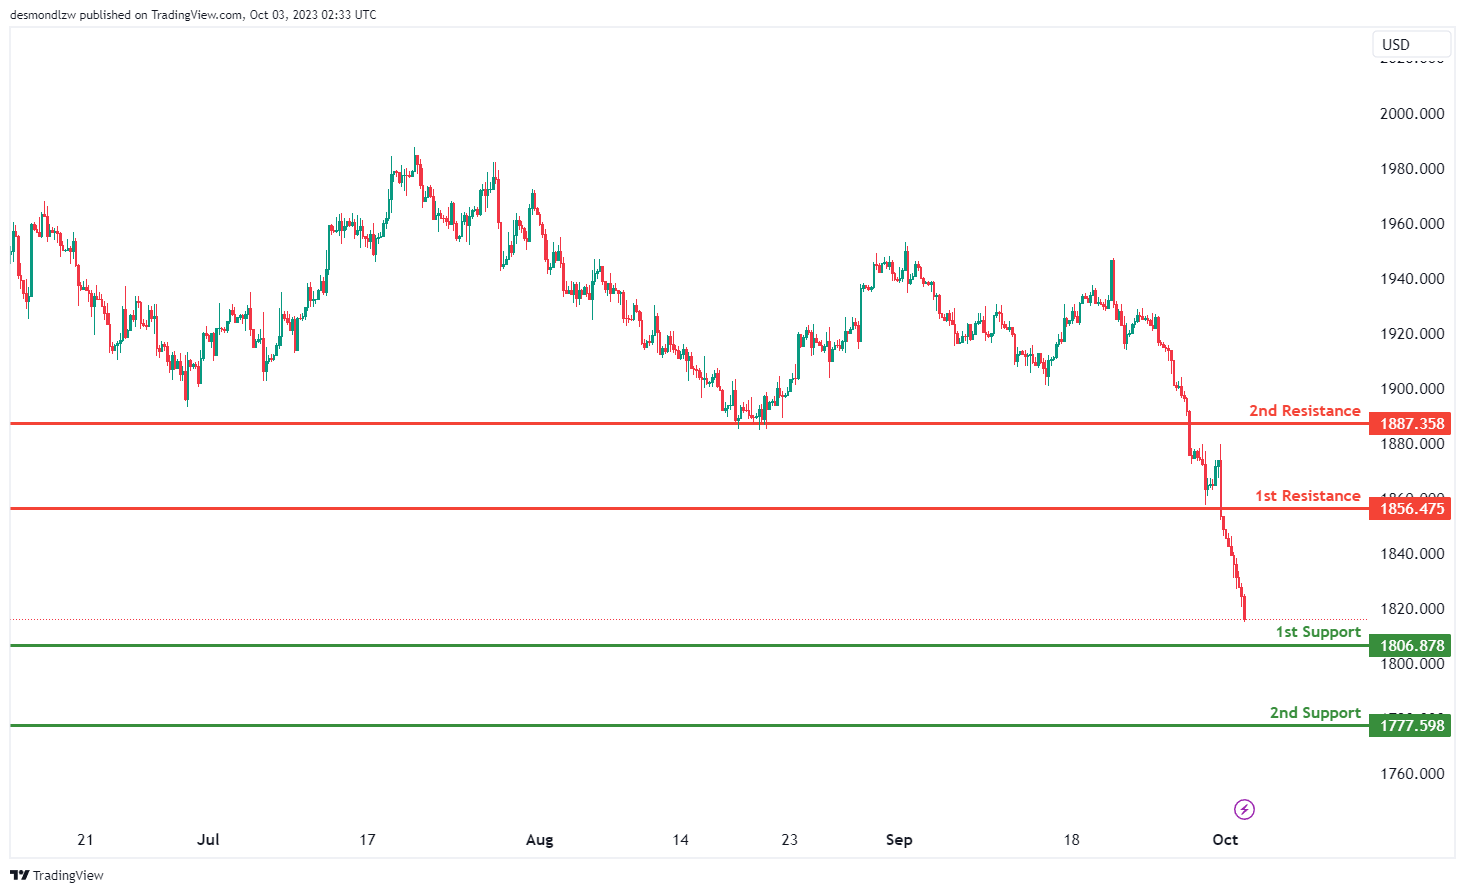
XAU/USD (GOLD):
The XAUUSD chart currently exhibits a bearish momentum, with a potential scenario of a bearish continuation towards the 1st support level.
The 1st support at 1806.00 is considered significant as it’s identified as an overlap support, making it a crucial level for potential price support. Furthermore, the 2nd support at 1777.59 is also categorized as an overlap support, reinforcing its importance as a potential zone where the price may find support.
On the resistance side, the 1st resistance level at 1856.47 is marked as a pullback resistance, potentially limiting upward movements. Beyond this, the 2nd resistance at 1887.35 is identified as a swing high resistance


