
DXY:
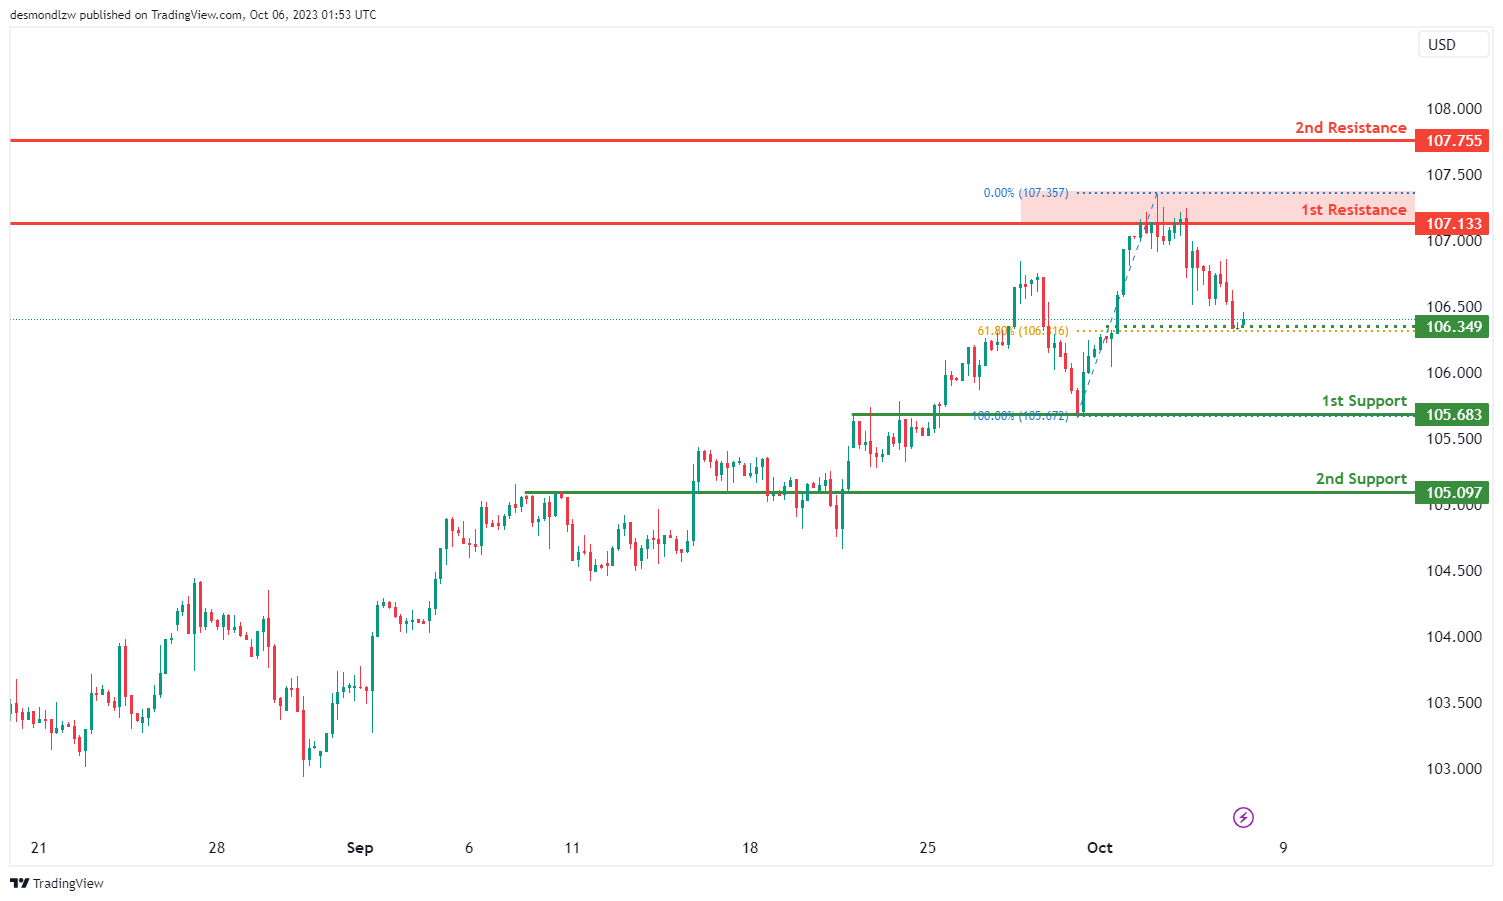
The DXY (US Dollar Index) chart currently maintains a bearish overall momentum, and there’s a potential scenario of a bearish continuation towards the 1st support level.
The 1st support at 105.68 is considered significant as it’s identified as an overlap support, making it an important level for potential price support. Additionally, the 2nd support at 105.09 is categorized as a pullback support, further reinforcing its significance as a potential area where price could find support.
On the resistance side, the 1st resistance level at 107.13 is recognized as a multi-swing high resistance, indicating its potential role as a barrier to upward movements. Beyond this, the 2nd resistance at 107.75 is identified as a swing high resistance.
Furthermore, there’s an intermediate support at 106.34, which is also considered a pullback support and is associated with the 61.80% Fibonacci Retracement level. This level adds another layer of potential support for price movements.
EUR/USD:
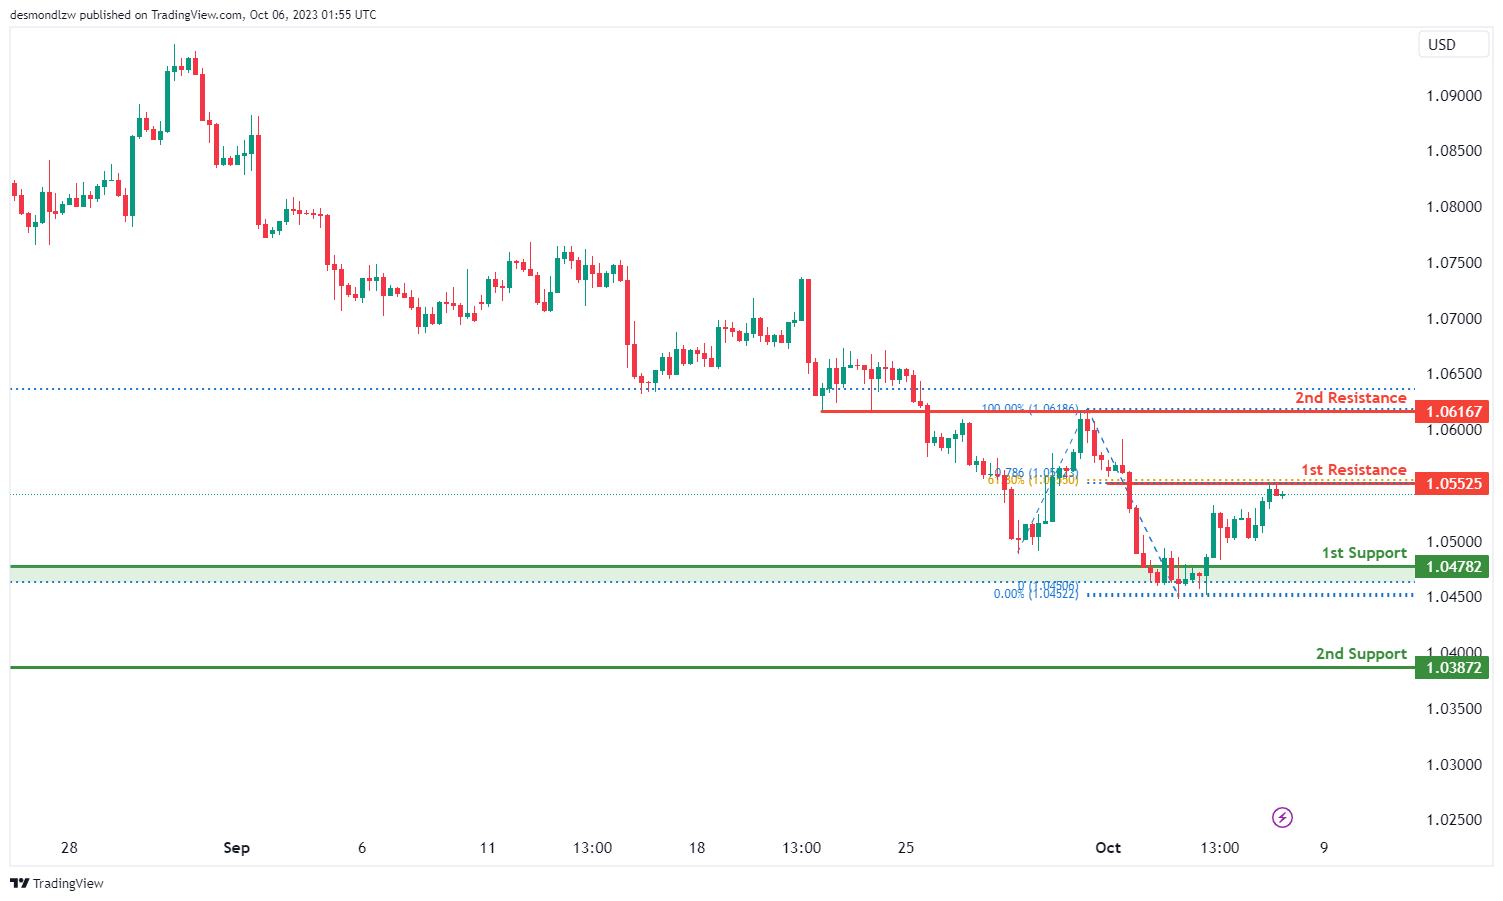
The EUR/USD chart currently maintains a bearish overall momentum, and there’s a potential scenario of a bearish reaction off the 1st resistance level, leading to a drop towards the 1st support.
The 1st support at 1.0478 is considered significant as it’s identified as a pullback support, making it an important level for potential price support. Additionally, the 2nd support at 1.0387 is categorized as a swing low support, further reinforcing its significance as a potential area where price could find support.
On the resistance side, the 1st resistance level at 1.0552 is recognized as a pullback resistance. It’s noteworthy that this level is associated with the confluence of the 61.80% Fibonacci Retracement and the 78.60% Fibonacci Projection, indicating strong Fibonacci confluence and suggesting it may act as a barrier to upward movements. Beyond this, the 2nd resistance at 1.0633 is identified as an overlap resistance.
EUR/JPY:
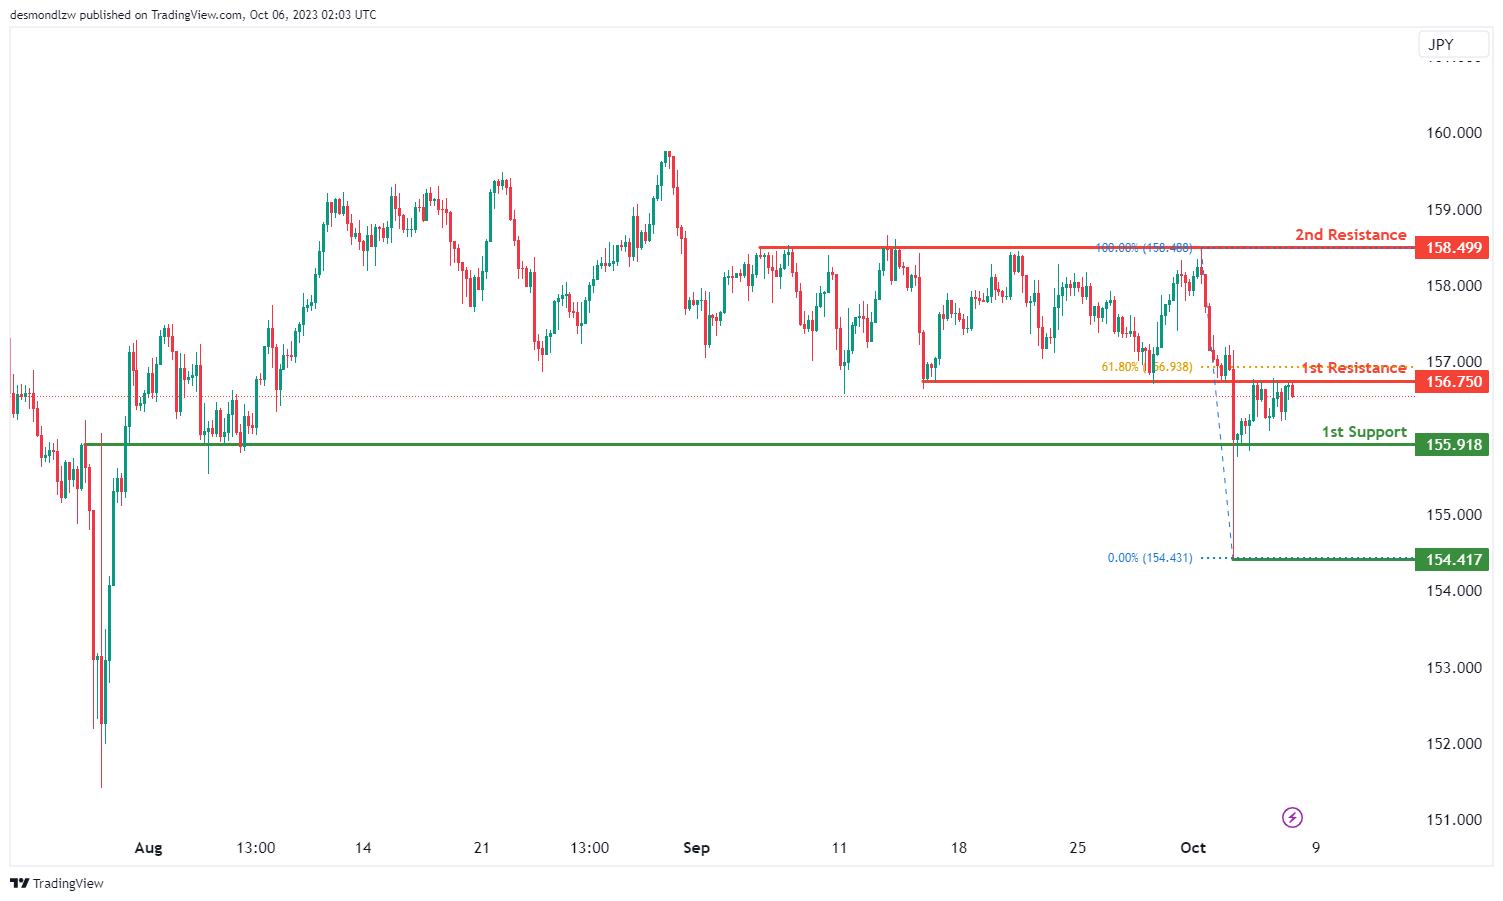
The EUR/JPY chart currently exhibits bearish momentum, suggesting the potential scenario of a bearish reaction off the 1st resistance level and a subsequent drop towards the 1st support level.
The 1st support at 155.91 is considered significant as it is identified as an overlap support, indicating a potential area where buying interest may arise. Additionally, the 2nd support at 154.41 is a swing low support, further reinforcing its importance as a potential level for price rebounds.
On the resistance side, the 1st resistance level at 156.75 is characterized as an overlap resistance and is accompanied by the presence of the 61.80% Fibonacci Retracement, suggesting it could act as a strong barrier to upward price movement. Beyond this, the 2nd resistance at 158.49 is identified as a multi-swing high resistance, adding to its significance as a potential area where selling pressure may emerge.
EUR/GBP:
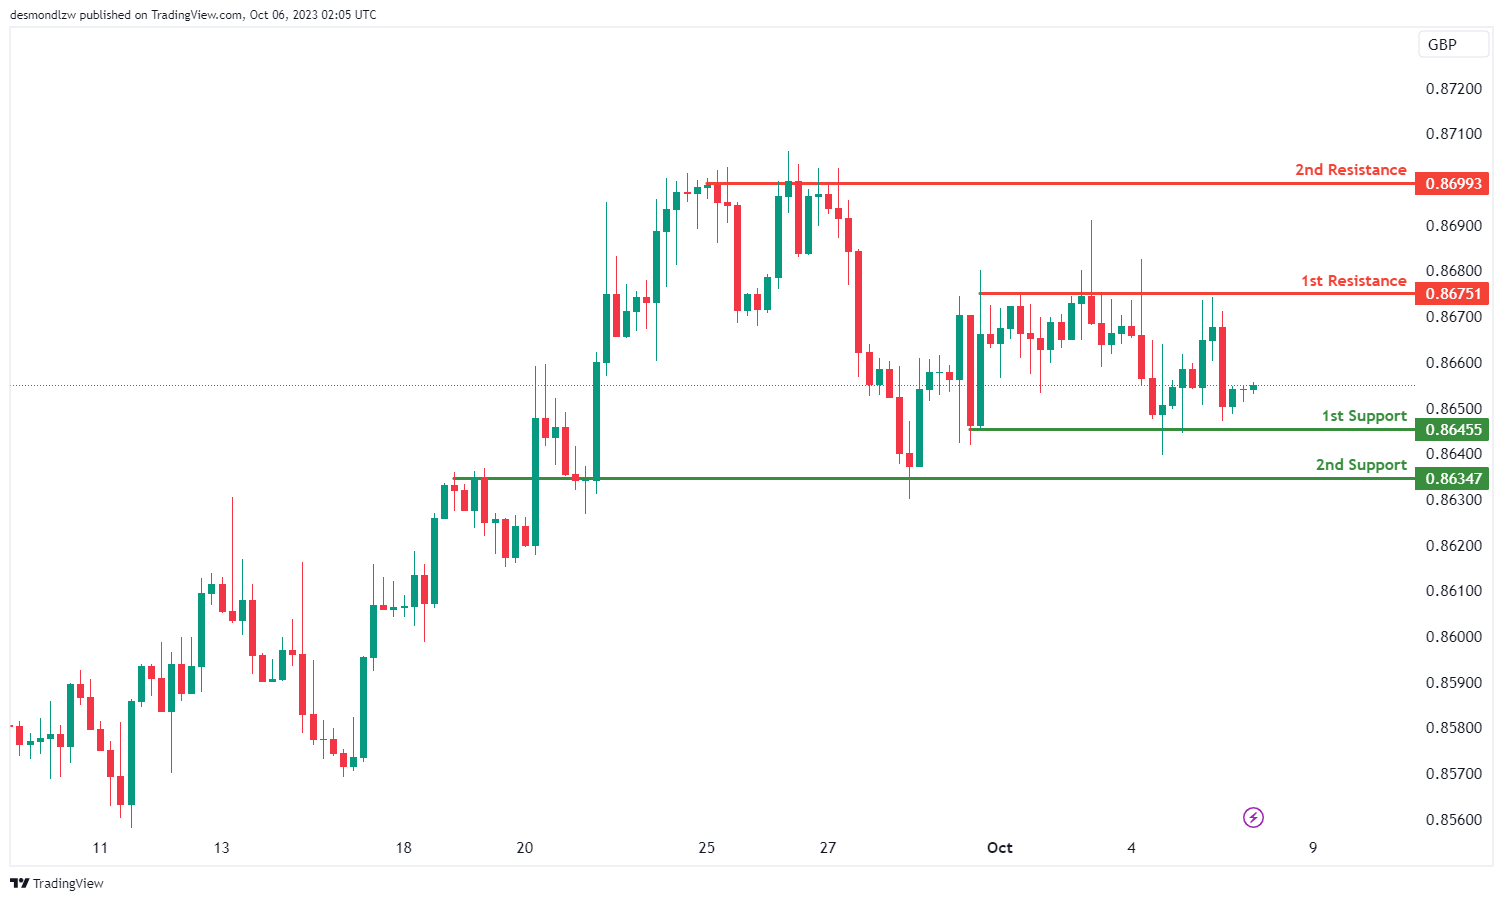
The EUR/GBP chart currently displays a bullish overall momentum, indicating the potential scenario of a bullish continuation towards the 1st resistance level.
The 1st support at 0.8646 is considered significant as it is identified as a multi-swing low support, suggesting it could act as a key level for potential price rebounds. Additionally, the 2nd support at 0.8635 is an overlap support, reinforcing its importance as a level where buying interest may emerge.
On the resistance side, the 1st resistance level at 0.8675 is characterized as a multi-swing high resistance, signifying a potential area where price might encounter selling pressure. Beyond this, the 2nd resistance at 0.8699 is also identified as a multi-swing high resistance, further supporting the idea of potential upward price movement.
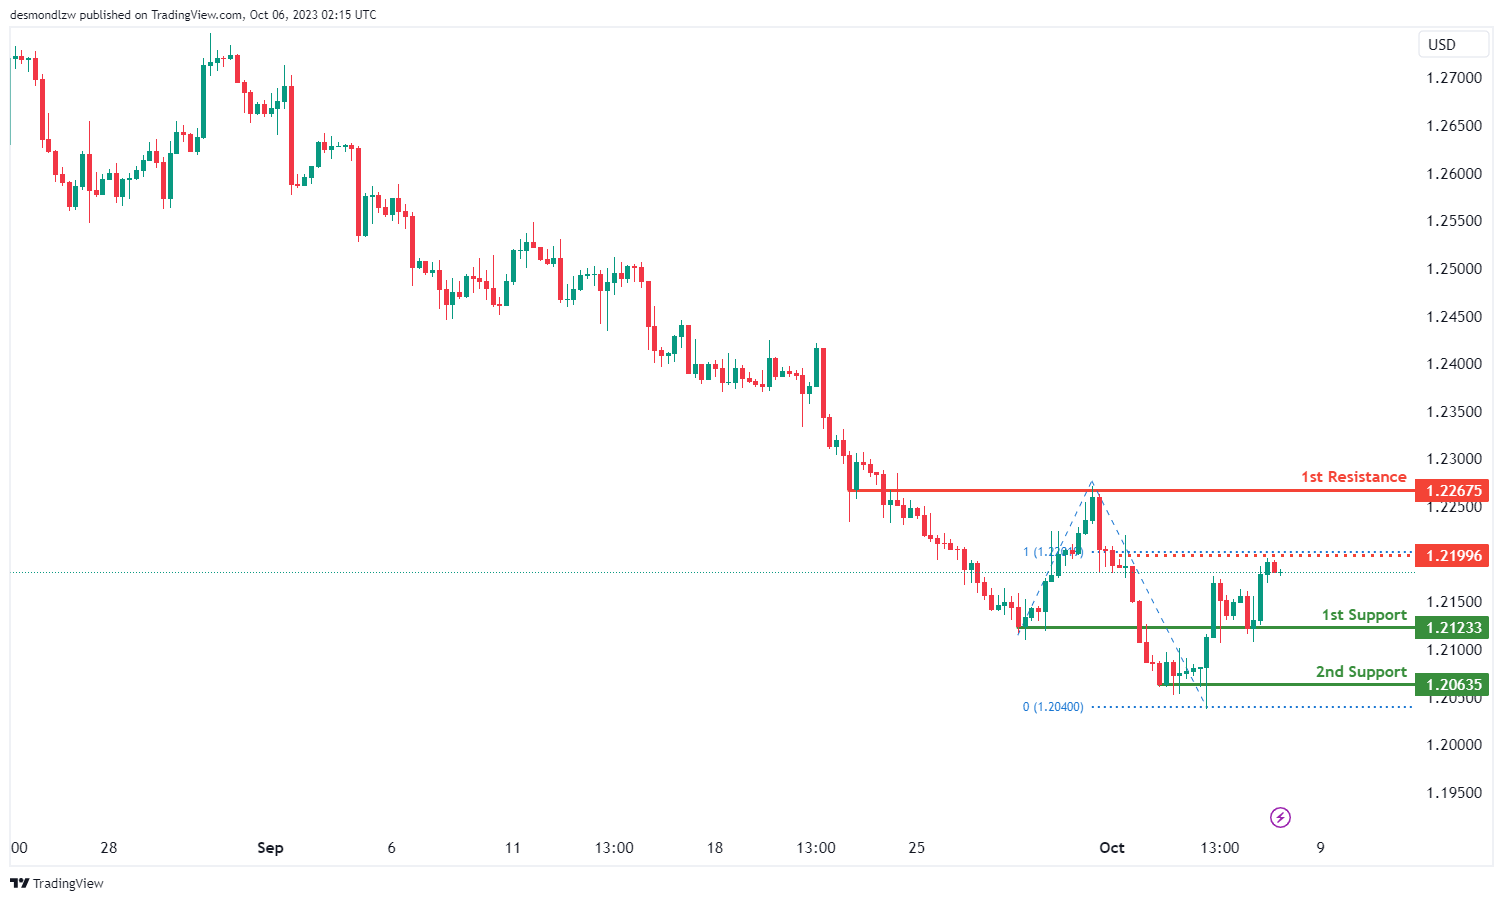
GBP/USD:
The GBP/USD chart currently exhibits a bullish overall momentum, and there’s a potential scenario of a bullish continuation towards the 1st resistance.
The 1st support at 1.2124 is considered significant as it’s identified as an overlap support, making it an important level for potential price support. Additionally, the 2nd support at 1.2067 is categorized as a multi-swing low support, further reinforcing its significance as a potential area where price could find support.
On the resistance side, the 1st resistance level at 1.2267 is recognized as an overlap resistance. It’s noteworthy that this level is associated with the 78.60% Fibonacci Projection, suggesting it may act as a barrier to upward movements. Beyond this, there’s an intermediate resistance at 1.2199, which aligns with the 78.60% Fibonacci Projection as well.
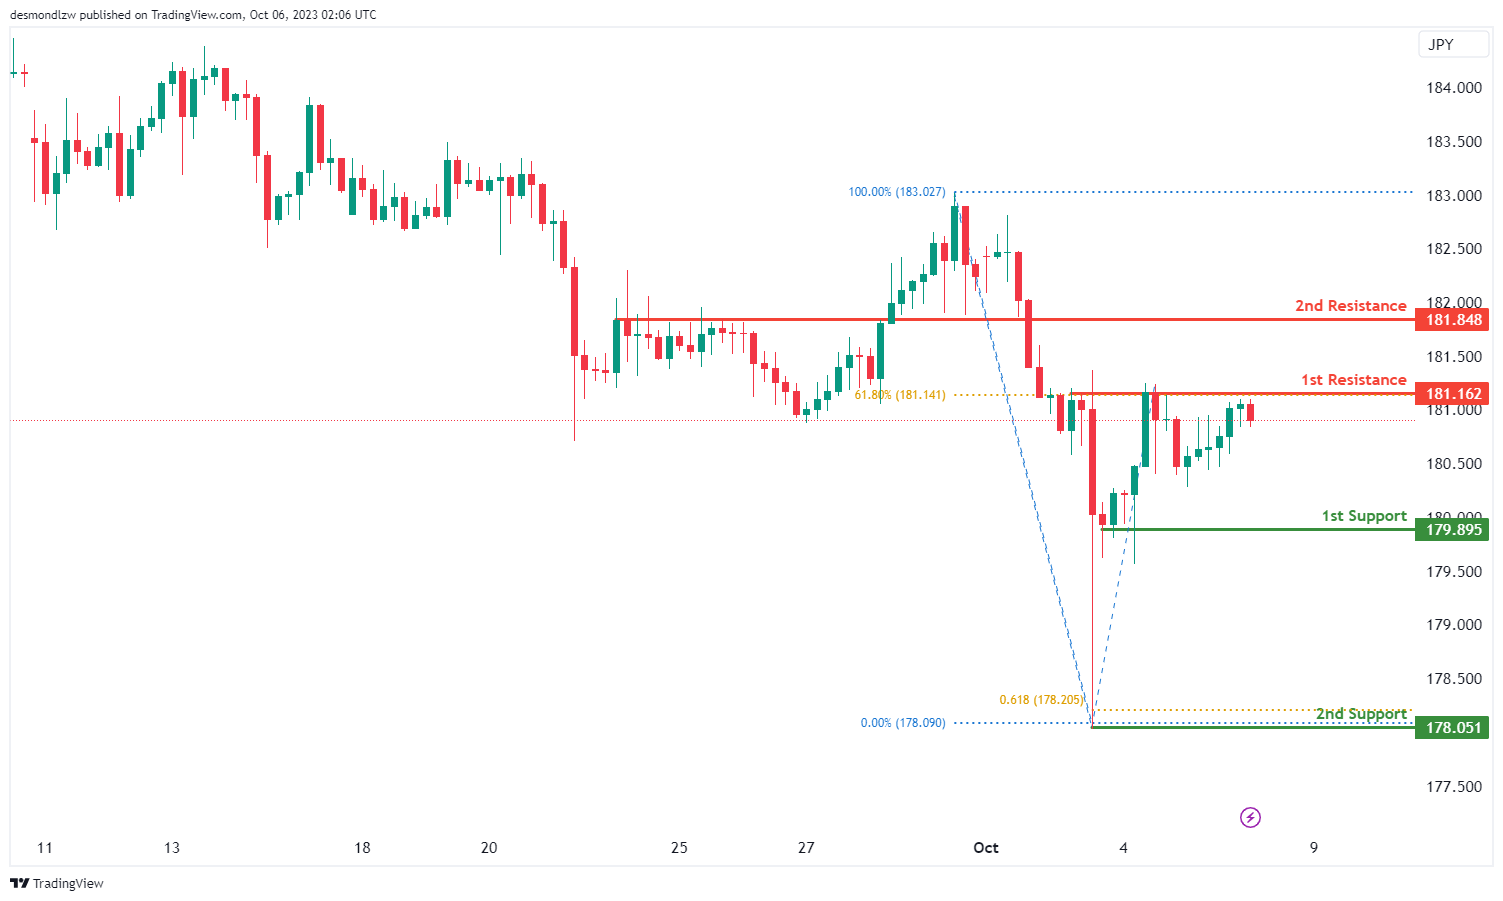
GBP/JPY:
The GBP/JPY chart currently exhibits a bearish overall momentum, suggesting the potential scenario of a bearish reaction off the 1st resistance level with a subsequent drop towards the 1st support.
The 1st support at 179.89 is considered significant as it is identified as a multi-swing low support, indicating its potential role as a key level for potential price rebounds. Additionally, the 2nd support at 178.05 is a swing low support and is further reinforced by the presence of the 61.80% Fibonacci Projection, making it a notable support level.
On the resistance side, the 1st resistance level at 181.16 is characterized as a multi-swing high resistance, marked by the 61.80% Fibonacci Retracement level. Beyond this, the 2nd resistance at 181.84 is identified as a pullback resistance, indicating a potential area where price might encounter selling pressure.
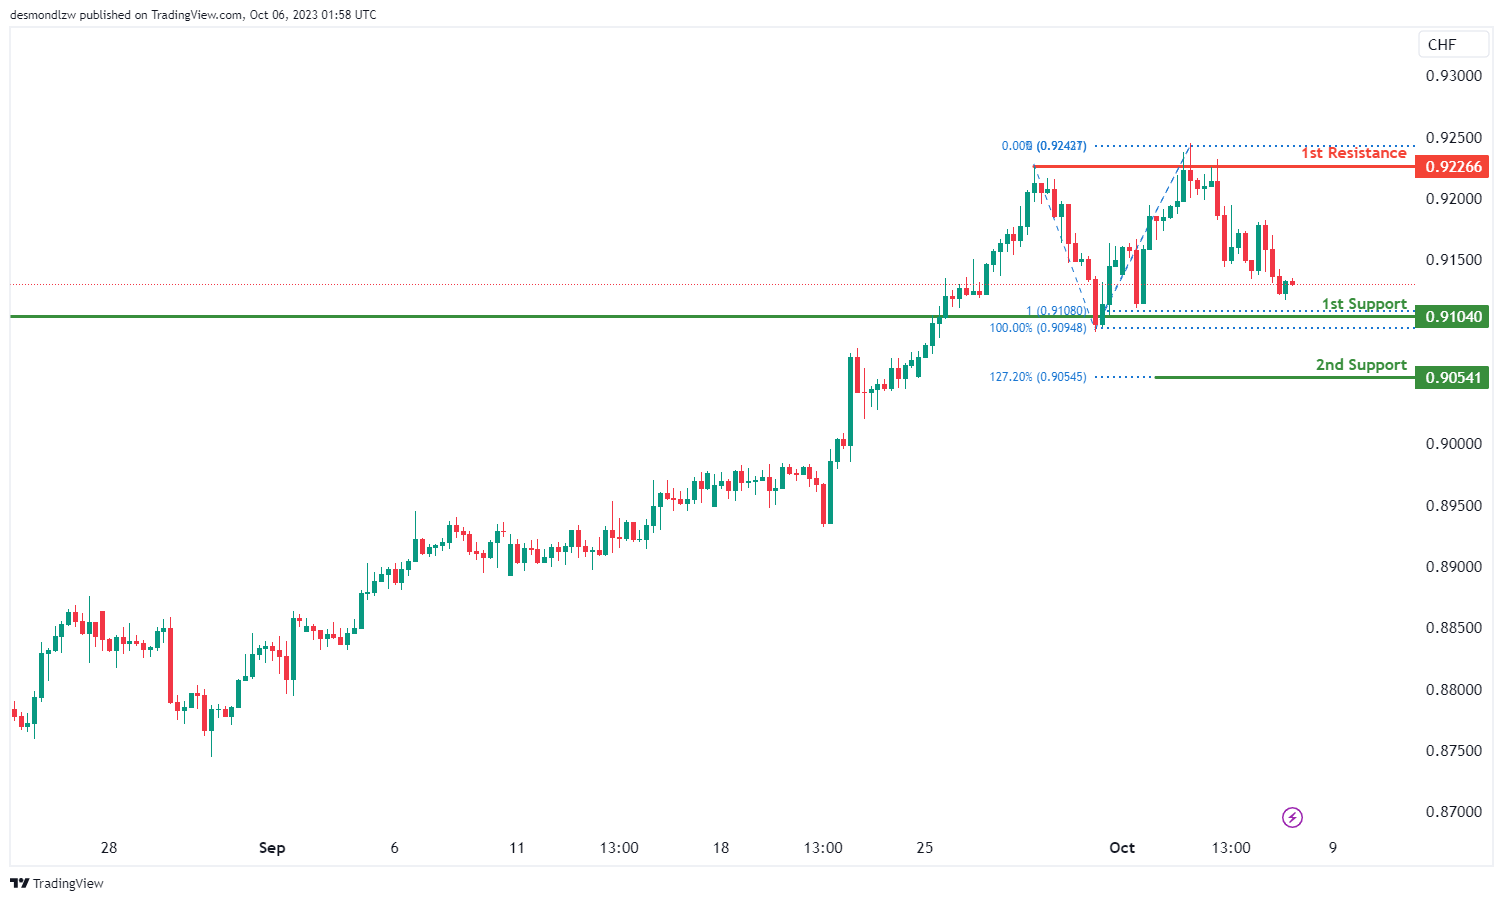
USD/CHF:
The USD/CHF chart currently maintains a bearish overall momentum, and there’s a potential scenario of a bearish continuation towards the 1st support.
The 1st support at 0.9104 is considered significant as it’s identified as an overlap support, and it also aligns with the 100% Fibonacci Projection, indicating its importance as a potential level for price support. Additionally, the 2nd support at 0.9054 is categorized as a support level, specifically the 127.20% Fibonacci Extension, further reinforcing its significance as an area where the price may find support.
On the resistance side, the 1st resistance level at 0.9226 is recognized as a multi-swing high resistance, and it’s associated with the 50% Fibonacci level. This resistance level may act as a barrier to price increases.
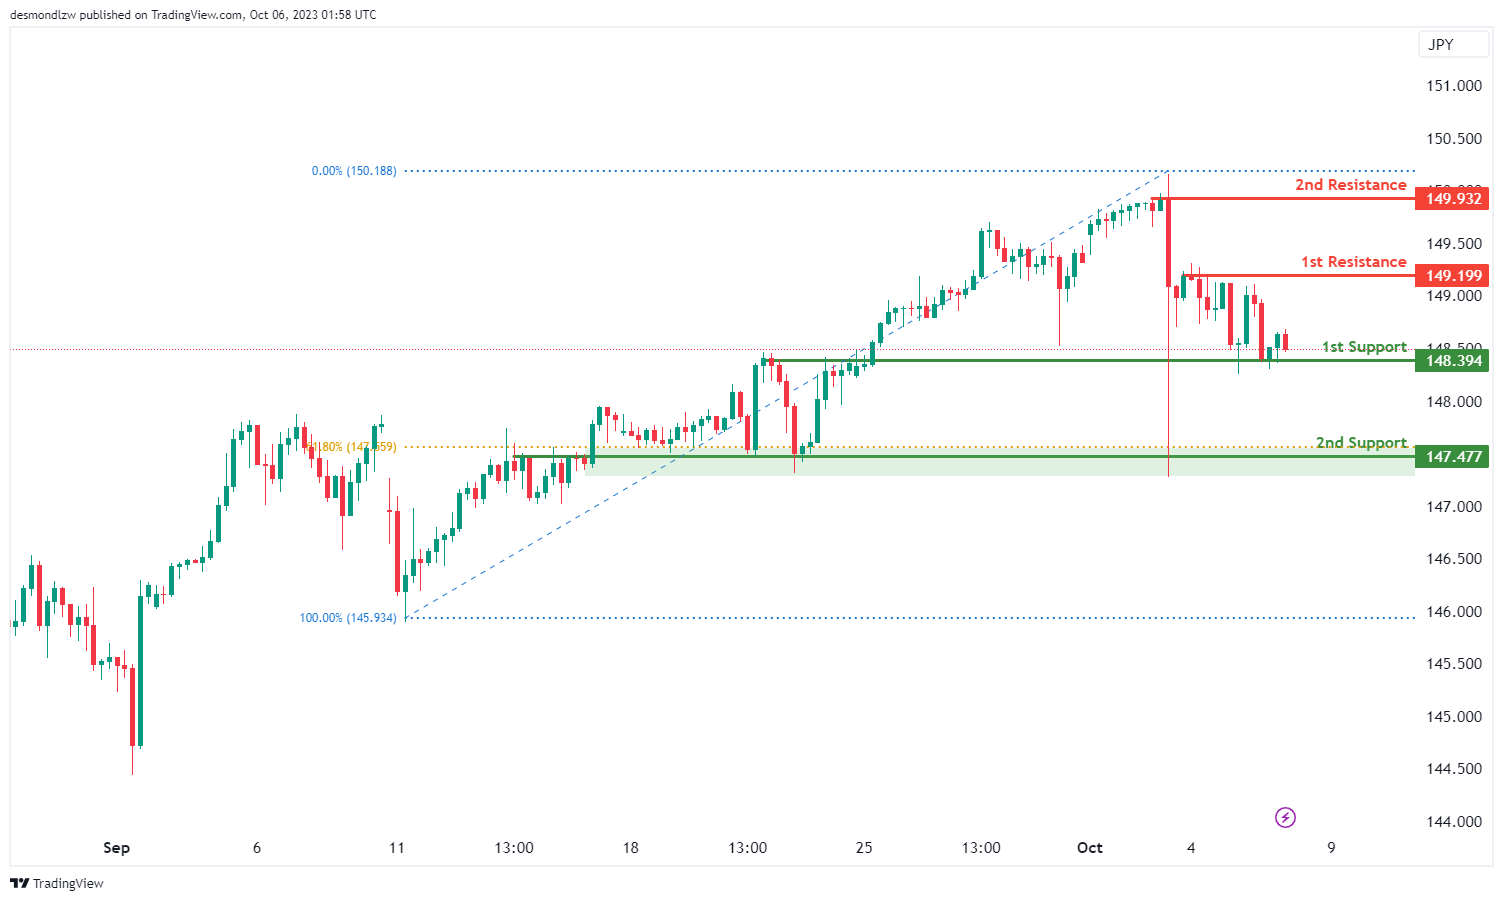
USD/JPY:
The USD/JPY chart currently exhibits a bearish momentum, but there’s a potential short-term scenario of a price rise towards the 1st resistance level before reversing and moving towards the 1st support.
The 1st support at 148.39 is considered significant, as it’s identified as an overlap support. Additionally, the 2nd support at 147.47 aligns with the 61.80% Fibonacci Retracement, further emphasizing its importance as a potential support level.
On the resistance side, the 1st resistance level at 149.19 is characterized as a swing high resistance, and beyond this, the 2nd resistance at 149.93 is also identified as a swing high resistance.
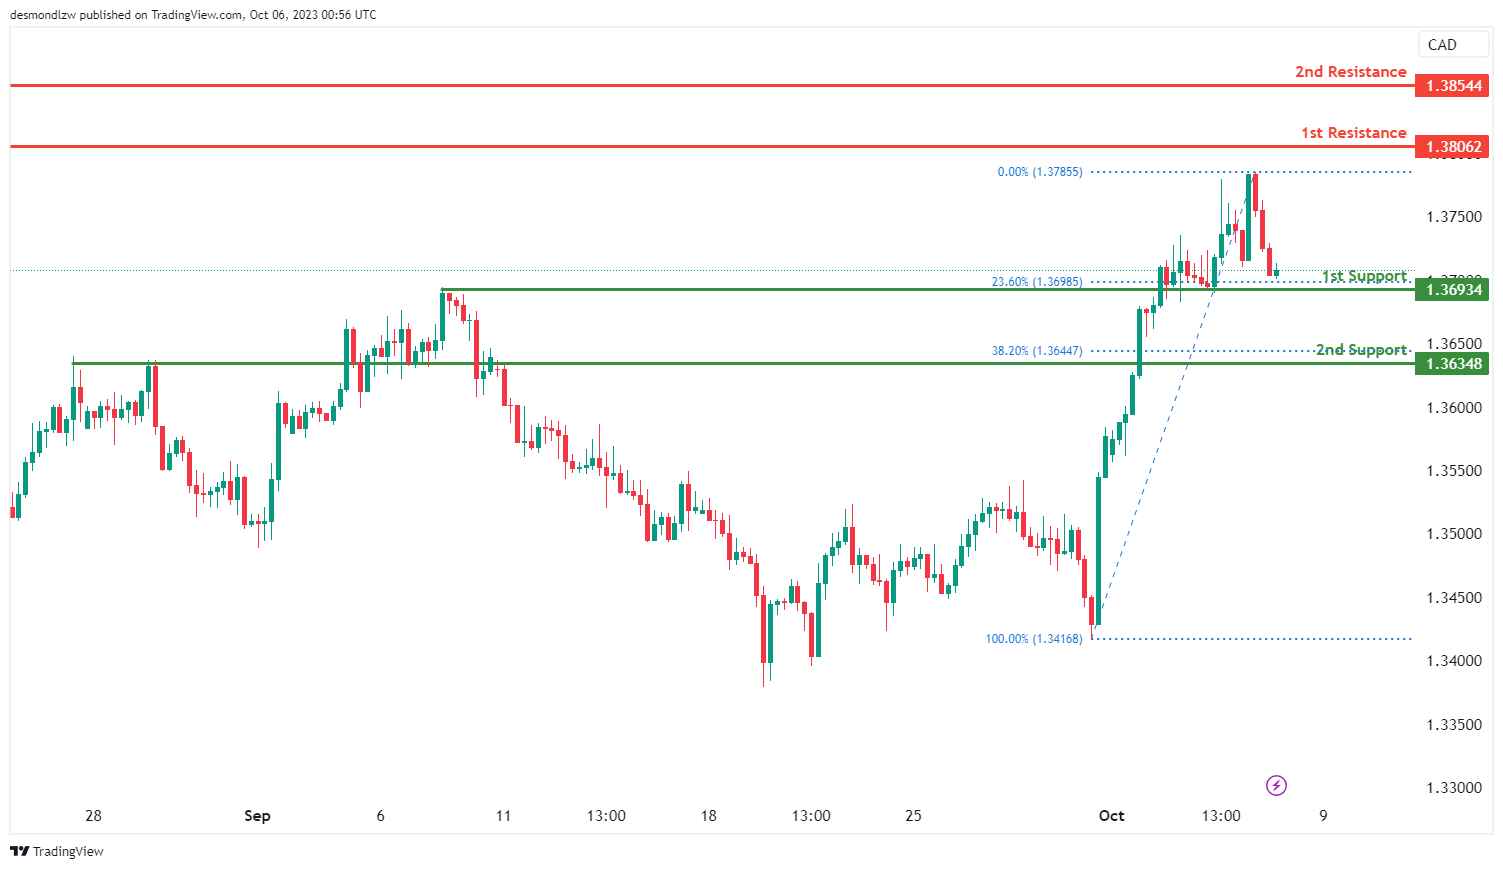
USD/CAD:
The USD/CAD chart is currently showing an overall bearish momentum suggesting the possibility of a bearish continuation towards the 1st support.
The 1st support level at 1.3693 is identified as an overlap support that aligns with the 23.60% Fibonacci retracement level. Additionally, the 2nd support level at 1.3634 is also noted as an overlap support that aligns with the 38.20% Fibonacci retracement level, further reinforcing its importance.
To the upside, the 1st resistance level at 1.3806 is identified as a pullback resistance while the 2nd resistance level at 1.3854 is also marked as a pullback resistance, further emphasizing its significance as a barrier for future price increases.
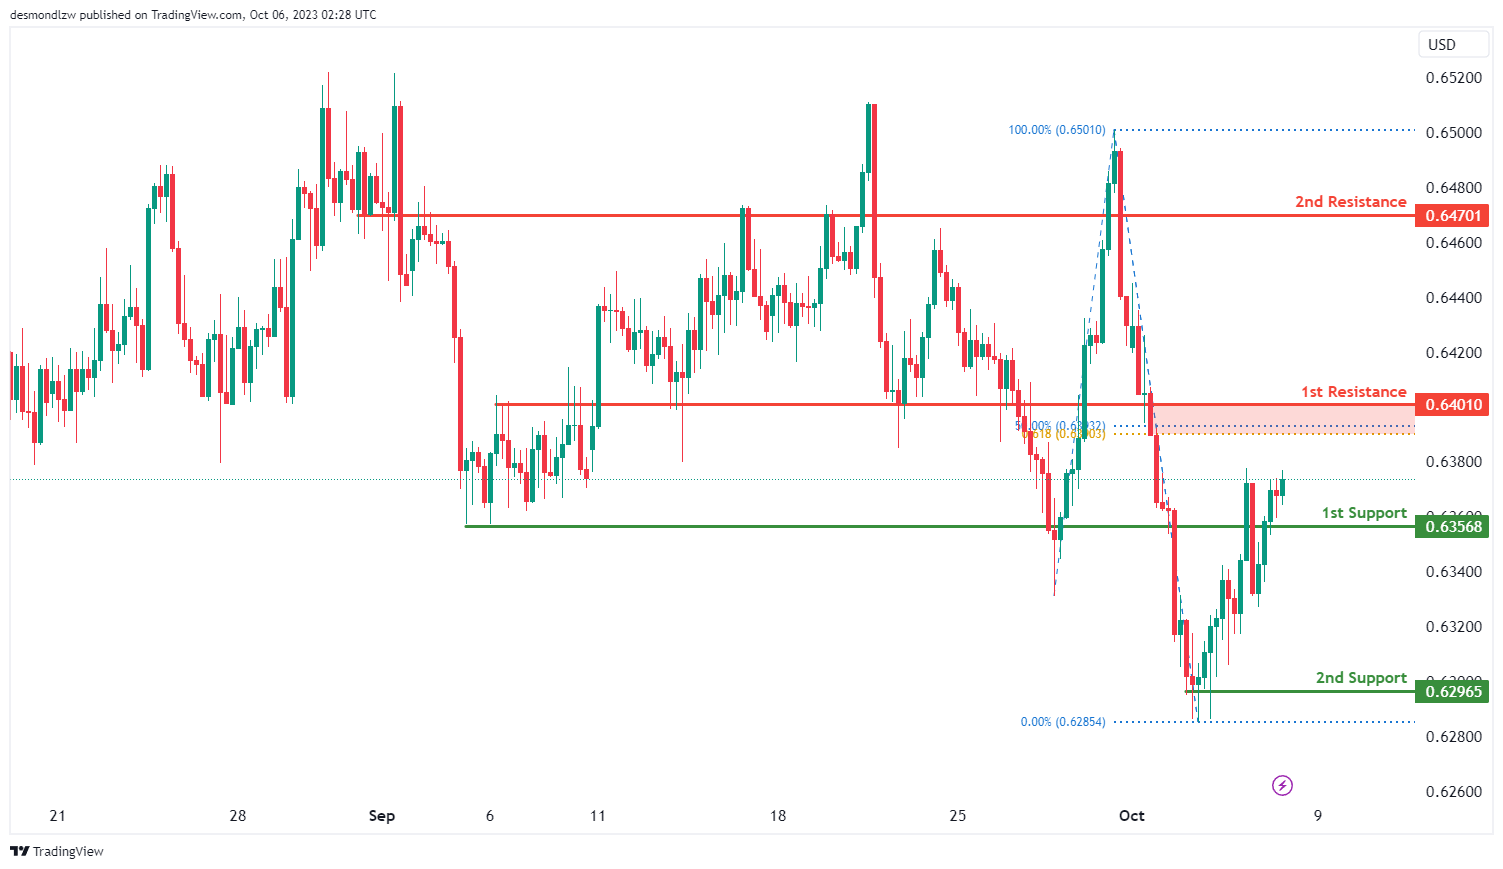
AUD/USD:
The AUD/USD chart currently exhibits an overall bullish momentum with a potential scenario of a bullish continuation towards the 1st resistance level.
The 1st resistance level at 0.6401 is identified as an overlap resistance that aligns close to a confluence of Fibonacci levels i.e. the 50.00% retracement and the 61.80% projection levels. Further up, the 2nd resistance level at 0.6470 is also marked as an overlap resistance, further emphasizing its significance as a barrier for future price increases.
To the downside, the 1st support level at 0.6357 is identified as a pullback support while the 2nd support level at 0.6297 is marked as a swing-low support, reinforcing its importance as a potential support level.
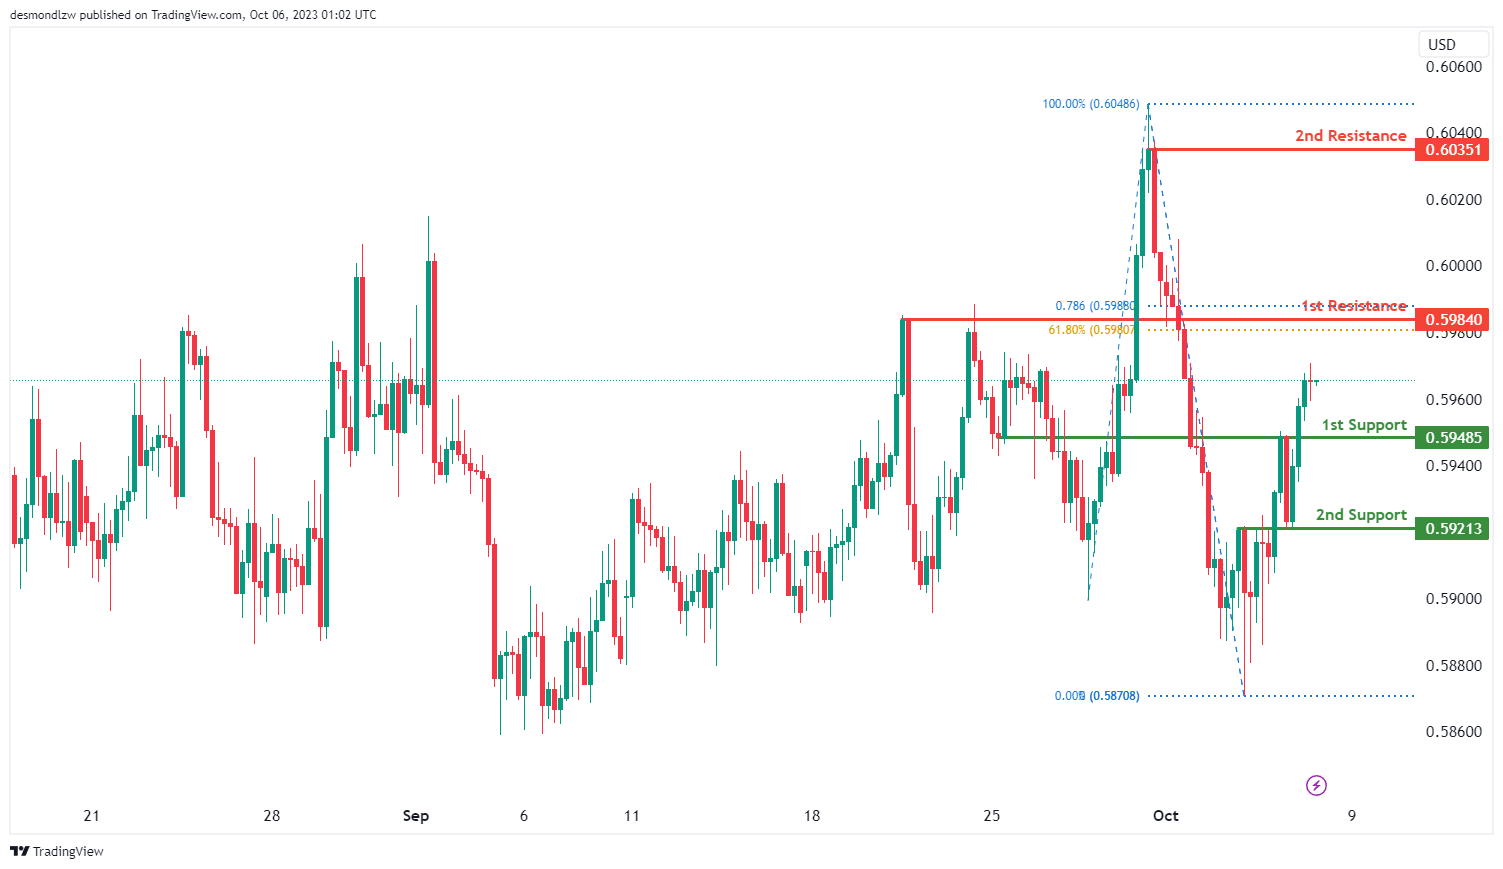
NZD/USD
The NZD/USD chart currently exhibits an overall bullish momentum with a potential scenario of a bullish continuation towards the 1st resistance level.
The 1st resistance level at 0.5984 is identified as a pullback resistance that aligns with a confluence of Fibonacci levels i.e. the 61.80% retracement and the 78.60% projection levels. Additionally, the 2nd resistance level at 0.6035 is marked as a swing-high resistance, further emphasizing its significance as a barrier for future price increases.
To the downside, the 1st support level at 0.5949 is identified as an overlap support. Further below, the 2nd support level at 0.5921 is also noted as an overlap support, further reinforcing its significance as an area where price may find support.
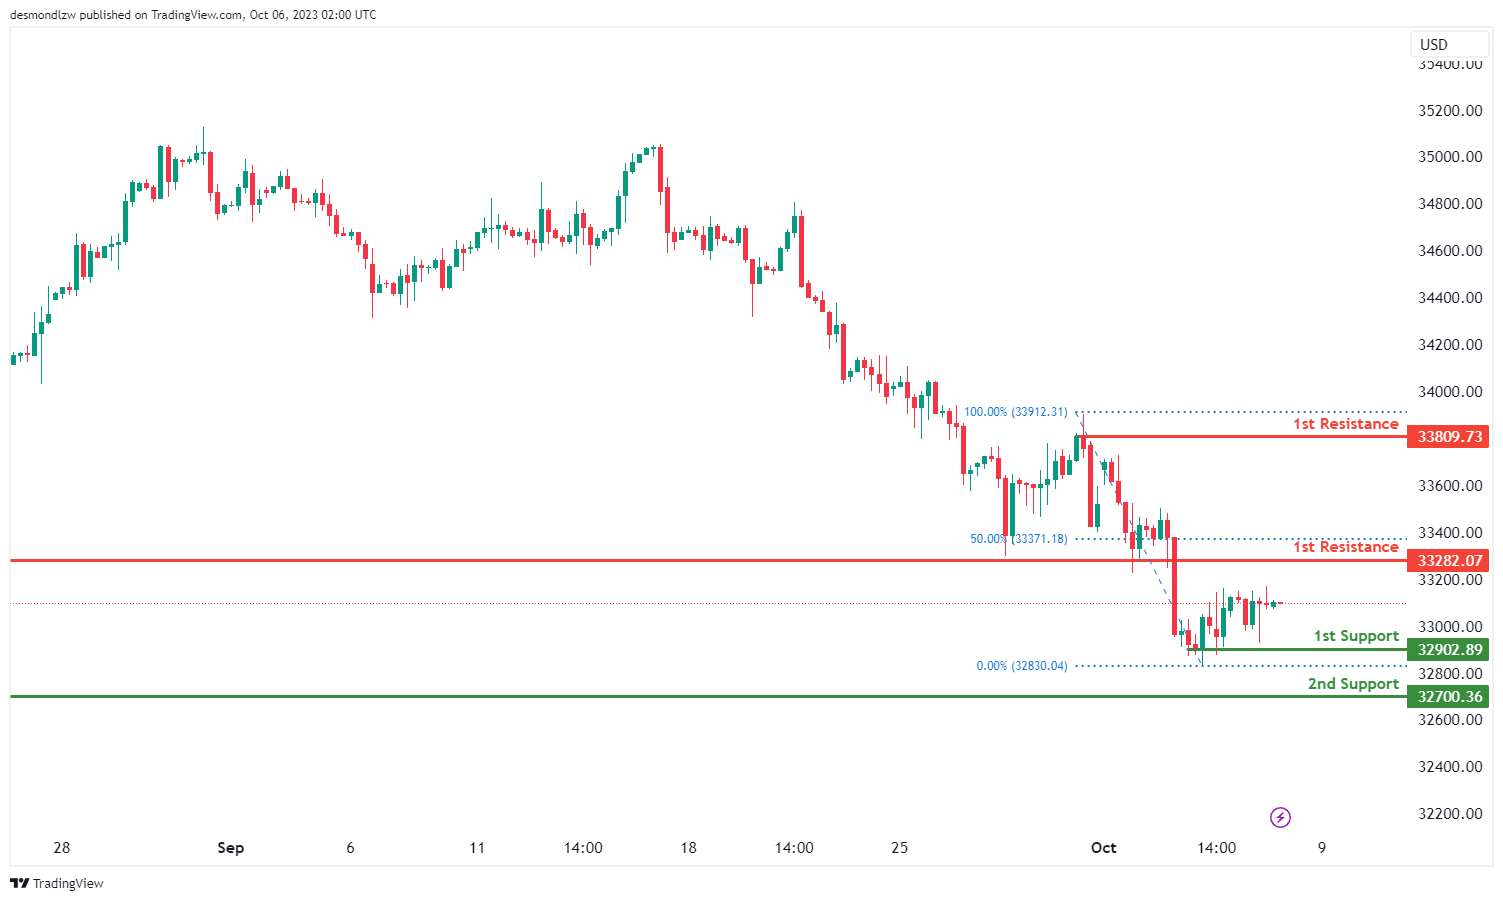
DJ30:
The DJ30 (Dow Jones 30) chart is currently displaying a neutral overall momentum, indicating the potential scenario of price fluctuating between the 1st resistance and 1st support levels.
The 1st support level at 32902.89 is considered significant as it’s identified as a multi-swing low support, suggesting that it may act as a reliable level for potential price rebounds. Additionally, the 2nd support at 37700.36 is also a multi-swing low support, providing another important level to watch.
On the resistance side, the 1st resistance level at 33282.07 is characterized as a pullback resistance, potentially acting as a barrier to further upward movement. Beyond this, the 2nd resistance at 33809.73 represents a swing high resistance, indicating another key level where price might encounter selling pressure.
GER40:
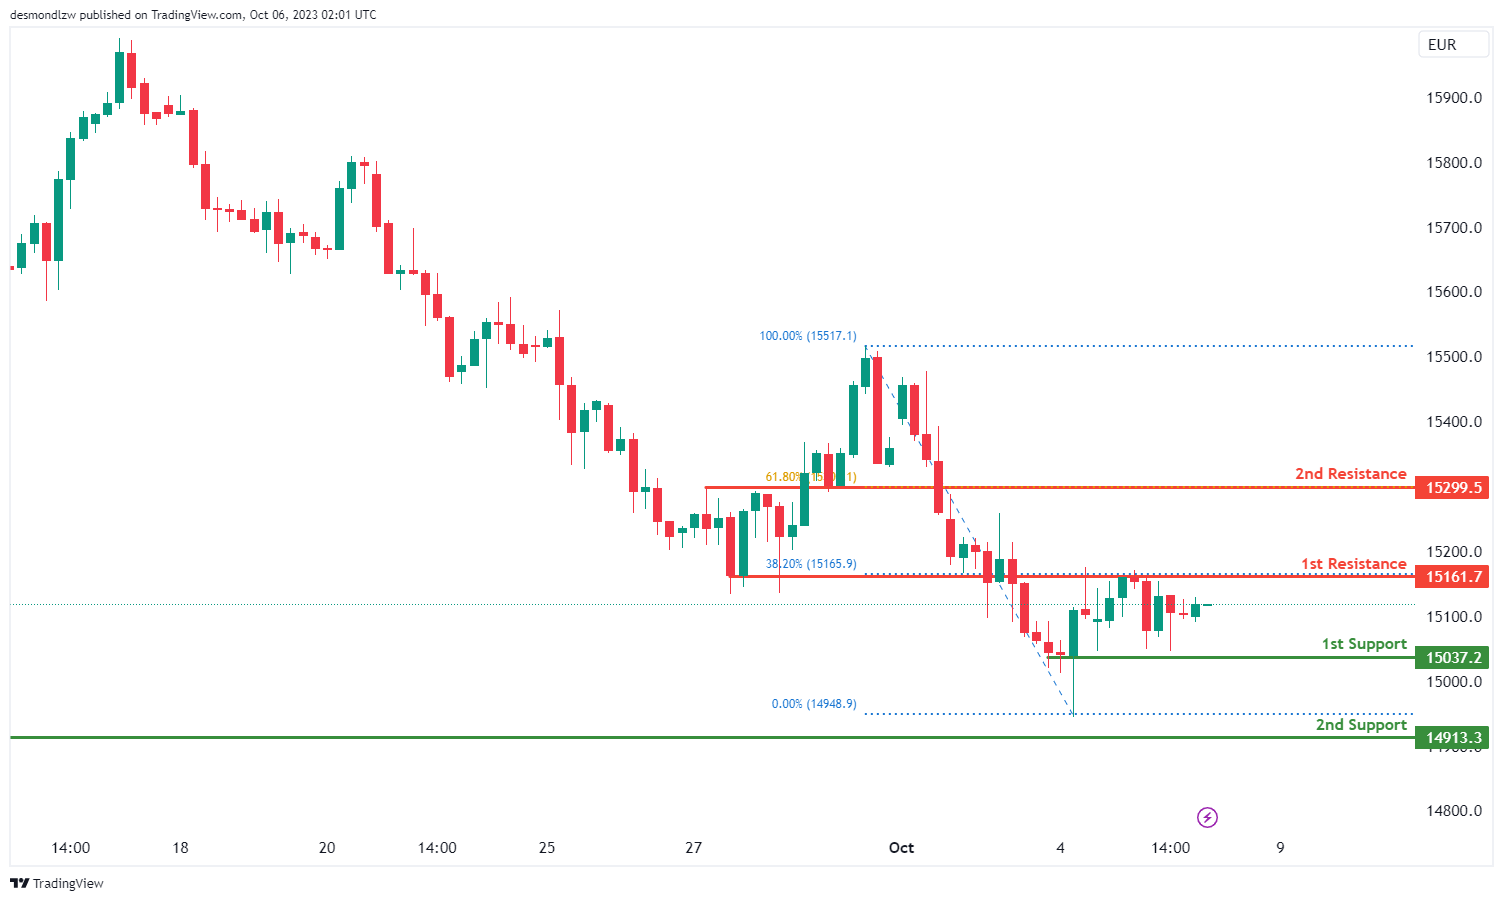
The GER40 chart currently exhibits a neutral momentum, suggesting a potential scenario of price fluctuation between the 1st resistance and 1st support levels.
The 1st support at 15037.20 is considered significant as it’s identified as a multi-swing low support. Additionally, the 2nd support at 14913.30 is a swing low support, adding to its importance as a potential level where price might find buying interest.
On the resistance side, the 1st resistance level at 15161.70 is characterized as an overlap resistance, and it also coincides with the 38.20% Fibonacci Retracement level. Beyond this, the 2nd resistance at 15299.50 represents a pullback resistance and is marked by the 61.80% Fibonacci Retracement level.
US500
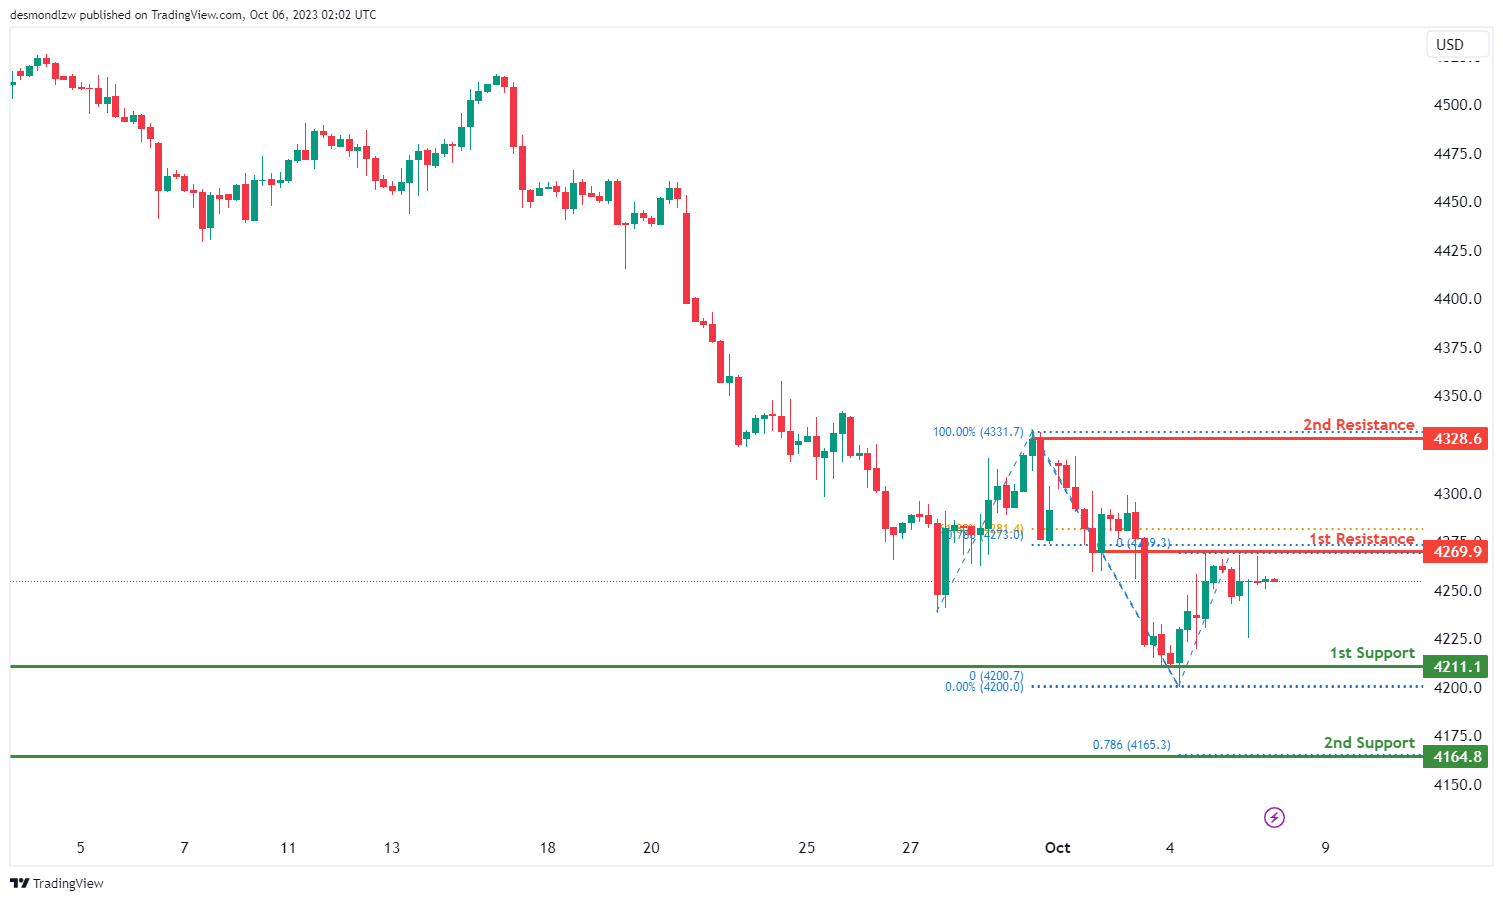
TThe US500 chart currently exhibits a bearish momentum, suggesting a potential scenario of a bearish reaction off the 1st resistance level, with a subsequent drop towards the 1st support.
The 1st support at 4211.1 is significant as it’s identified as a swing low support. Additionally, the 2nd support at 4164.8 is also a swing low support and is further reinforced by the presence of the 78.60% Fibonacci Projection and the 61.80% Fibonacci Retracement, indicating a strong confluence of technical factors at this level.
On the resistance side, the 1st resistance level at 4269.9 is characterized as an overlap resistance, and it coincides with the 78.60% Fibonacci Projection, adding to its significance as a potential barrier for price movement. Beyond this, the 2nd resistance at 4328.6 represents a swing high resistance.
BTC/USD:
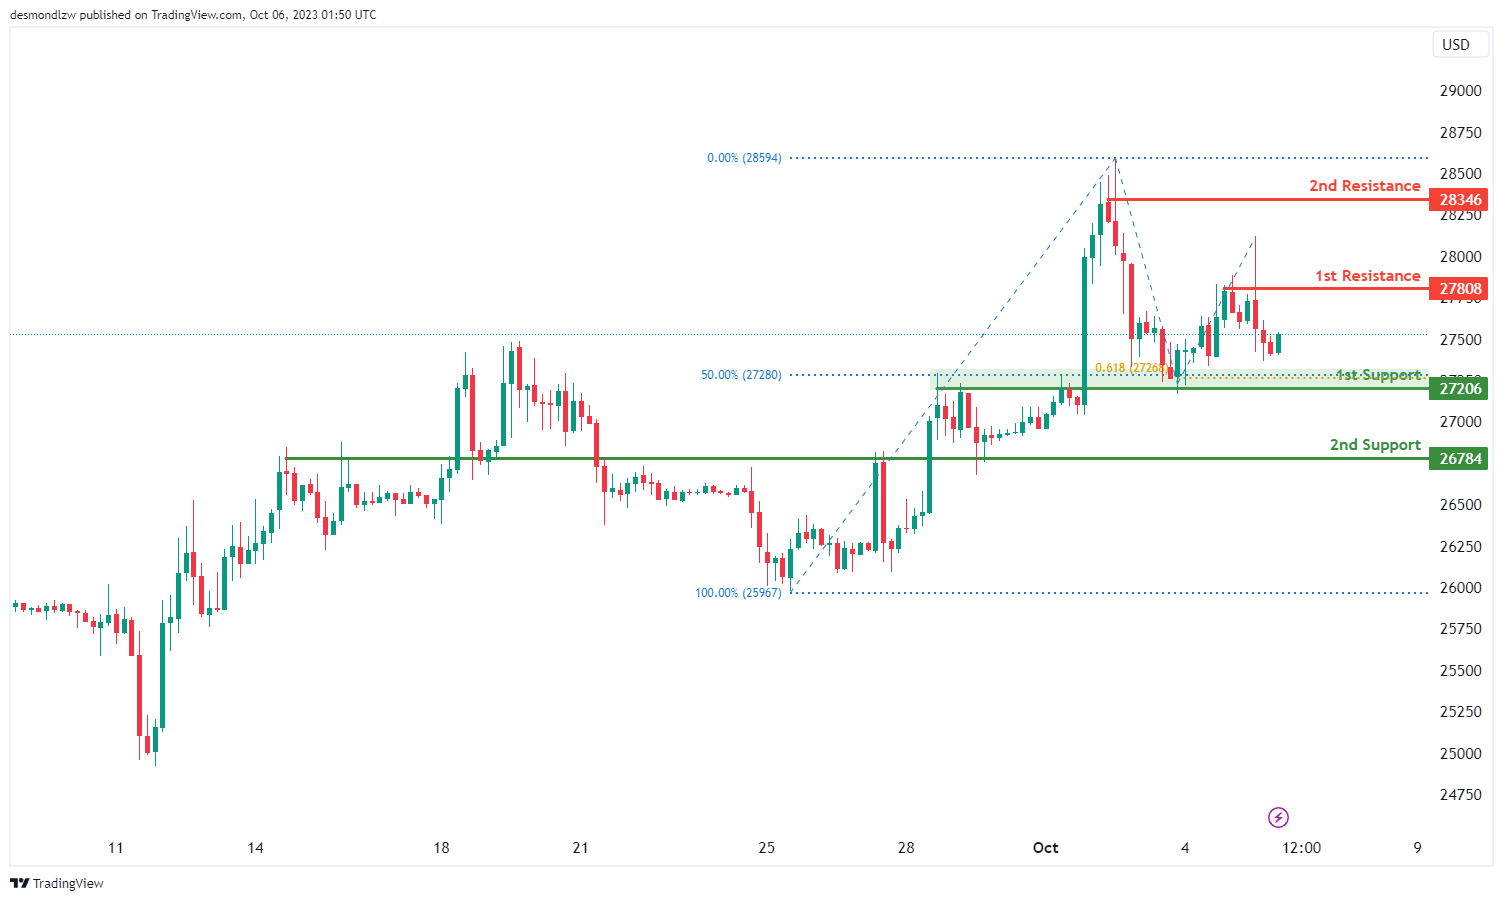
The BTC/USD chart currently has a bearish momentum, and there is a potential scenario of a bearish reaction off the 1st resistance, followed by a drop towards the 1st support.
The 1st support at 27206 is considered significant due to its alignment with both the 50% Fibonacci Retracement level and the 61.80% Fibonacci Projection, indicating a potential Fibonacci confluence, which suggests it could act as a strong support level.
The 2nd support at 26784 is also identified as an overlap support, reinforcing its importance as a potential level of price support.
On the resistance side, the 1st resistance level at 27808 is recognized as a swing high resistance, and beyond this, the 2nd resistance at 28346 is also categorized as a swing high resistance.
ETH/USD:
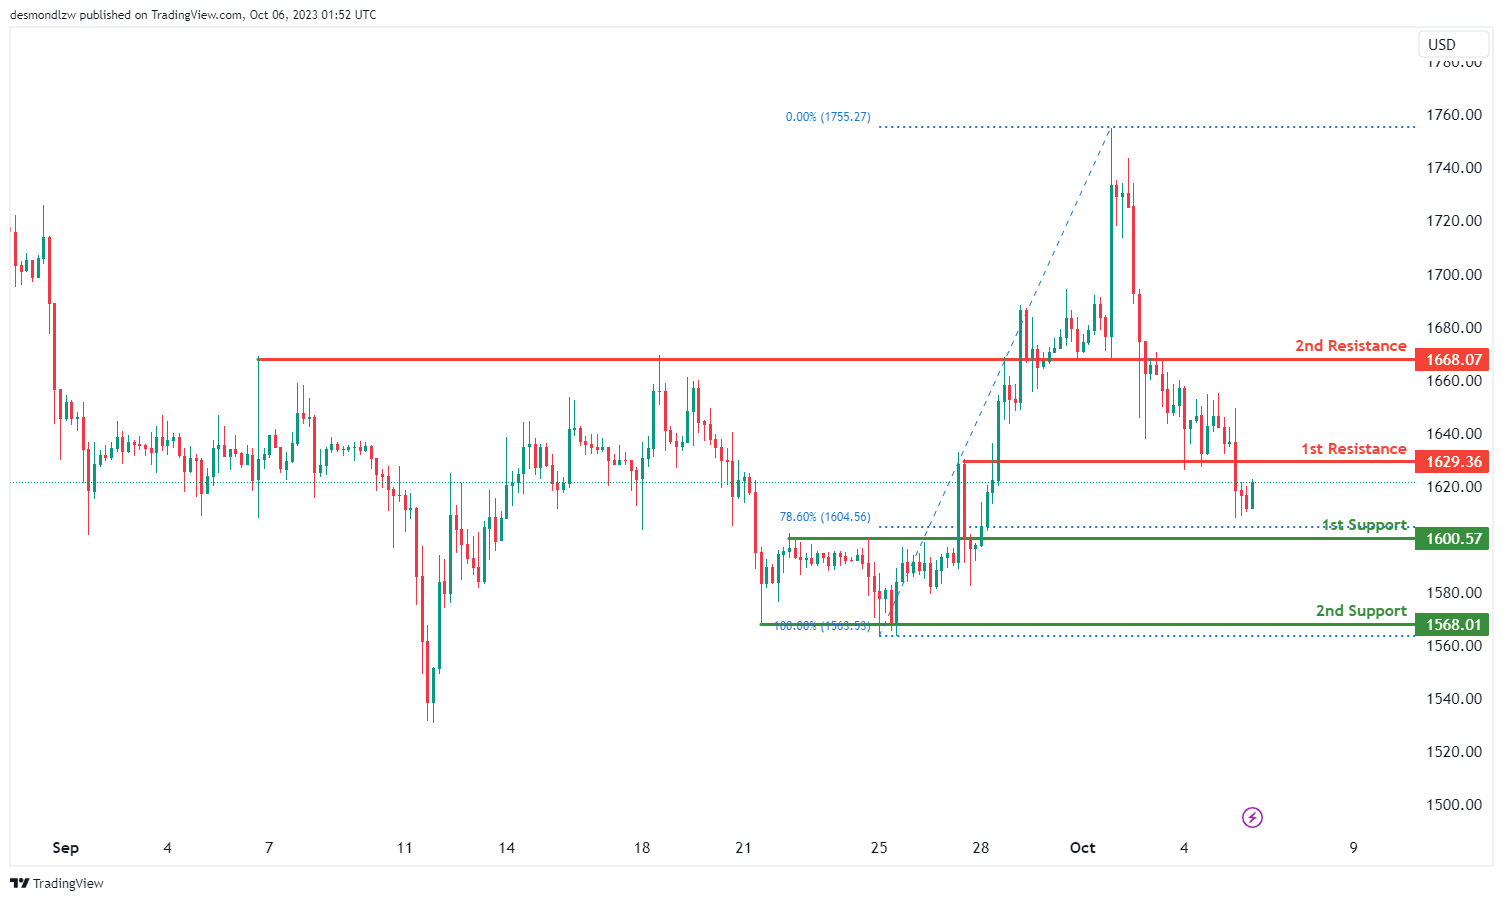
The ETH/USD chart currently exhibits a bearish momentum, and there is a potential scenario of a bearish reaction off the 1st resistance, followed by a drop to the 1st support.
The 1st support level at 1600.57 is considered significant as it is an overlap support, indicating that it has previously acted as a price support level. The 2nd support at 1568.01 is another important level, characterized as a multi-swing low support, suggesting it could provide additional support to price if it declines.
On the resistance side, the 1st resistance at 1629.36 is identified as a pullback resistance, which could act as a barrier to further upside movement.
Beyond the 1st resistance, the 2nd resistance at 1668.07 is recognized as an overlap resistance, implying that it has previously held as a price barrier.
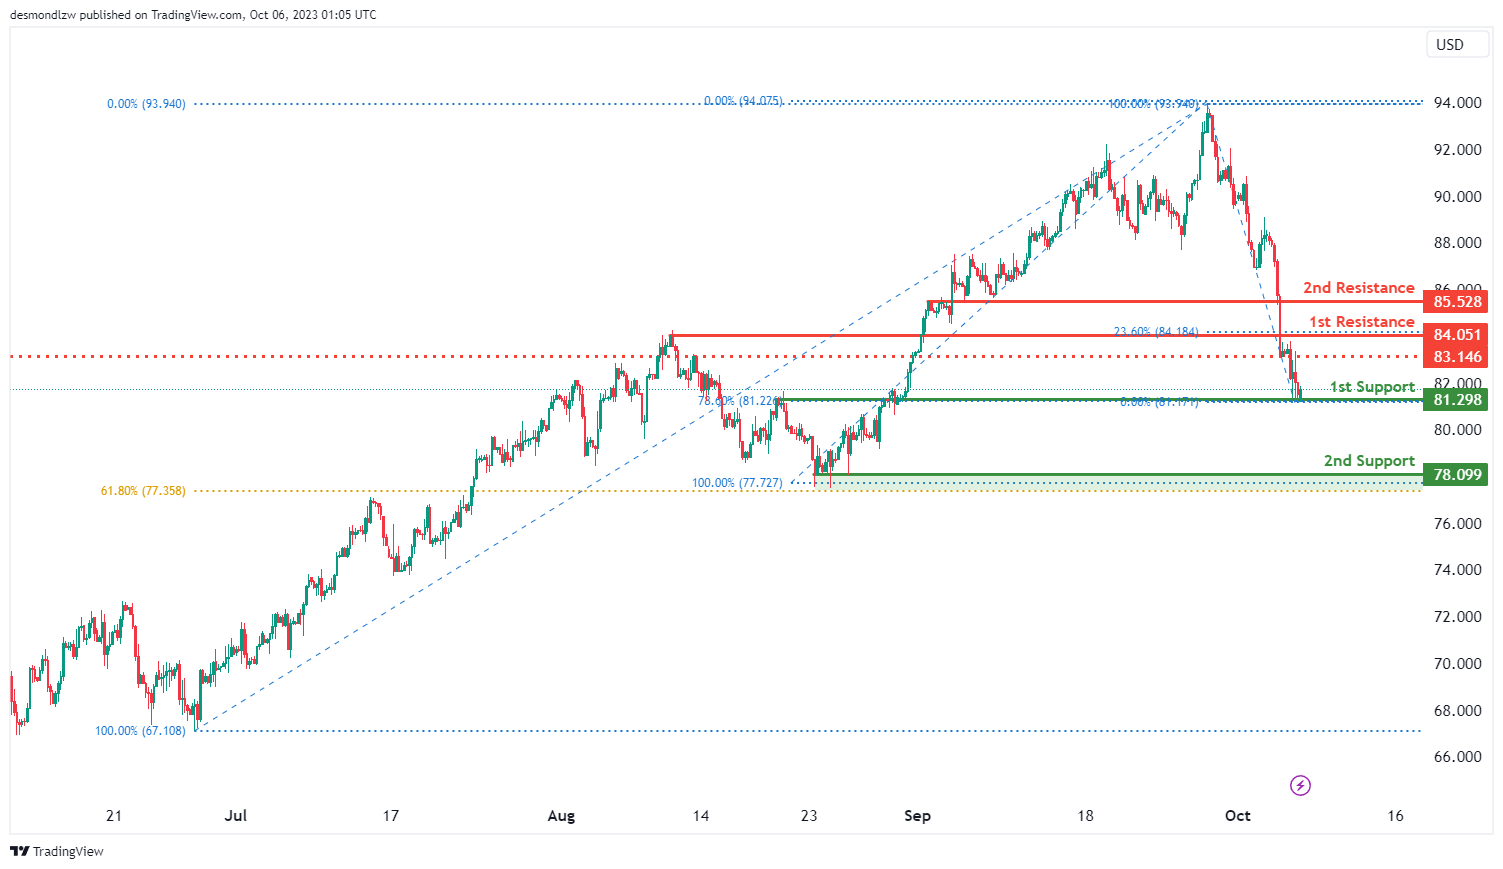
WTI/USD:
The WTI chart currently shows an overall bearish momentum but there is a potential for price to make a short-term bullish bounce towards the intermediate resistance before resuming the downturn.
The intermediate resistance level at 83.15 is identified as a pullback resistance while the 1st resistance level at 84.05 is also identified as a pullback resistance that aligns with the 23.60% Fibonacci retracement level. Additionally, the 2nd resistance level at 85.53 is noted as an overlap resistance.
To the downside, the 1st support level at 81.29 is identified as an overlap support that aligns with the 78.60% Fibonacci retracement level. Further below, the 2nd support level at 78.09 is marked as a pullback support that aligns close to the 61.80% Fibonacci retracement level.
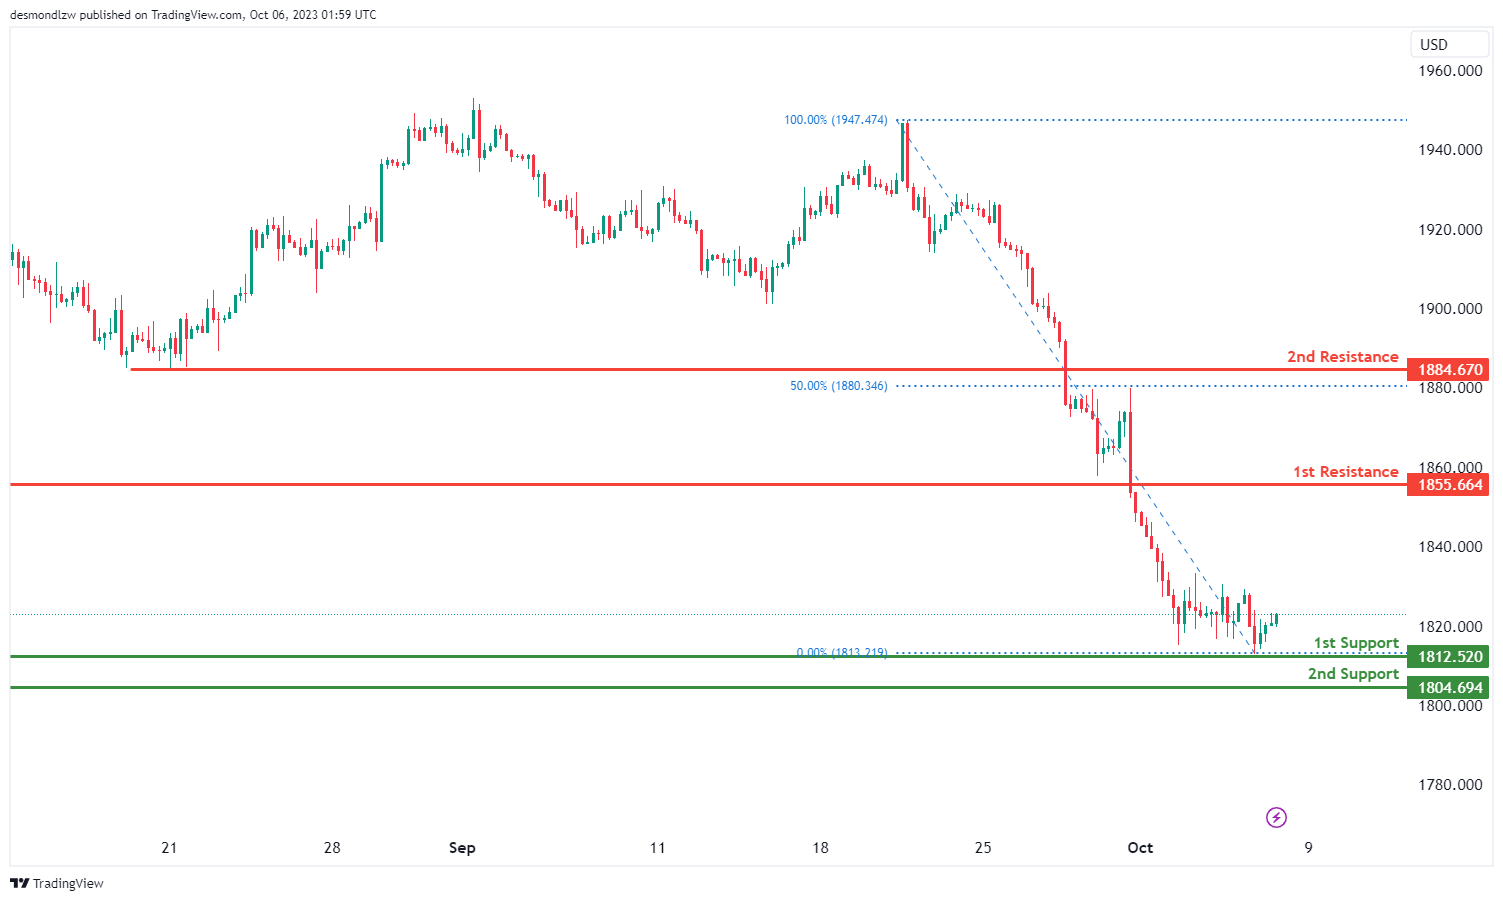
XAU/USD (GOLD):
The XAU/USD chart currently exhibits bullish momentum, with the potential scenario of a bullish continuation towards the 1st resistance.
The 1st support at 1812.52 is considered significant as it’s identified as a swing low support. Additionally, the 2nd support at 2804.69 appears to be an erroneous value; please verify and provide the correct level if needed.
On the resistance side, the 1st resistance level at 1855.66 is characterized as a pullback resistance, and beyond this, the 2nd resistance at 1884.64 is identified as an overlap resistance and coincides with the 50% Fibonacci Retracement level.


