
DXY:
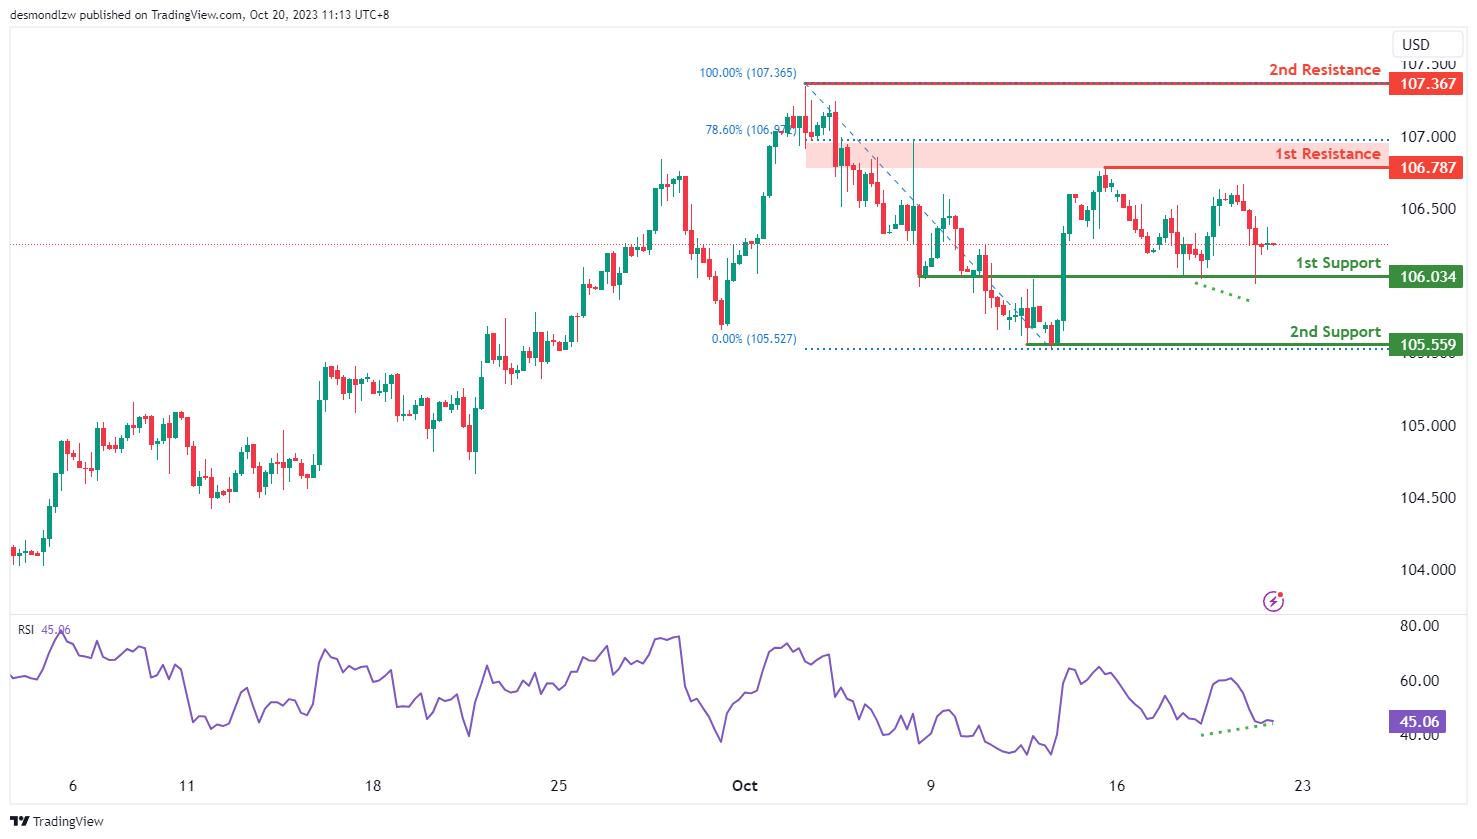
The DXY (US Dollar Index) chart currently displays an overall neutral momentum, suggesting a potential scenario for price to fluctuate between the 1st resistance and the 1st support levels. However, the Relative Strength Index (RSI) is displaying bullish divergence versus price, indicating the likelihood of a bullish move towards the 1st resistance level.
The 1st support level at 106.03 is identified as an overlap support. Additionally, the 2nd support level at 105.56 is identified as a swing-low support, further reinforcing potential price support.
To the upside, the 1st resistance level at 106.79 is characterized as a pullback resistance that aligns close to the 78.60% Fibonacci retracement level. Beyond this, the 2nd resistance level at 107.37 is identified as a swing-high resistance.
EUR/USD:
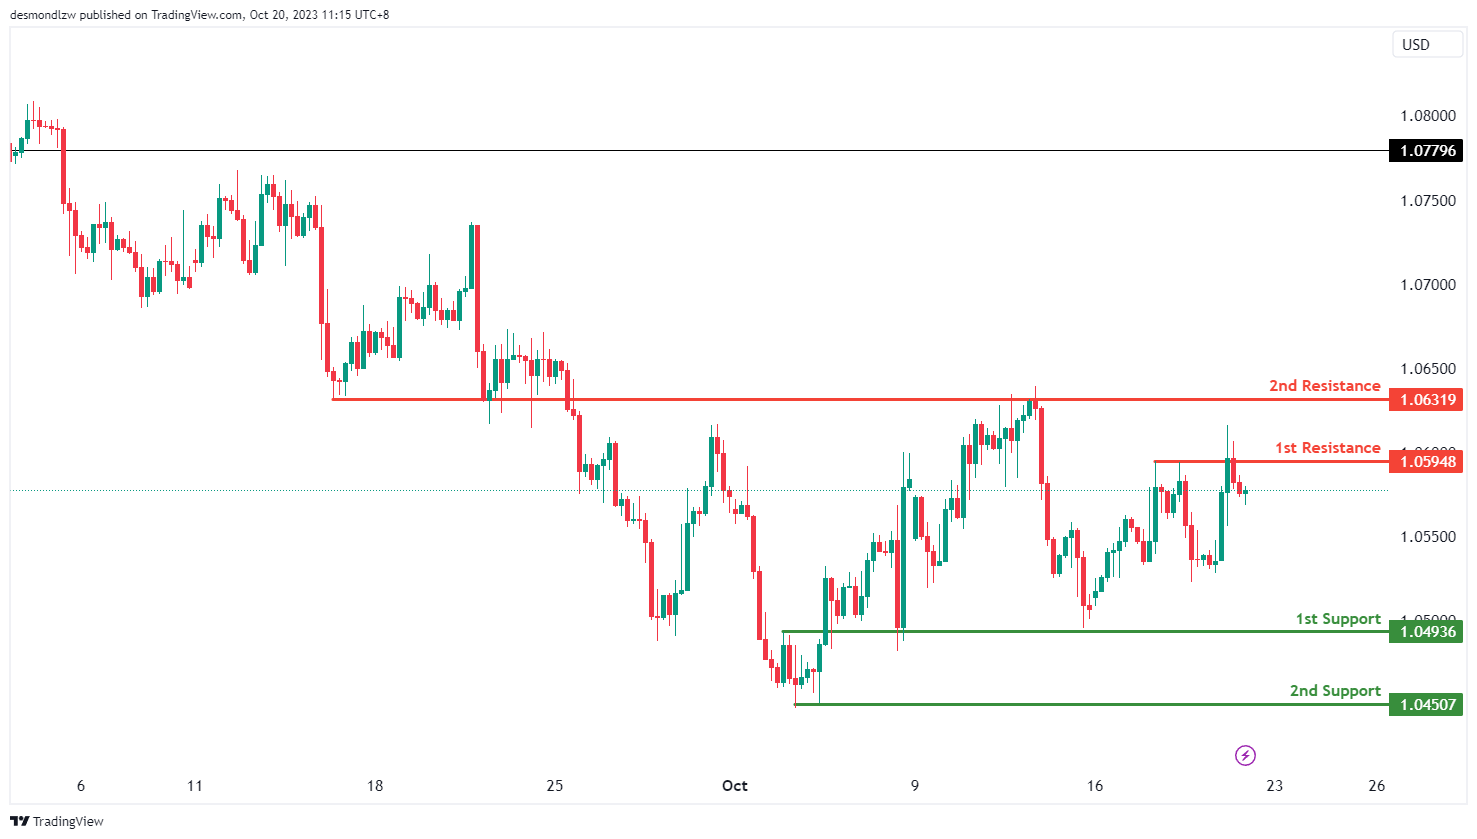
The EUR/USD chart currently demonstrates an overall bearish momentum, indicating a potential scenario for price to make a bearish reaction off the 1st resistance level with a subsequent drop towards the 1st support level.
The 1st resistance level at 1.0595 is characterized as a pullback resistance. Beyond this, the 2nd resistance level at 1.0632 is identified as an overlap resistance, potentially acting as a barrier to further bullish advances.
To the downside, the 1st support level at 1.0494 is identified as an overlap support. Additionally, the 2nd support level at 1.0451 is identified as a swing-low support, further reinforcing a potential zone for price support.
EUR/JPY:
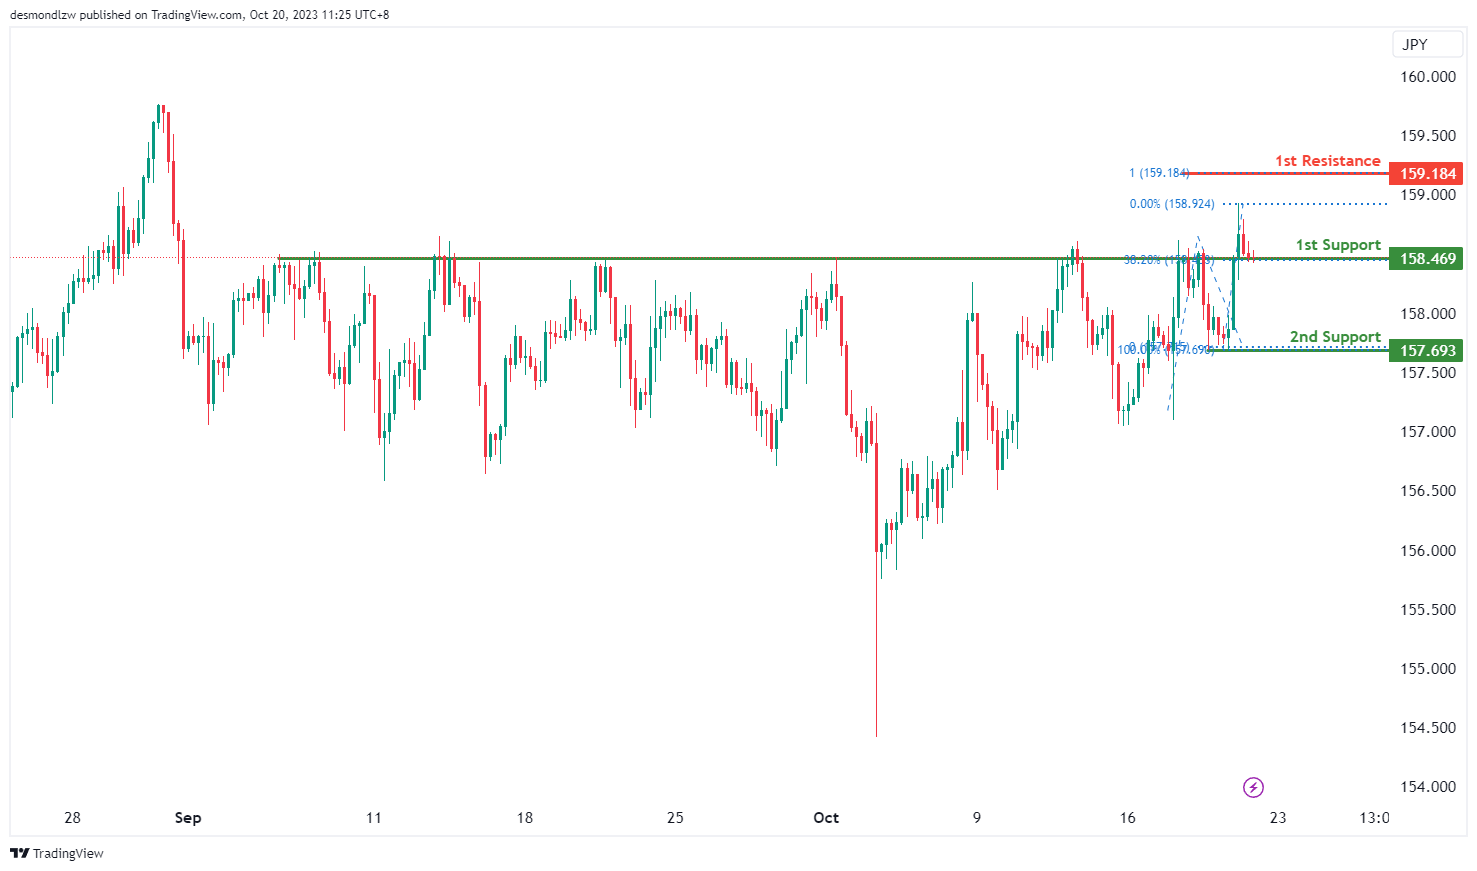
The instrument we are analyzing is EUR/JPY, and the overall momentum of the chart indicates a bullish trend.
There is a possibility that the price may experience a bullish bounce when approaching the first support level and then head towards the first resistance level.
The first support level is at 158.46, and it’s considered strong because it represents an overlap of support and aligns with a 38.20% Fibonacci Retracement.
The second support level is at 157.69, and it’s also significant as it marks a swing low support.
On the resistance side, the first resistance level is at 159.18, and it’s noteworthy as it represents a significant level and aligns with a 100% Fibonacci Projection.
EUR/GBP:
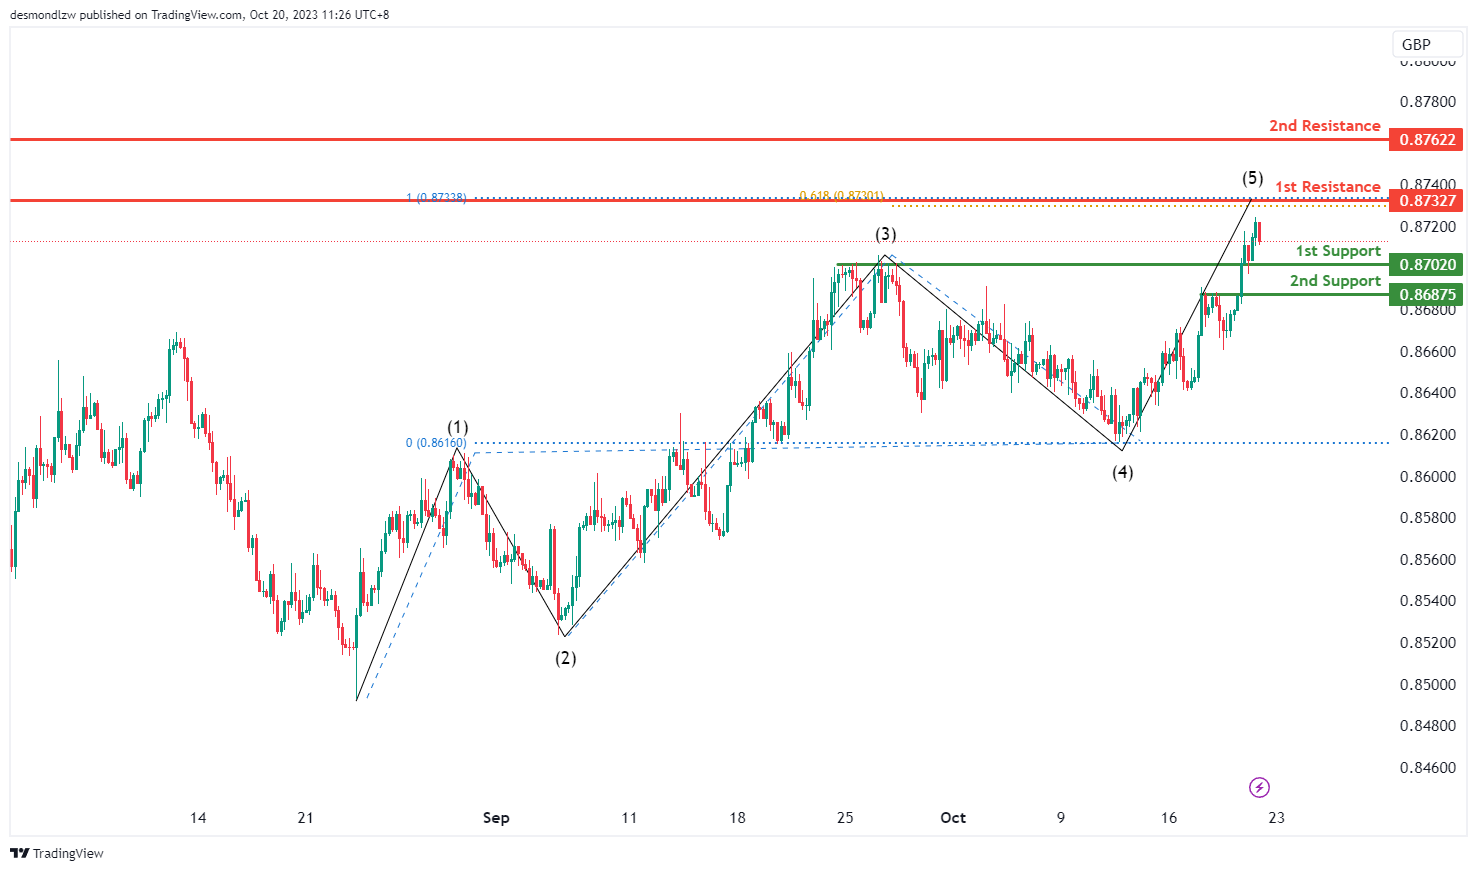
The instrument we are examining is EUR/GBP, and the overall momentum of the chart indicates a bullish trend.
There is a possibility that the price may drop further to the first support level in the short term before bouncing from there and rising to the first resistance level.
The first support level is at 0.8702, and it’s considered strong because it represents an overlap of support.
The second support level is at 0.8687, and it’s also significant as it marks a pullback support.
On the resistance side, the first resistance level is at 0.8732, and it’s noteworthy because it represents an overlap of resistance and is accompanied by a 61.80% Fibonacci Projection and a 100% Fibonacci Projection, indicating a Fibonacci confluence.
The second resistance level is at 0.8762, and it’s significant as well, as it functions as an overlap resistance.
GBP/USD:
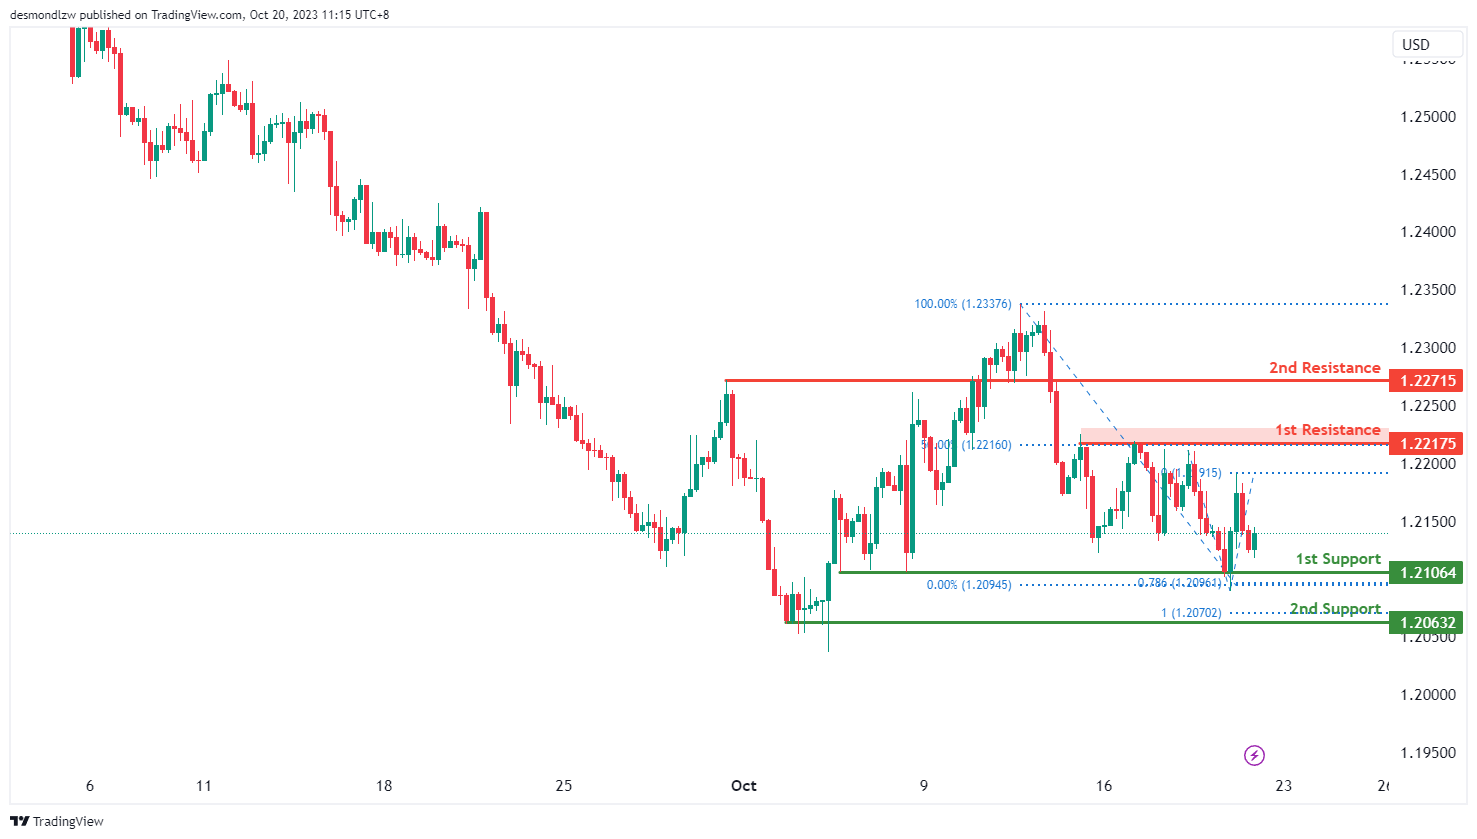
The GBP/USD chart currently exhibits a neutral momentum, suggesting a potential for price to fluctuate between the 1st resistance and the 1st support levels.
The 1st support level at 1.2106 is identified as a pullback support that aligns with the 78.60% Fibonacci projection level. Additionally, the 2nd support level at 1.2063 is identified as a swing-low support that aligns with the 100.00% Fibonacci projection level, adding another layer of potential price support.
To the upside, the 1st resistance level at 1.2218 is characterized as a multi-swing-high resistance that aligns with the 50.00% Fibonacci retracement level. Beyond this, the 2nd resistance level at 1.2272 is identified as an overlap resistance, potentially acting as a barrier to further bullish advances.
GBP/JPY:
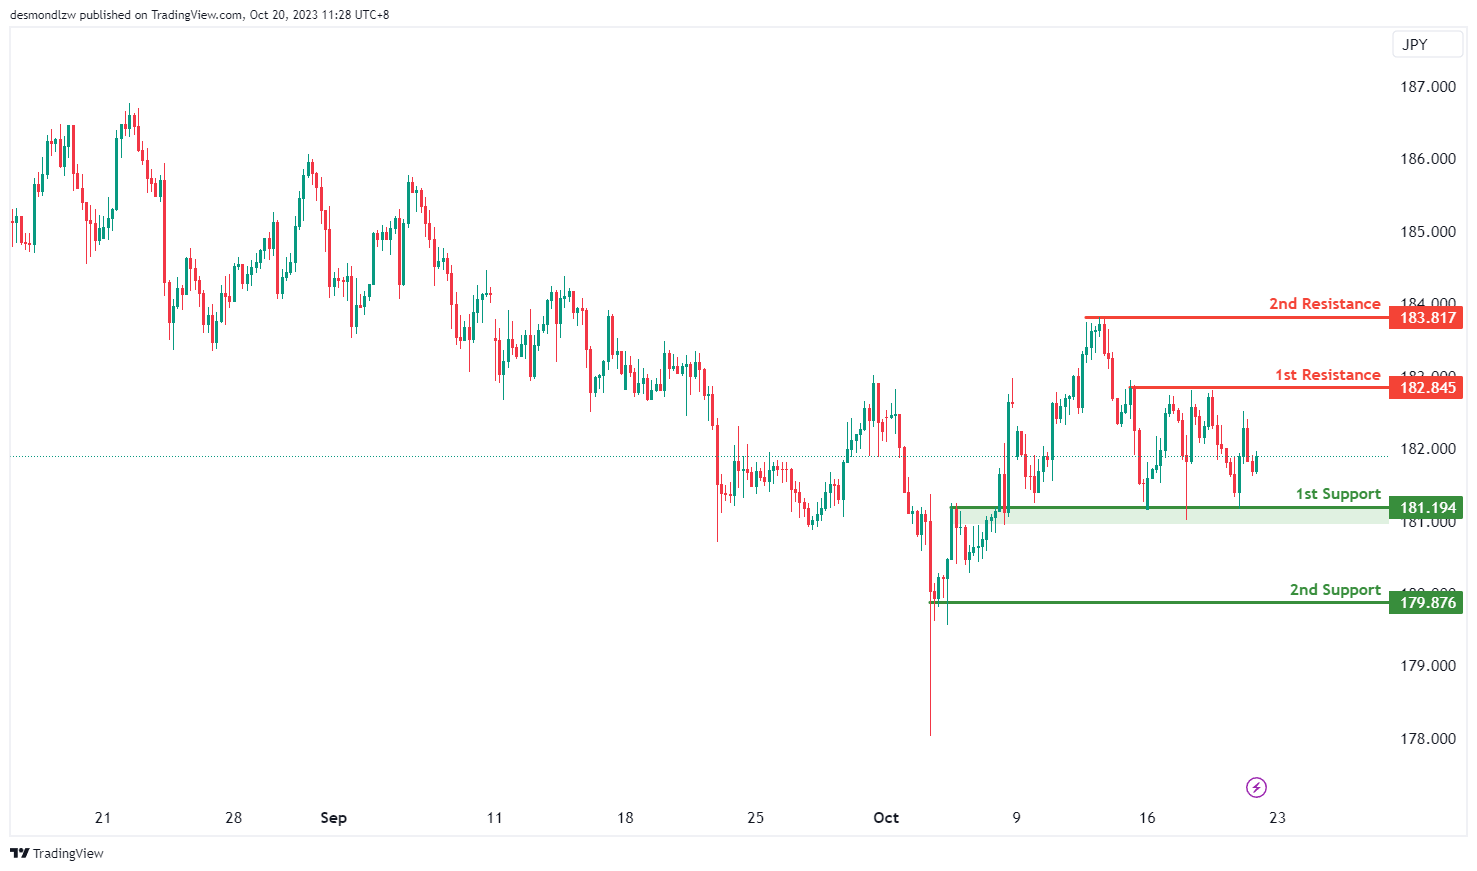
The instrument under analysis is GBP/JPY, and the overall momentum of the chart is currently neutral, indicating a lack of a clear trend.
There is a possibility that the price may fluctuate between the first resistance and first support levels.
The first support level is at 181.19, and it’s considered strong because it represents an overlap of support.
The second support level is at 179.87, and it’s also significant as it marks a swing low support.
On the resistance side, the first resistance level is at 182.84, and it’s noteworthy because it represents a multi-swing high resistance.
The second resistance level is at 183.81, and it’s significant as well, as it represents a swing high resistance.
USD/CHF:
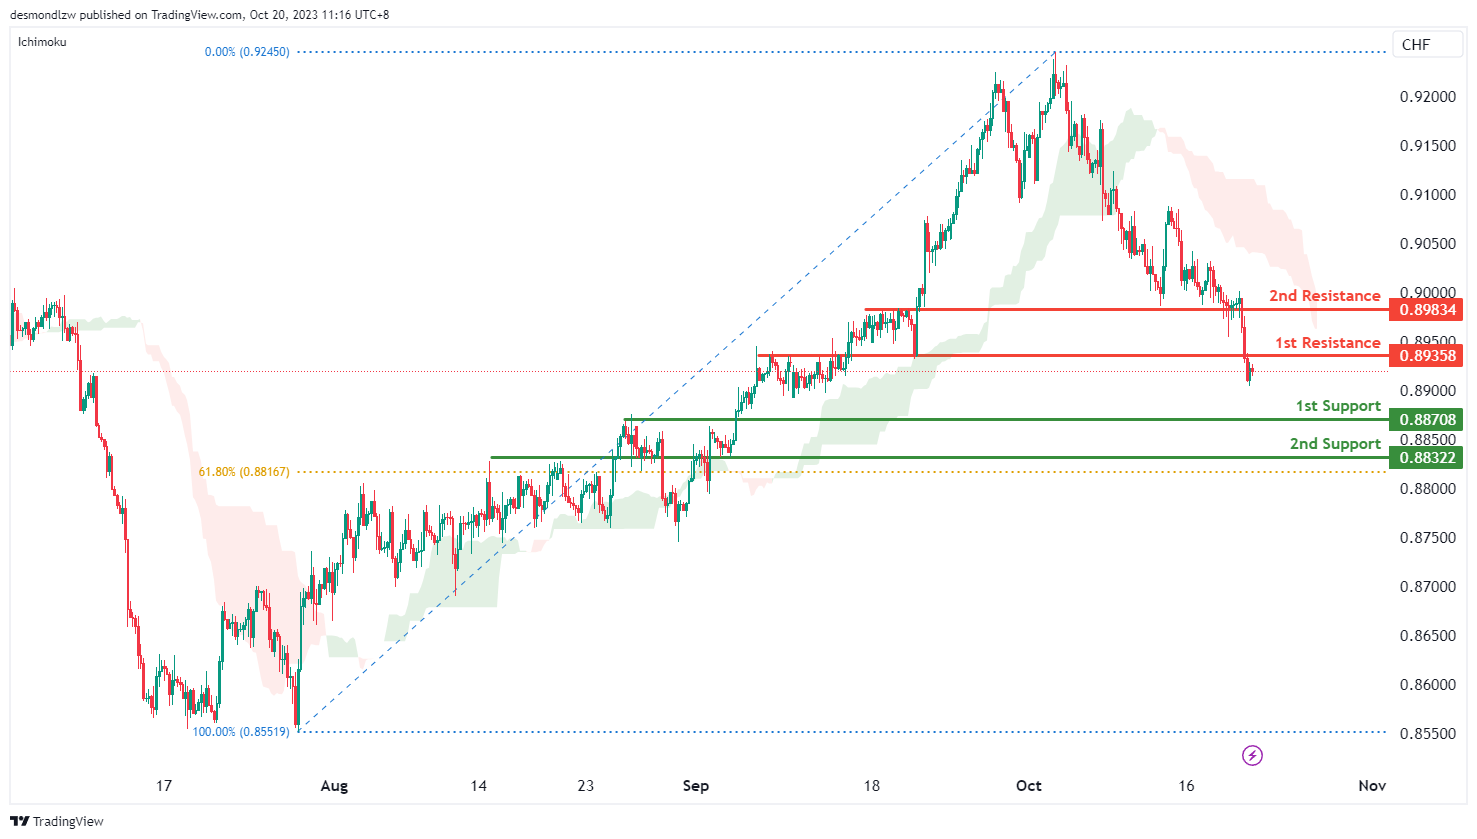
The USD/CHF chart currently indicates a bearish momentum, with price trading under the bearish Ichimoku cloud. This factor suggests a potential scenario for price to make a bearish reaction off the 1st resistance level and drop down towards the 1st support level.
The 1st resistance level at 0.8936 is characterized as an overlap resistance. Beyond this, the 2nd resistance level at 0.8983 is also identified as an overlap resistance, potentially acting as a barrier to further bullish advances.
To the downside, the 1st support level at 0.8871 is identified as a pullback support. Additionally, the 2nd support level at 0.8832 is noted as an overlap support that aligns close to the 61.80% Fibonacci retracement level, reinforcing the strength of potential support.
USD/JPY:
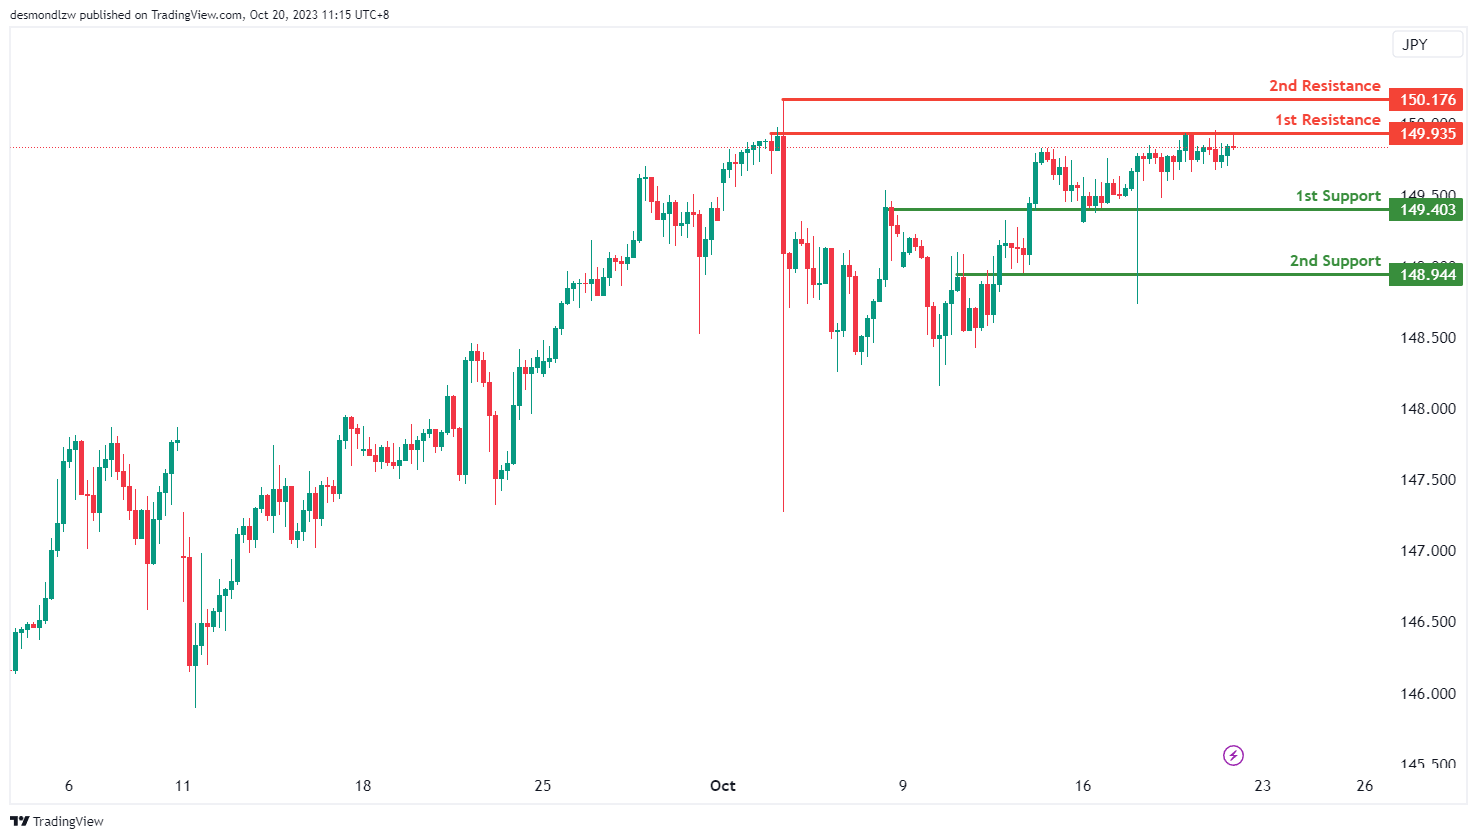
The USD/JPY chart currently shows a neutral momentum, with a potential for price to fluctuate between the 1st resistance and the 1st support levels.
The 1st resistance level at 149.94 is characterized as a pullback resistance level. Beyond this, the 2nd resistance level at 150.18 is identified as a swing-high resistance, potentially acting as a barrier to further bullish advances.
To the downside, the 1st support level at 149.40 is identified as an overlap support. Additionally, the 2nd support level at 148.94 is also noted as an overlap support, providing a strong foundation of potential support.
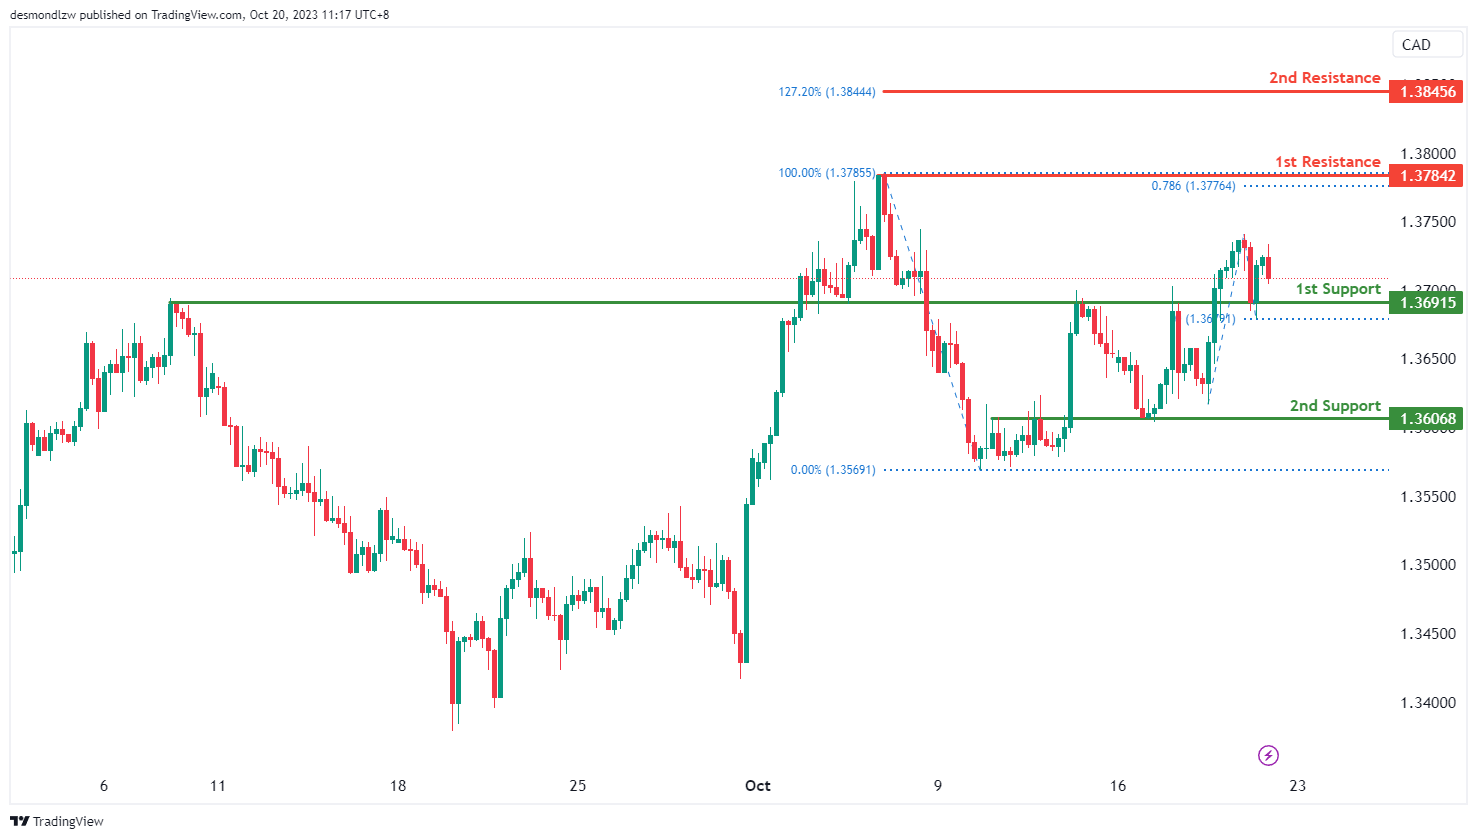
USD/CAD:
The USD/CAD chart currently exhibits a bullish momentum, suggesting a potential scenario for price to pull back towards the 1st support level before making a bullish bounce towards the 1st resistance level.
The 1st support level at 1.3692 is identified as an overlap support. Additionally, the 2nd support level at 1.3607 is also noted as an overlap support, adding to its significance as a potential support zone.
To the upside, the 1st resistance level at 1.3784 is identified as a swing-high resistance that aligns with the 78.60% Fibonacci projection level. Higher up, the 2nd resistance level at 1.3846 is noted as a resistance level that aligns with the 127.20% Fibonacci extension level, potentially acting as a barrier to further bullish advances.
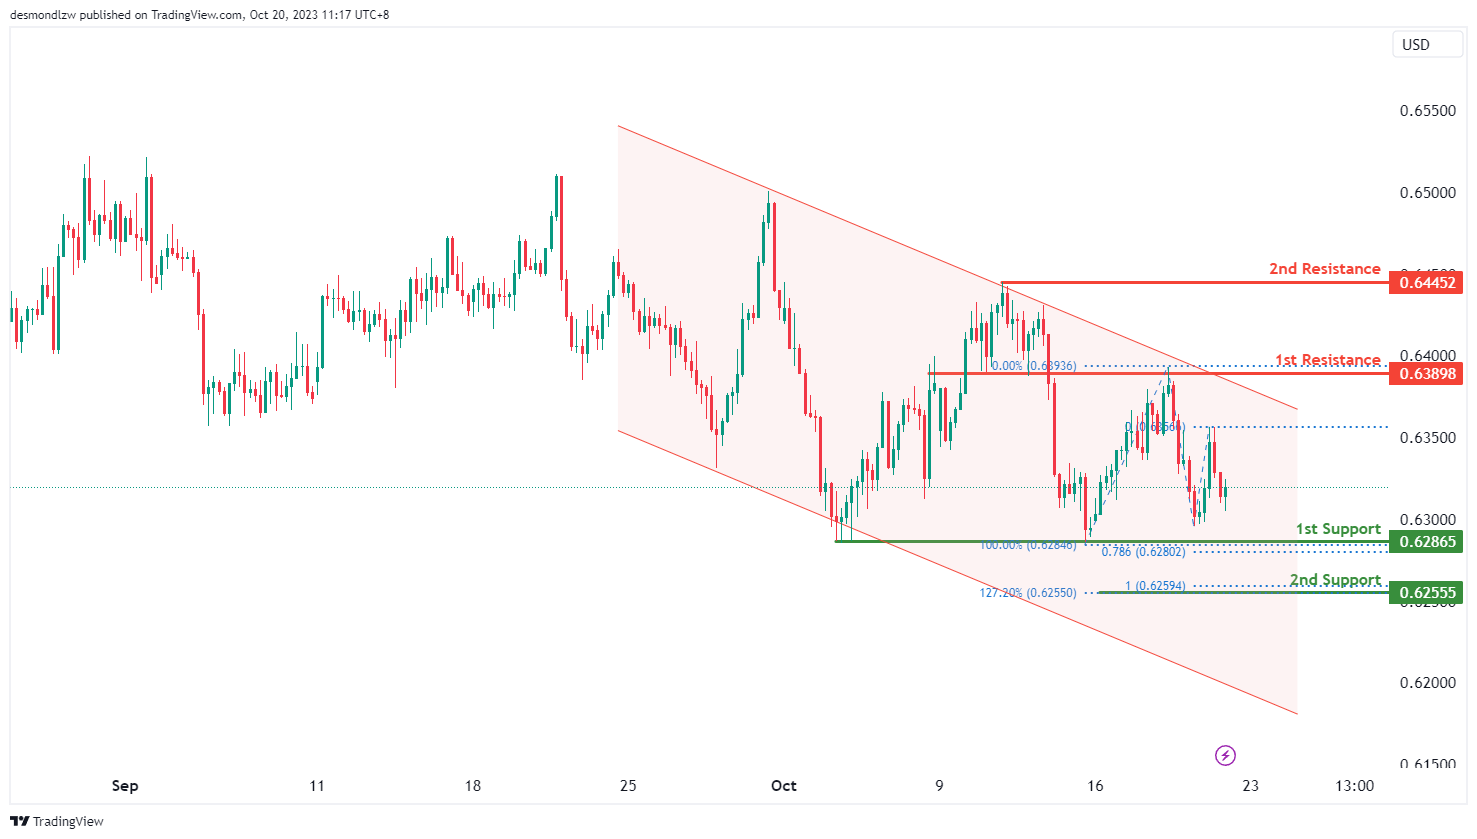
AUD/USD:
The AUD/USD chart currently exhibits a bearish momentum, with price trading within a bearish channel. This factor indicates a potential scenario for price to make a bearish continuation towards the 1st support level.
The 1st support level at 0.6287 is identified as a multi-swing-low support that aligns with the 78.60% Fibonacci projection level. Additionally, the 2nd support level at 0.6256 is marked as a support level that aligns with a confluence of Fibonacci levels i.e. the 127.20% extension and the 100.00% projection levels, further reinforcing its importance as a potential support area.
To the upside, the 1st resistance level at 0.6389 is identified as an overlap resistance. Beyond this, the 2nd resistance level at 0.6445 is marked as a swing-high resistance, making it a potentially strong resistance level.
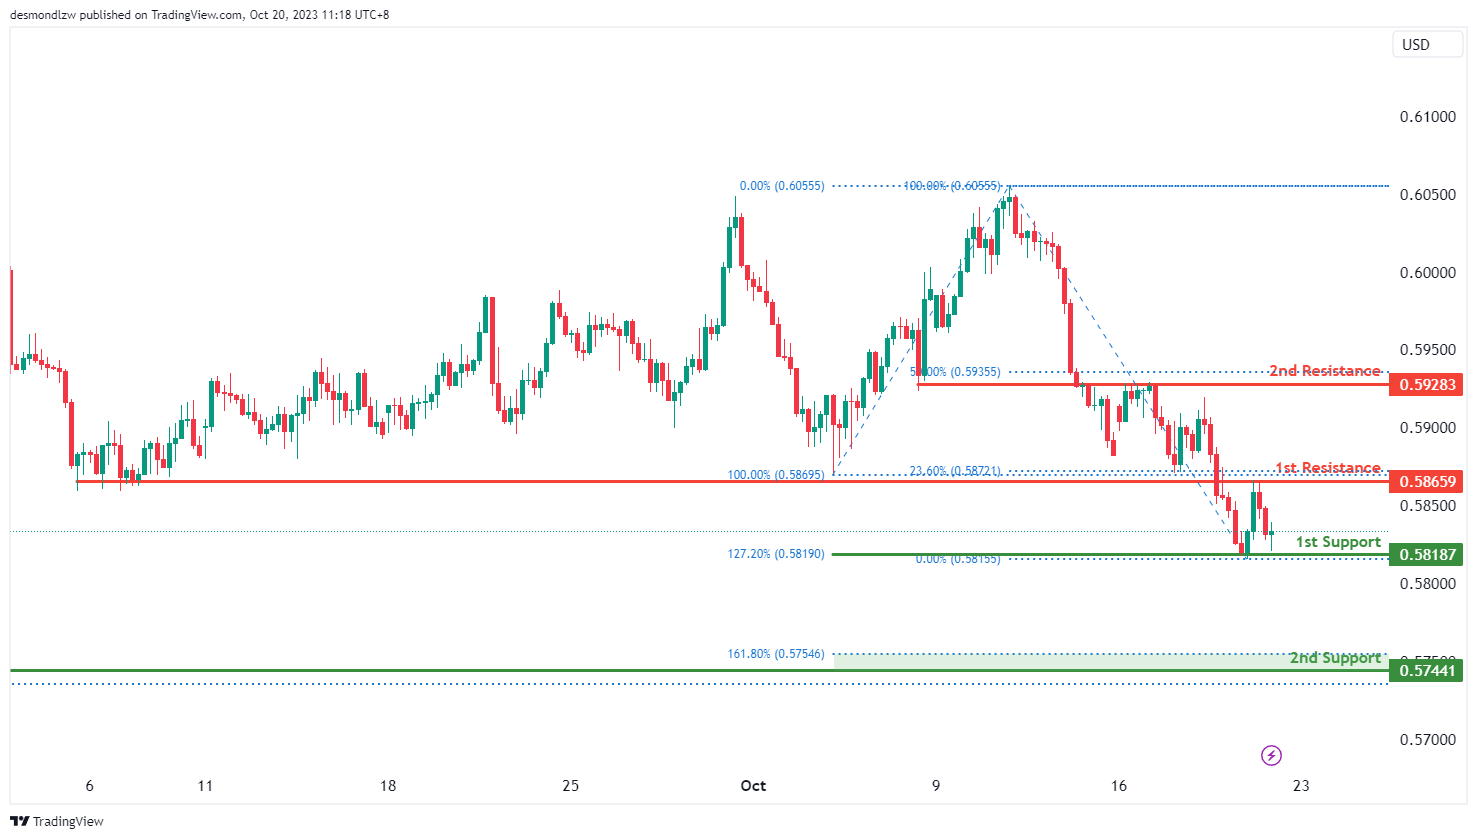
NZD/USD
The NZD/USD chart currently exhibits a bearish momentum, suggesting a potential scenario for price to make a bearish continuation towards the 1st support level.
The 1st support level at 0.5819 is identified as a pullback support that aligns with the 127.20% Fibonacci extension level. Further below, the 2nd support level at 0.5744 is also noted as a pullback support that aligns with the 161.80% Fibonacci extension level, indicating a potential support zone.
To the upside, the 1st resistance level at 0.5866 is identified as an overlap resistance that aligns with the 23.60% Fibonacci retracement level. Beyond this, the 2nd resistance level at 0.5928 is also marked as an overlap resistance that aligns with the 50.00% Fibonacci retracement level, making it a potentially strong resistance level.
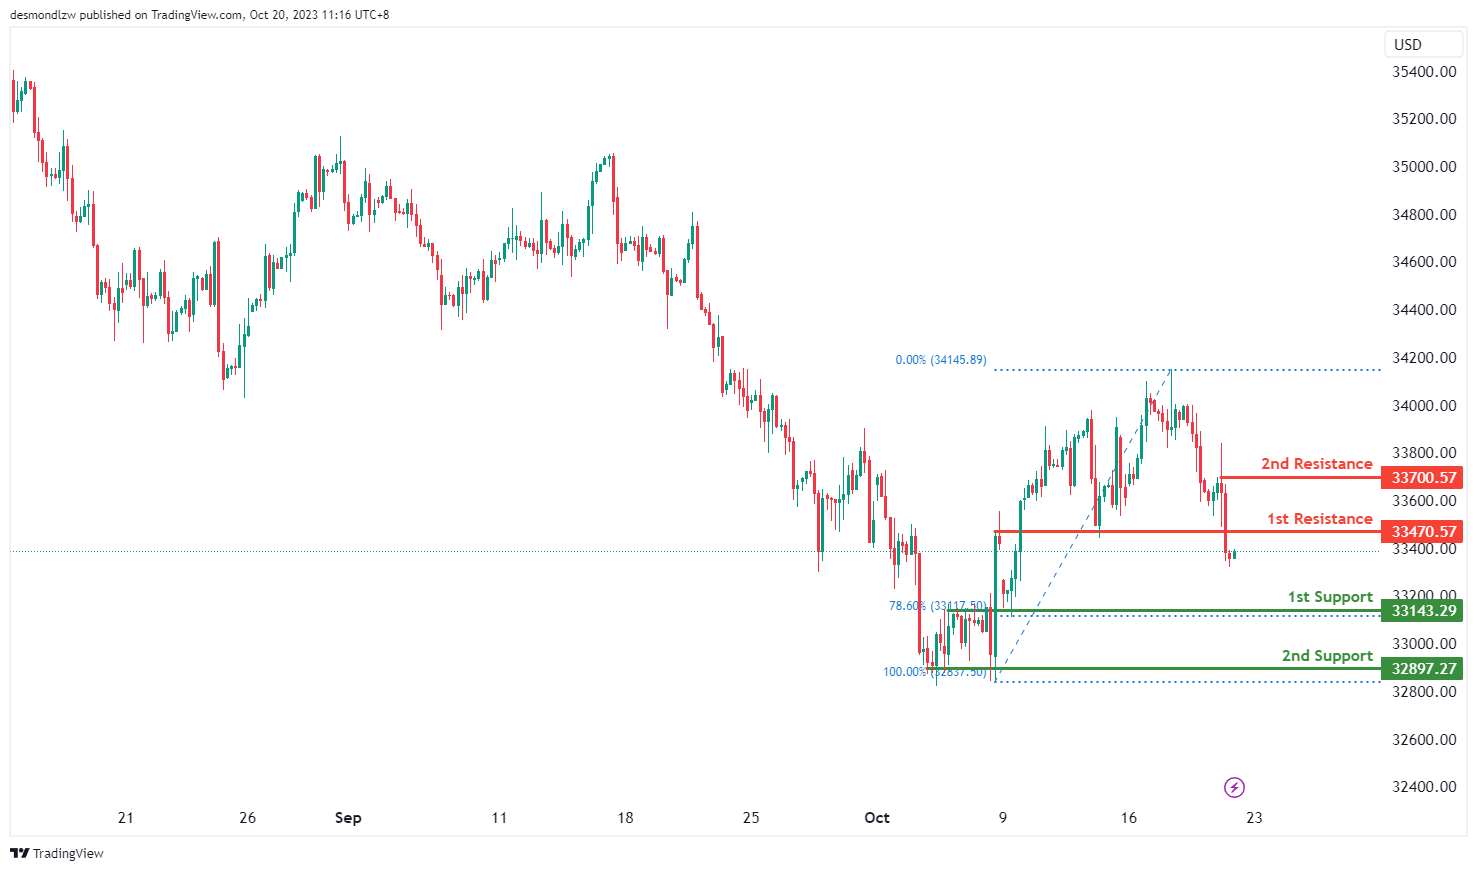
DJ30:
The instrument we are analyzing is DJ30, and the overall momentum of the chart indicates a bearish trend.
There is a possibility that the price may experience a bearish reaction when approaching the first resistance level and subsequently drop to the first support level.
The first support level is at 33143.29, and it’s considered strong because it represents an overlap of support and aligns with a 78.60% Fibonacci Retracement.
The second support level is at 32897.27, and it’s also significant as it marks a multi-swing low support.
On the resistance side, the first resistance level is at 33470.57, and it’s noteworthy because it represents an overlap of resistance.
The second resistance level is at 33700.57, and it’s significant as well, as it functions as a pullback resistance.
GER40:
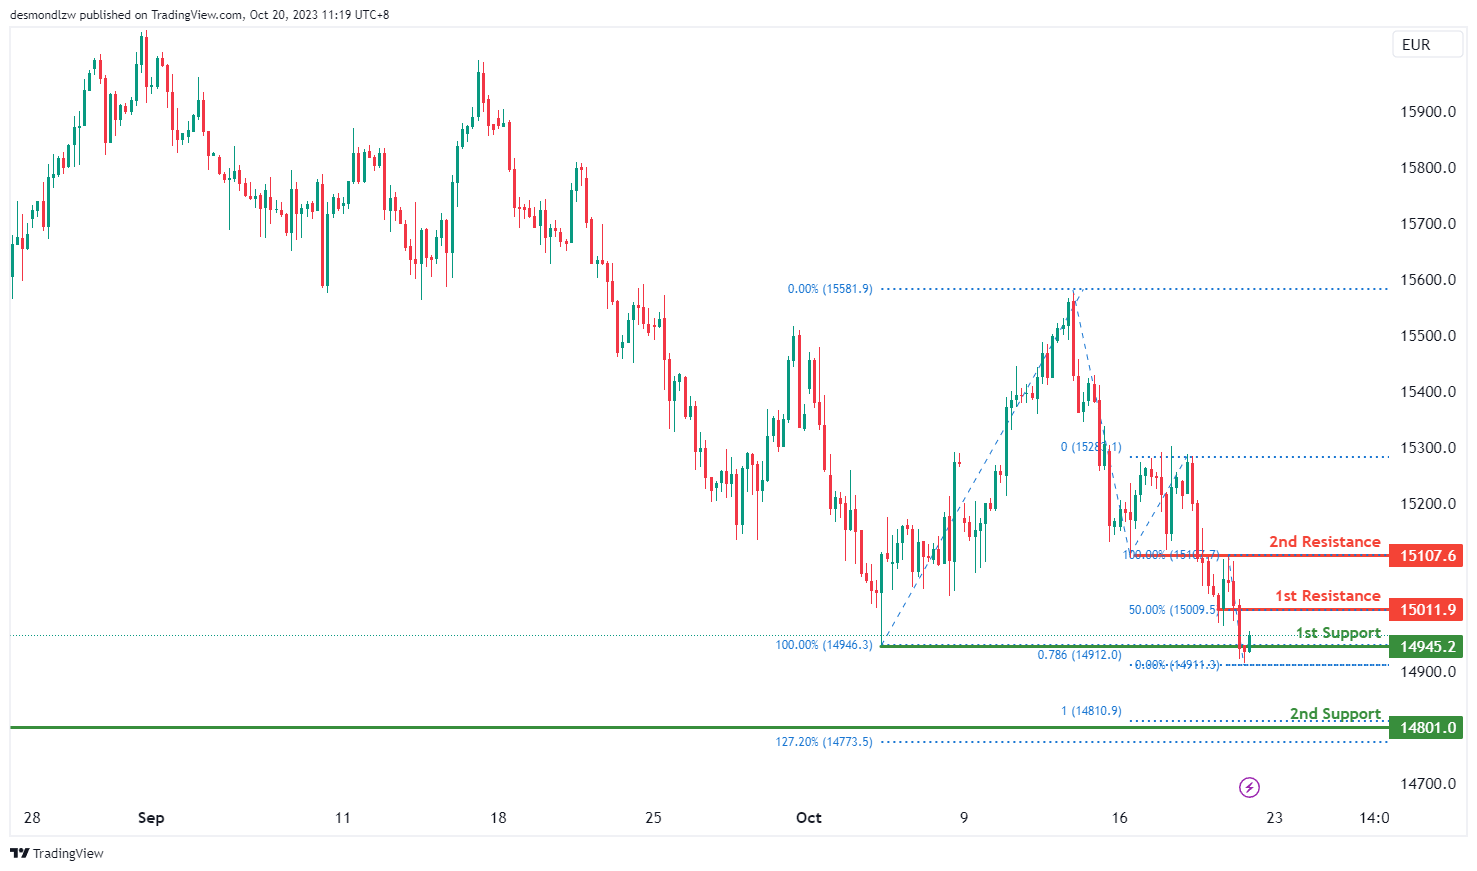
The instrument we are examining is GER40, and the overall momentum of the chart indicates a bearish trend.
There is a possibility that the price may initially rise towards the first resistance level in the short term before reversing off it and dropping towards the first support level.
The first support level is at 14945.20, and it’s considered strong because it represents a multi-swing low support and aligns with a 78.60% Fibonacci Projection.
The second support level is at 14801.00, and it’s also significant as it marks a swing low support and corresponds to a 100% Fibonacci Projection and a 127.20% Fibonacci Extension, indicating a Fibonacci confluence.
On the resistance side, the first resistance level is at 15011.90, and it’s noteworthy because it represents a pullback resistance and is associated with a 50% Fibonacci Retracement.
The second resistance level is at 15107.60, and it’s significant as well, as it functions as an overlap resistance.
US500
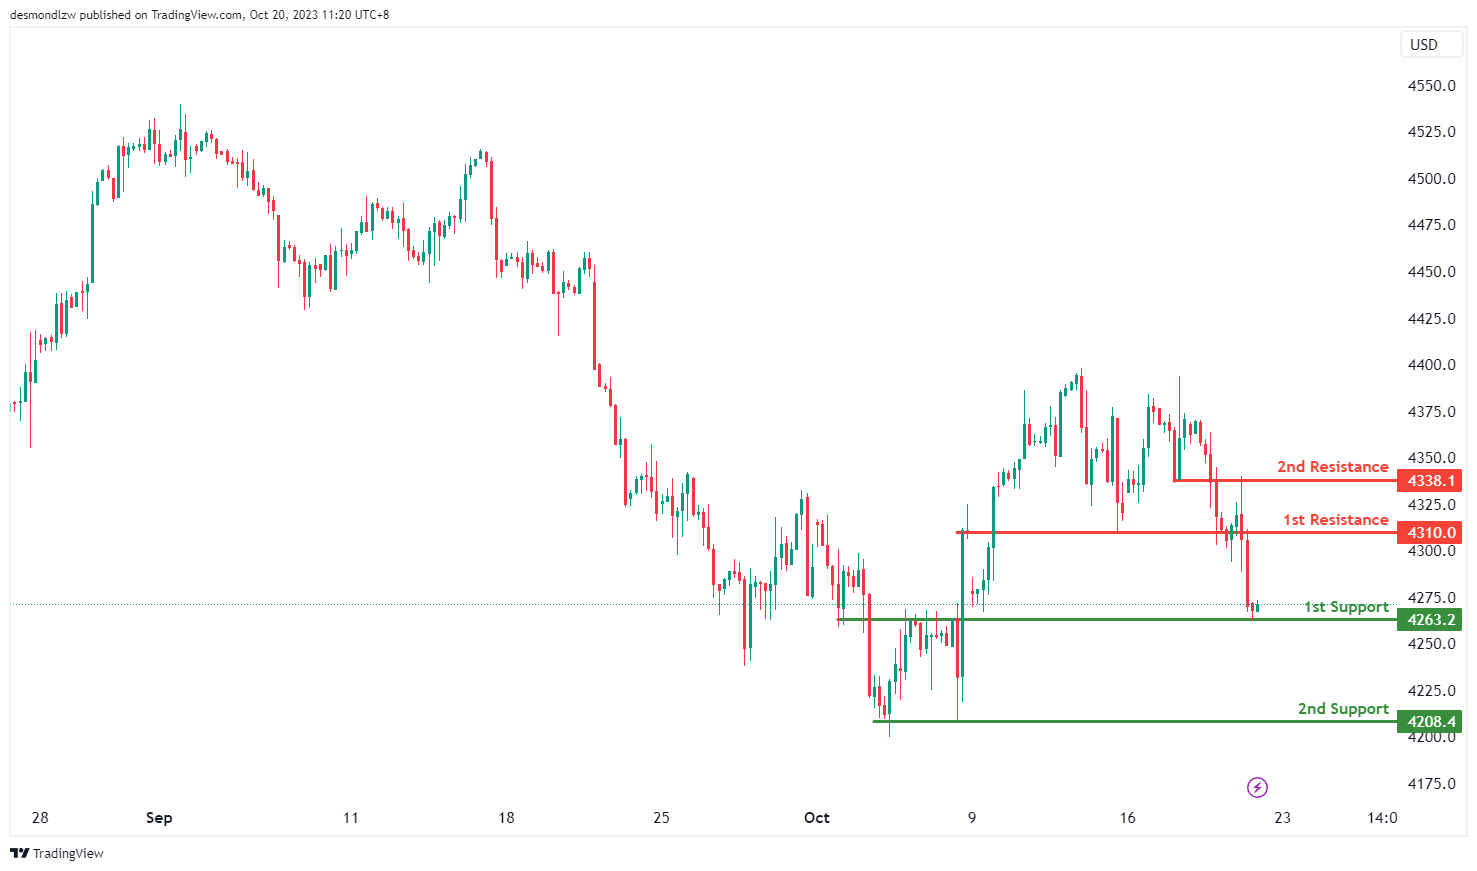
The instrument we are analyzing is US500, and the overall momentum of the chart indicates a bullish trend.
There is a possibility that the price may experience a bullish bounce when approaching the first support level and then head towards the first resistance level.
The first support level is at 4263.2, and it’s considered strong because it represents an overlap of support.
The second support level is at 4208.4, and it’s also significant as it marks a multi-swing low support.
On the resistance side, the first resistance level is at 4310.0, and it’s noteworthy because it represents an overlap of resistance.
The second resistance level is at 4338.1, and it’s significant as well, as it functions as an overlap resistance.
BTC/USD:
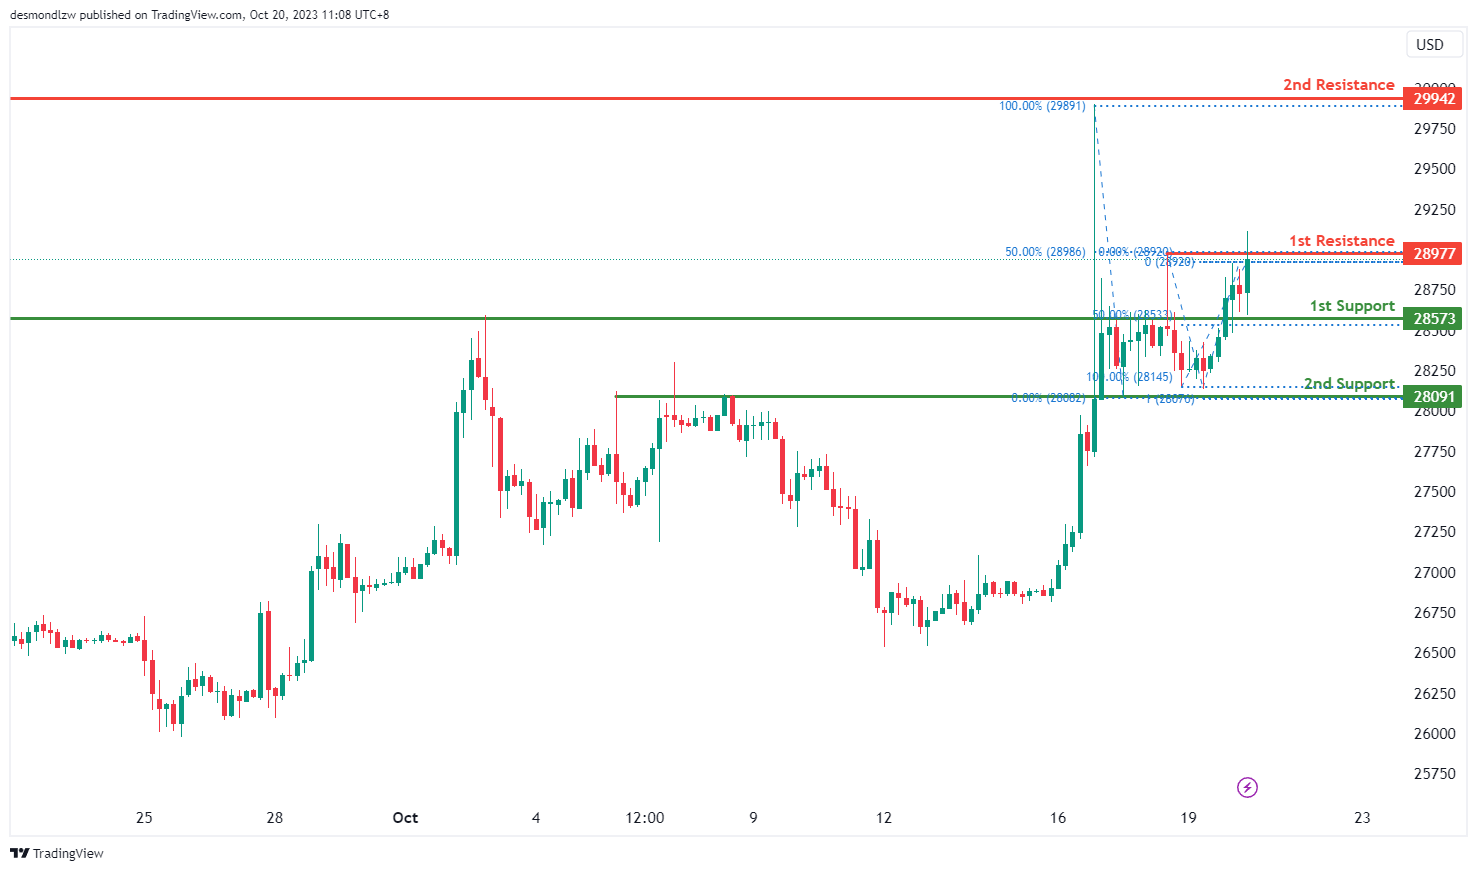
The instrument we are analyzing is BTC/USD, and the overall momentum of the chart indicates a bearish trend.
There is a possibility that the price may experience a bearish reaction when approaching the first resistance level and subsequently drop to the first support level.
The first support level is at 28573, and it’s considered strong because it represents an overlap of support and aligns with a 50% Fibonacci Retracement.
The second support level is at 28091, and it’s also significant as it marks another overlap of support and corresponds to a 100% Fibonacci Projection.
On the resistance side, the first resistance level is at 28977, and it’s noteworthy because it represents a swing high resistance and is associated with a 50% Fibonacci Retracement.
The second resistance level is at 29942, and it’s significant as well, as it represents a multi-swing high resistance.
ETH/USD:
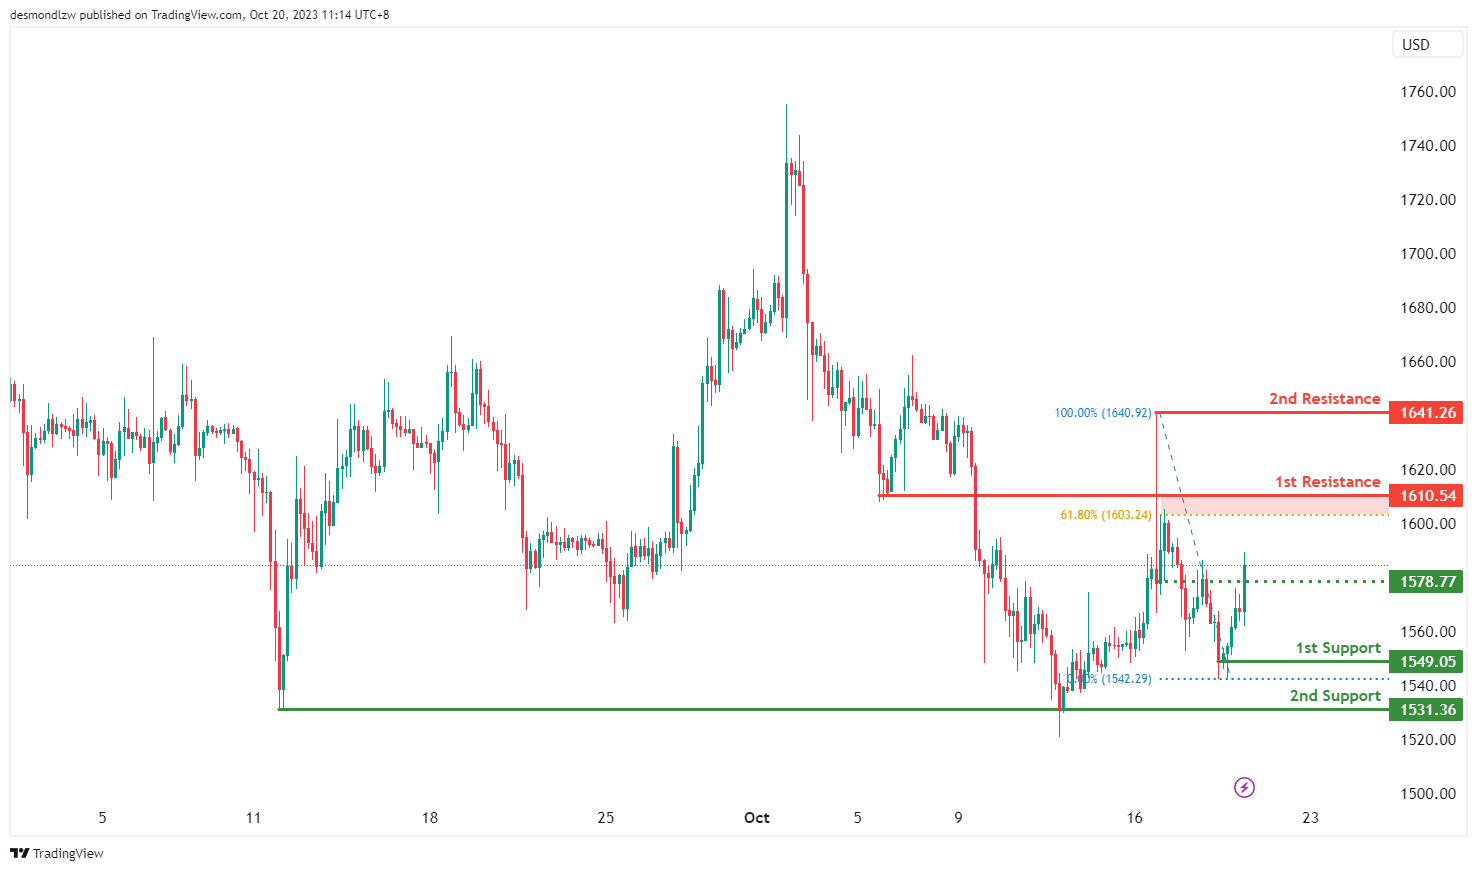
The instrument under analysis is ETH/USD, and the overall momentum of the chart indicates a bullish trend.
There is a possibility that the price may experience a bullish break through the first resistance level and subsequently rise to the second resistance level.
The first support level is at 1,548.68, and it’s considered strong because it represents a swing low support.
The second support level is at 1,531.36, and it’s also significant as it marks a multi-swing low support.
On the resistance side, the first resistance level is at 1,578.77, and it’s noteworthy because it represents an overlap of resistance.
The second resistance level is at 1,610.54, and it’s significant as well, as it functions as an overlap resistance and coincides with a 61.80% Fibonacci Retracement.
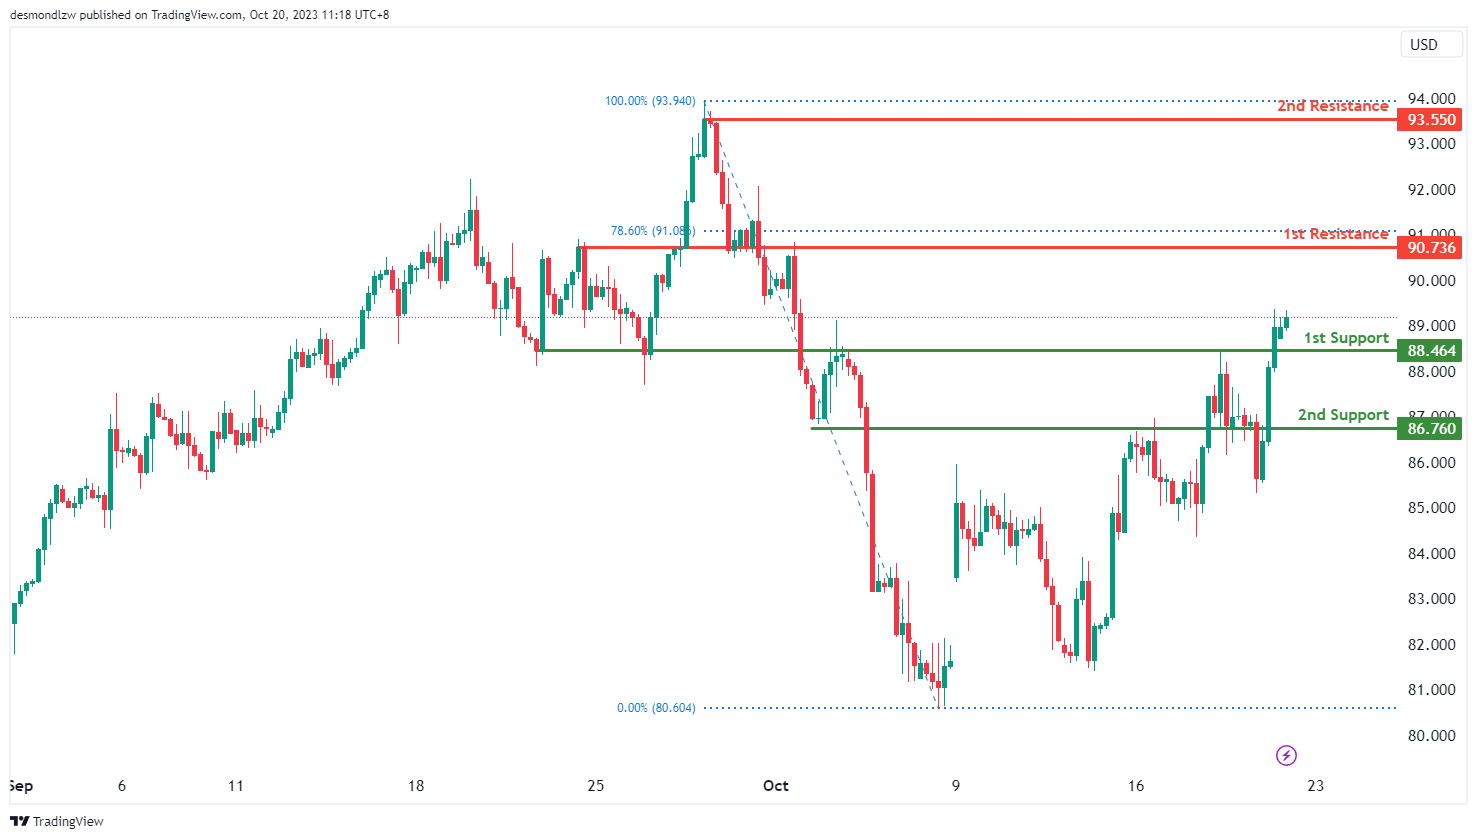
WTI/USD:
The WTI chart currently shows a bullish momentum, indicating a potential scenario for price to make a bullish continuation towards the 1st resistance level.
The 1st resistance level at 90.74 is identified as an overlap resistance that aligns close to the 78.60% Fibonacci retracement level. Beyond this, the 2nd resistance level at 93.55 is marked as a swing-high resistance, making it a potentially strong resistance level.
To the downside, the 1st support level at 88.46 is identified as an overlap support level. Additionally, the 2nd support level at 86.76 is also noted as an overlap support, indicating a potential support zone.
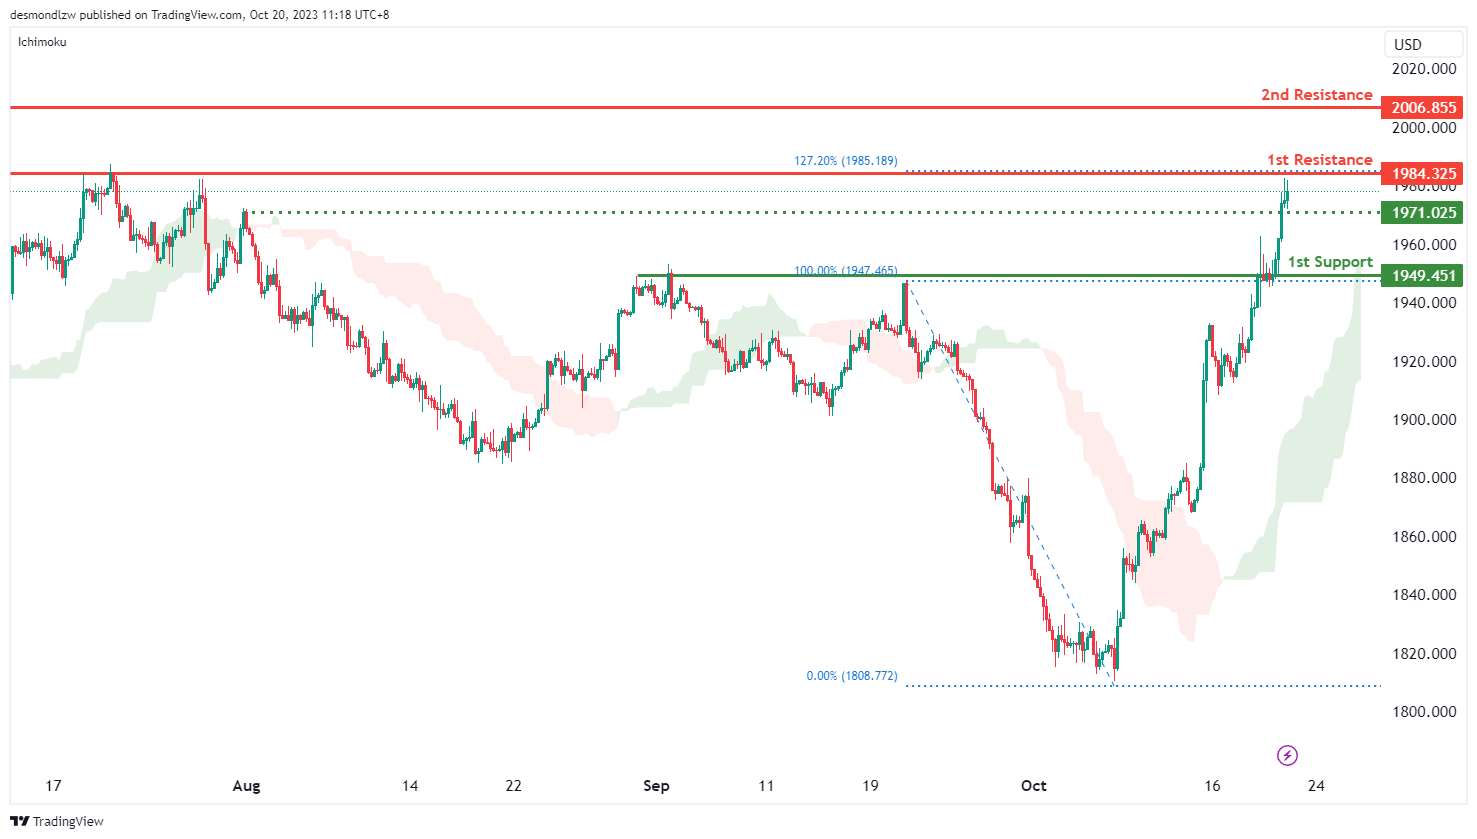
XAU/USD (GOLD):
The Gold (XAU/USD) chart currently exhibits a bullish momentum, with price trading above the bullish Ichimoku cloud. There is a potential scenario for price to make a bullish continuation towards the 1st resistance level.
The 1st resistance level at 1,984.33 is characterized as a pullback resistance that coincides with the 127.20% Fibonacci retracement level. Beyond this, the 2nd resistance level at 2,006.86 is identified as an overlap resistance, providing a strong potential resistance point.
To the downside, the intermediate support at 1,971.03 is noted as a pullback support. Additionally, the 1st support level at 1,949.45 is marked as an overlap support, indicating a potential support zone.


