
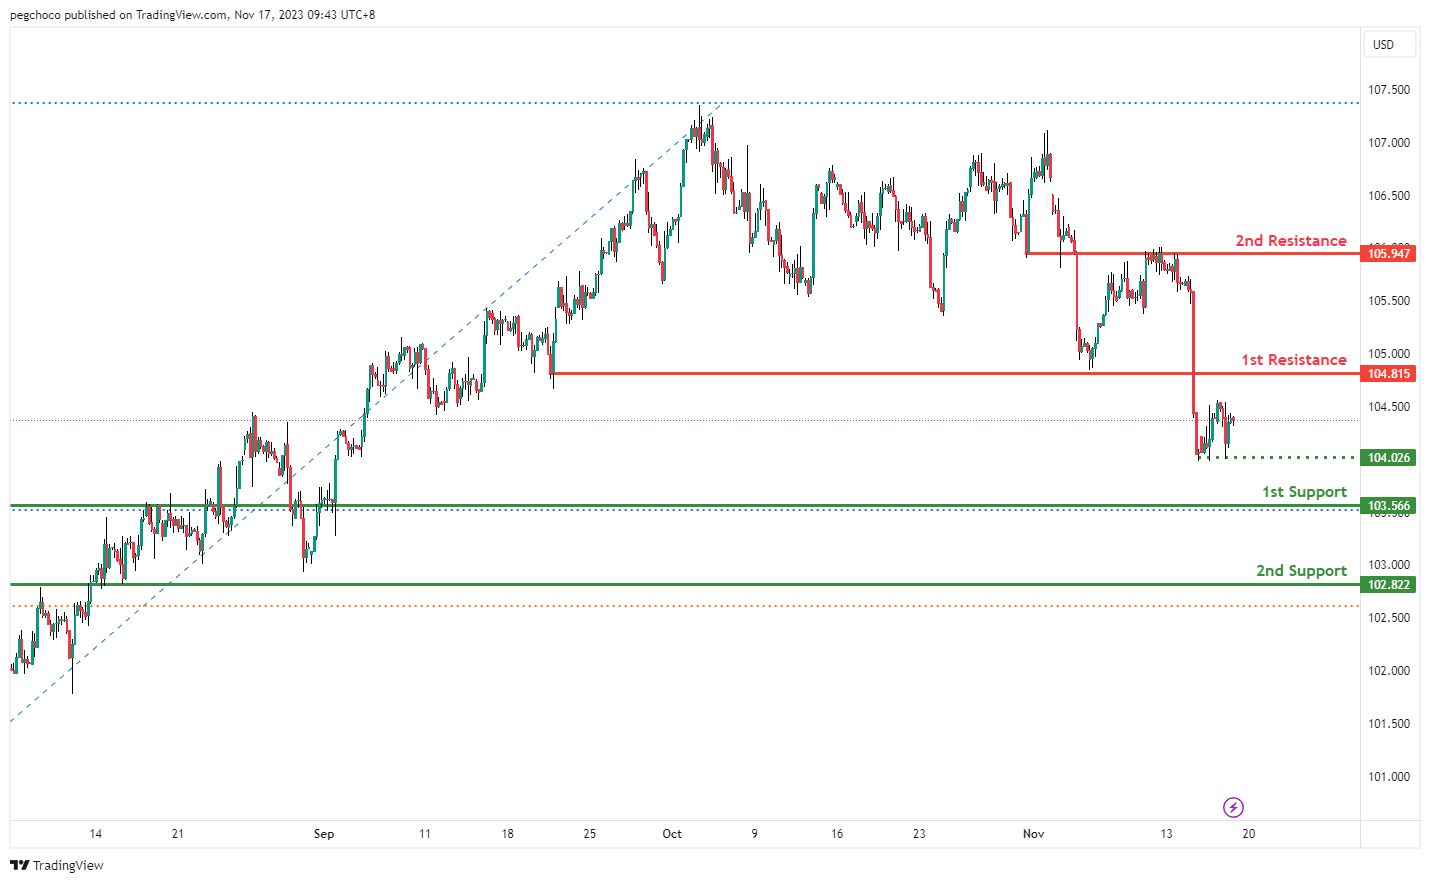
DXY:
The DXY chart currently has a bearish overall momentum, but there is a potential for a bullish continuation towards the 1st resistance.
The 1st support at 103.56 is identified as an overlap support and also coincides with the 50% Fibonacci retracement level. This level suggests a potential area of support where buyers might step in or where a pause in the bearish movement could occur. The confluence of an overlap support and Fibonacci retracement level makes it a significant support level.
The 2nd support at 102.82 is another overlap support and coincides with the 61.80% Fibonacci retracement level. Similar to the 1st support, this level also indicates potential support and adds to the significance of this price zone.
On the resistance side, the 1st resistance at 104.81 is categorized as a pullback resistance. This level may act as a barrier to further upward movement and is an area where selling interest could potentially emerge.
The 2nd resistance at 105.94 is noted as an overlap resistance, suggesting potential selling pressure in this area.
Intermediate support at 104.02 is a multi-swing low support and could serve as an additional level to watch.
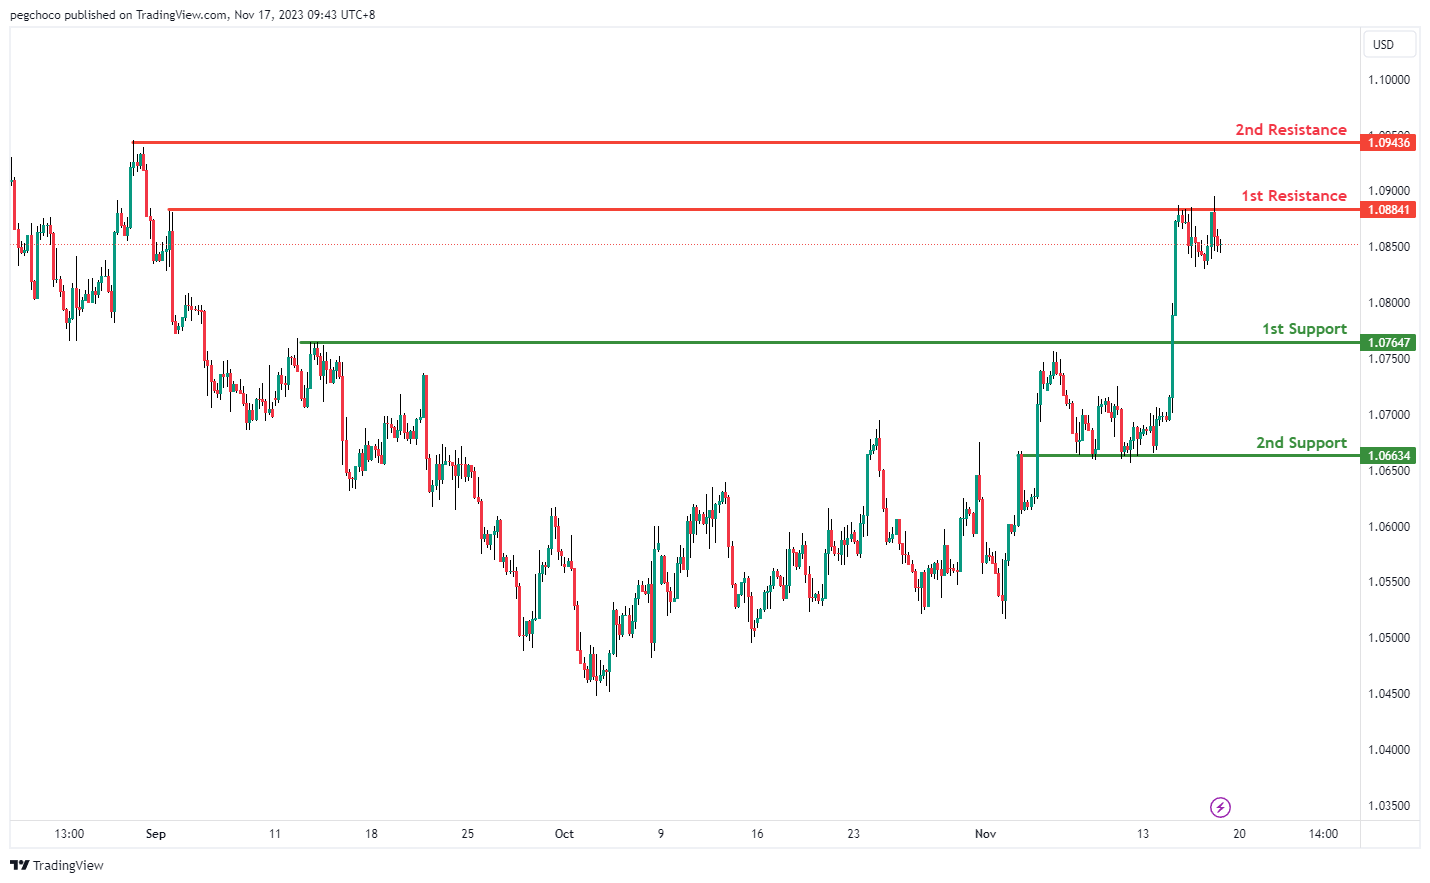
EUR/USD:
The EUR/USD chart currently has a bearish overall momentum, suggesting the potential for a bearish continuation towards the 1st support.
The 1st support at 1.0764 is identified as a pullback support. This level indicates a potential area where buyers might step in or where the bearish movement could find temporary support.
The 2nd support at 1.0663 is an overlap support. Overlap supports often carry significance as they represent areas where price has previously found support or resistance, making it a relevant support level.
On the resistance side, the 1st resistance at 1.0884 is categorized as a multi-swing high resistance. This level may act as a barrier to further upward movement and could be a point where selling interest emerges.
The 2nd resistance at 1.0943 is noted as a swing high resistance, further reinforcing its potential as a level where the price might encounter selling pressure.
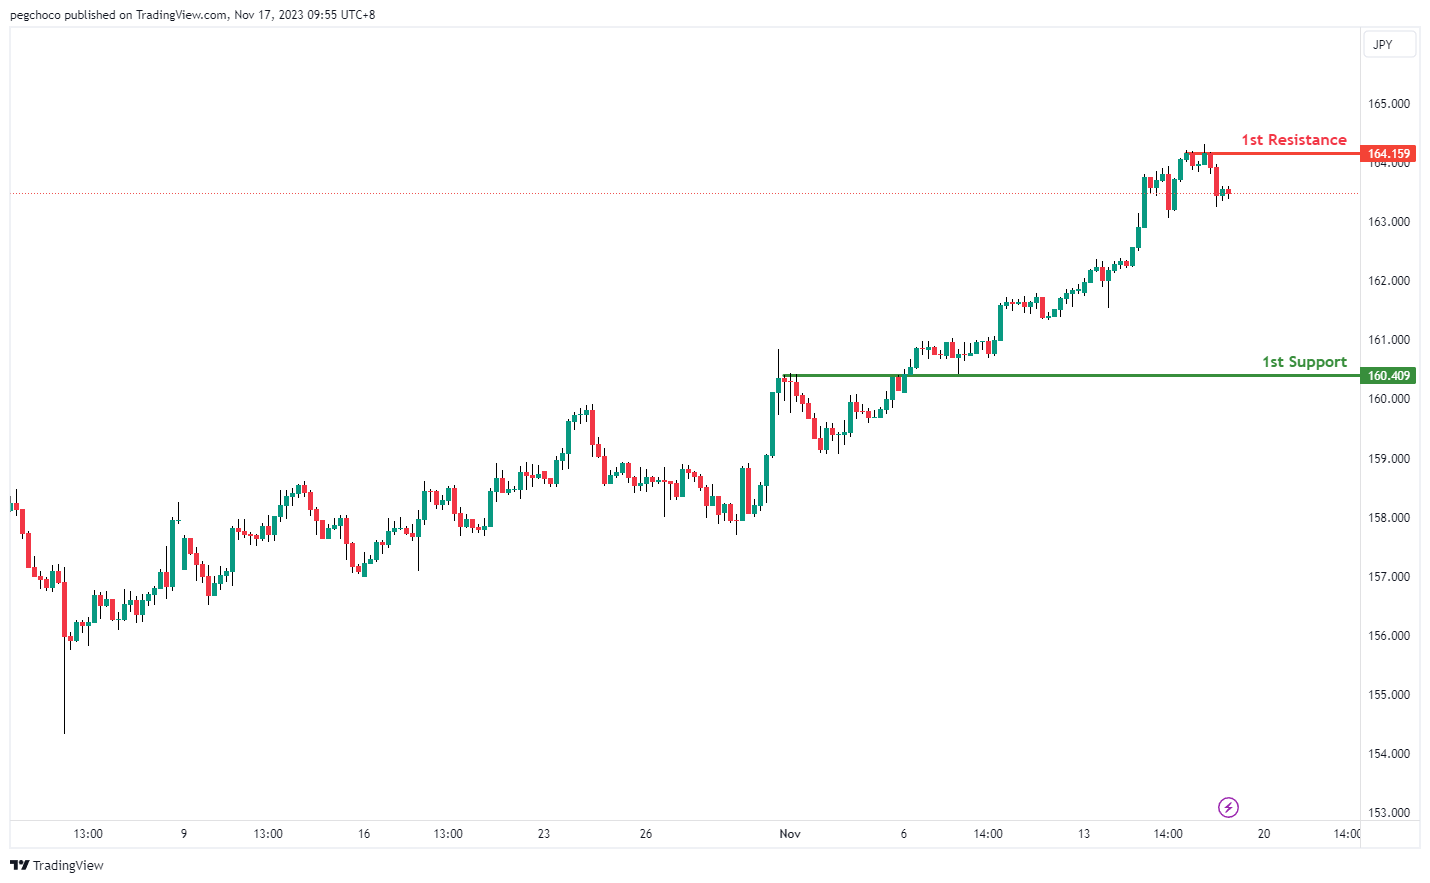
EUR/JPY:
The EUR/JPY chart currently exhibits a bearish overall momentum, suggesting the potential for a bearish reaction off the 1st resistance level, followed by a drop towards the 1st support.
The 1st support at 160.40 is identified as an overlap support. This level may have historical significance as an area where buyers have previously shown interest, making it a relevant support level.
On the resistance side, the 1st resistance at 164.15 is categorized as a multi-swing high resistance. This suggests that it has historically acted as a barrier to further upward movements.
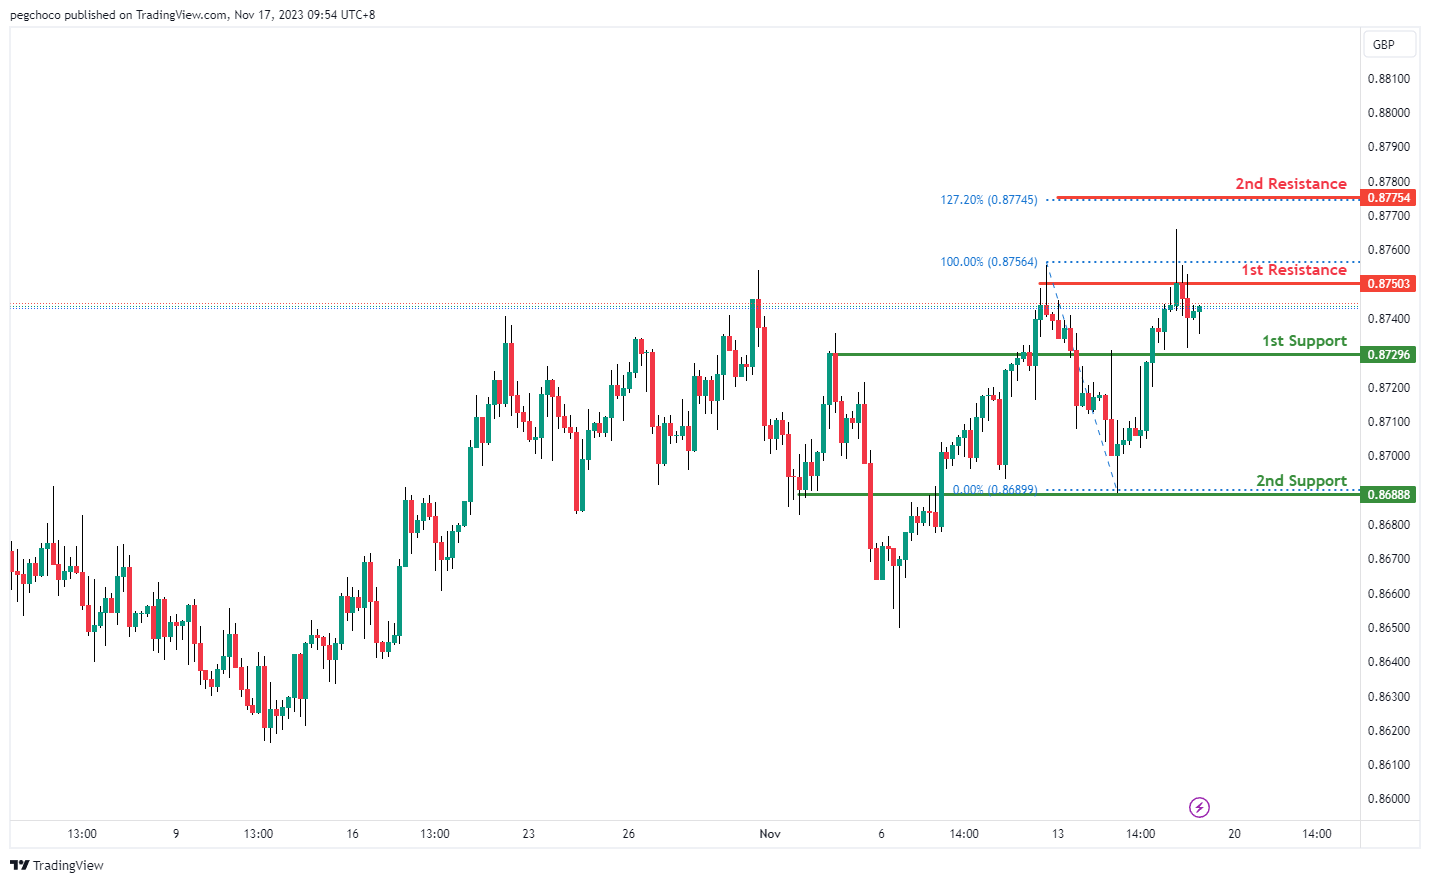
EUR/GBP:
The EUR/GBP chart currently displays a bearish overall momentum, indicating the potential for a bearish reaction off the 1st resistance level, followed by a drop towards the 1st support.
The 1st support at 0.8729 is identified as an overlap support. This level has historical significance as an area where buyers have previously stepped in, making it a relevant support level.
The 2nd support at 0.8688 is another overlap support, reinforcing its potential as a support level. Multiple instances of price reacting at this level in the past suggest its importance.
On the resistance side, the 1st resistance at 0.8750 is categorized as a multi-swing high resistance, indicating that it has historically acted as a barrier to further upward movement.
The 2nd resistance at 0.8775 coincides with the 127.20% Fibonacci Extension level, indicating potential resistance based on Fibonacci analysis. This level adds another layer of significance to the resistance.
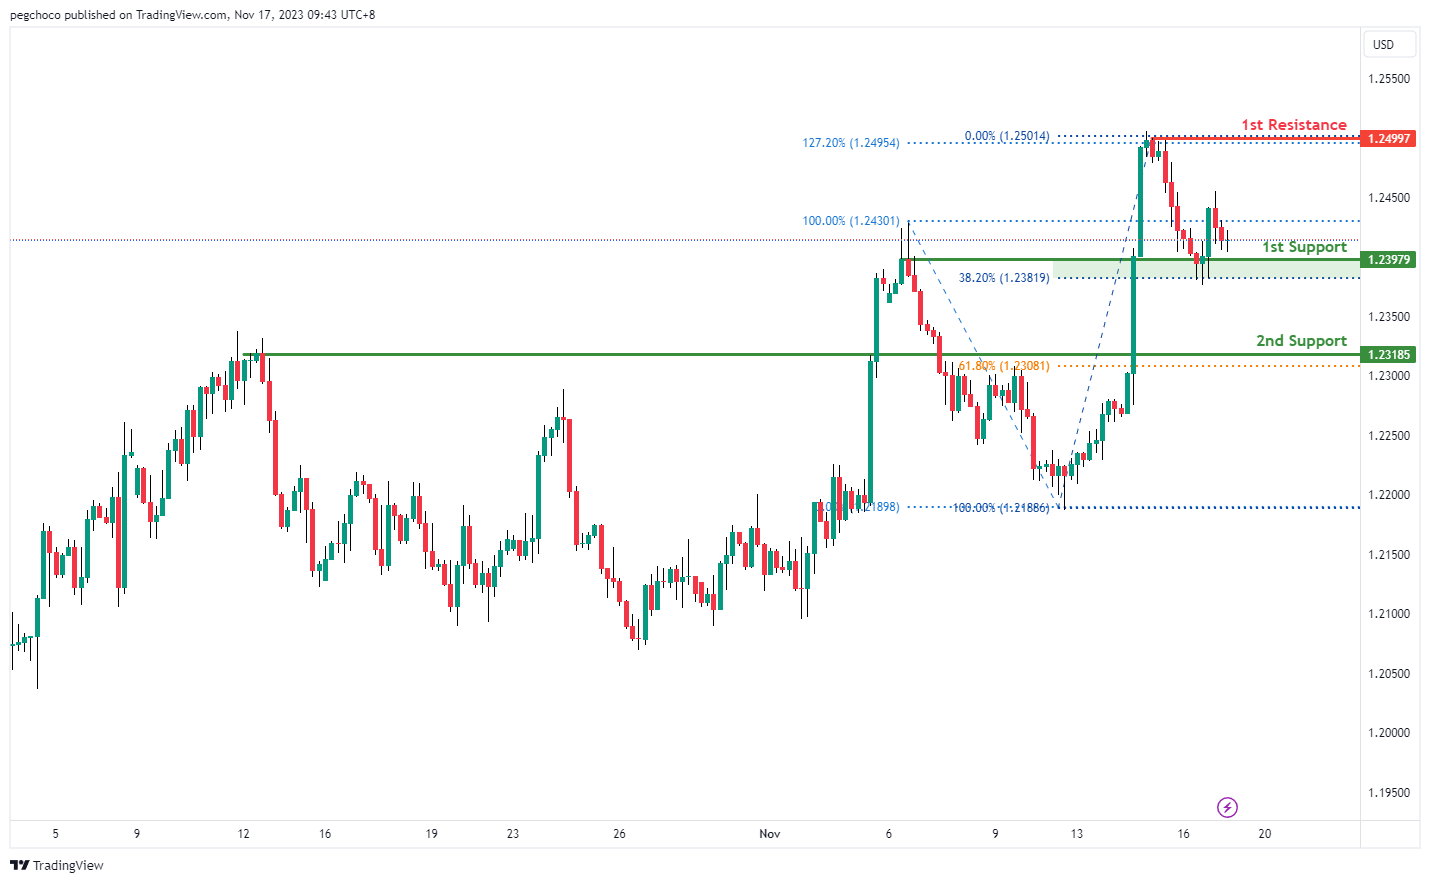
GBP/USD:
The GBP/USD chart currently has a bullish overall momentum, suggesting the potential for a bullish continuation towards the 1st resistance.
The 1st support at 1.23979 is identified as a pullback support and coincides with the 38.20% Fibonacci Retracement level. This confluence of support factors makes it a significant level where buyers may step in or where the bullish movement could find temporary support.
The 2nd support at 1.23185 is also a pullback support and coincides with the 61.80% Fibonacci Retracement level, adding to its significance as a potential support level.
On the resistance side, the 1st resistance at 1.2499 is categorized as a swing high resistance. This level, along with the 127.20% level, suggests that there could be selling interest in this area, potentially acting as a barrier to further upward movement.
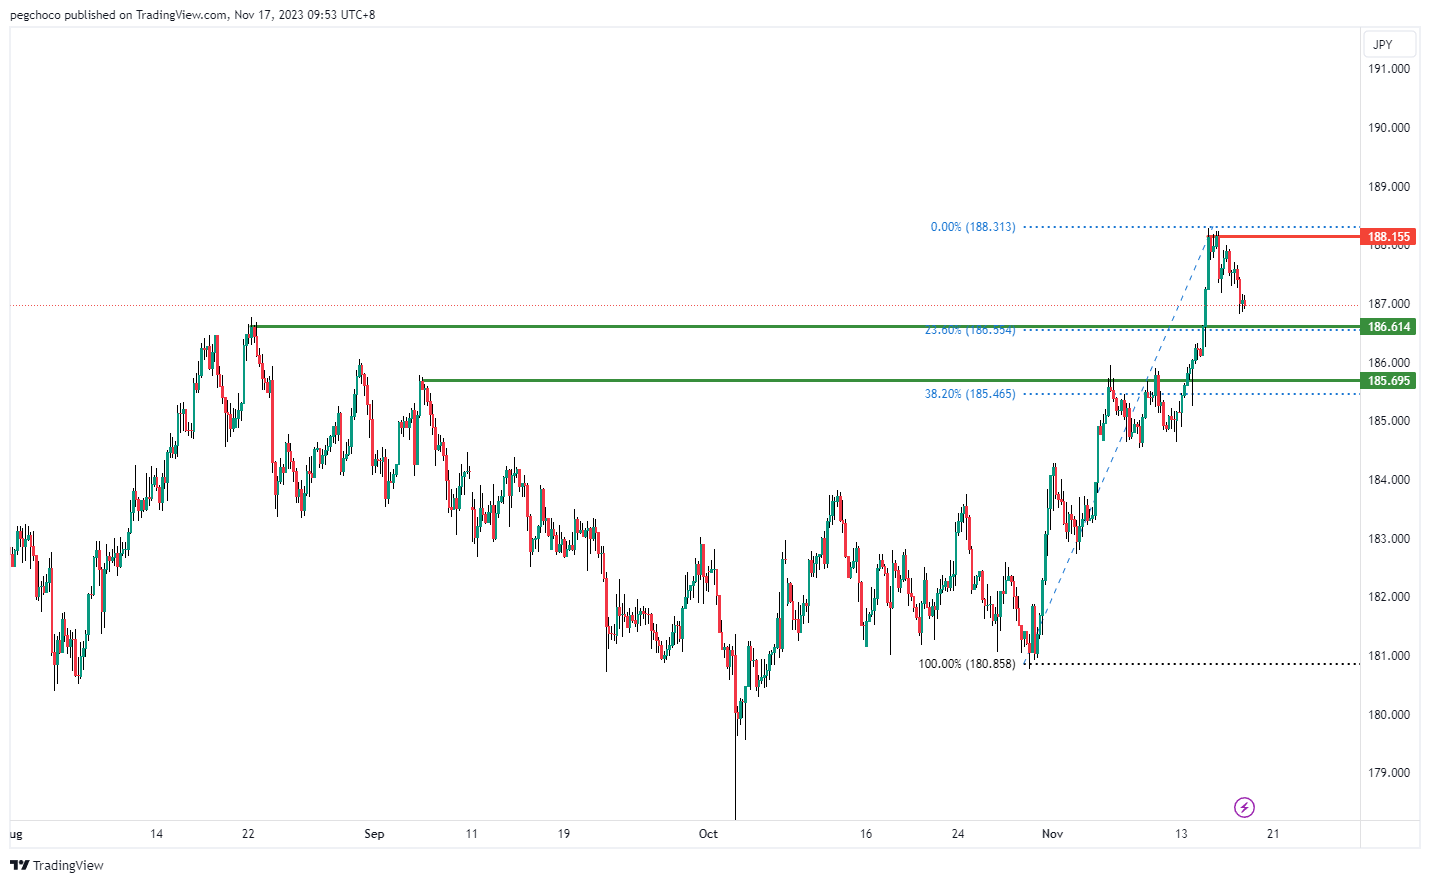
GBP/JPY:
The GBP/JPY chart currently shows a bullish overall momentum, suggesting the potential for a bullish bounce off the 1st support and a move towards the 1st resistance level.
The 1st support at 186.61 is considered a pullback support and coincides with the 23.60% Fibonacci Retracement level. This level indicates a potential area of support where buyers may step in, and it aligns with a Fibonacci level, adding to its significance.
The 2nd support at 185.69 is another pullback support, and it aligns with the 38.20% Fibonacci Retracement level. This further reinforces its potential as a support level and suggests that it could act as a barrier against a significant downside move.
On the resistance side, the 1st resistance at 188.15 is categorized as a multi-swing high resistance, indicating a historical area where selling interest has been observed. Traders may anticipate some selling pressure in this area.
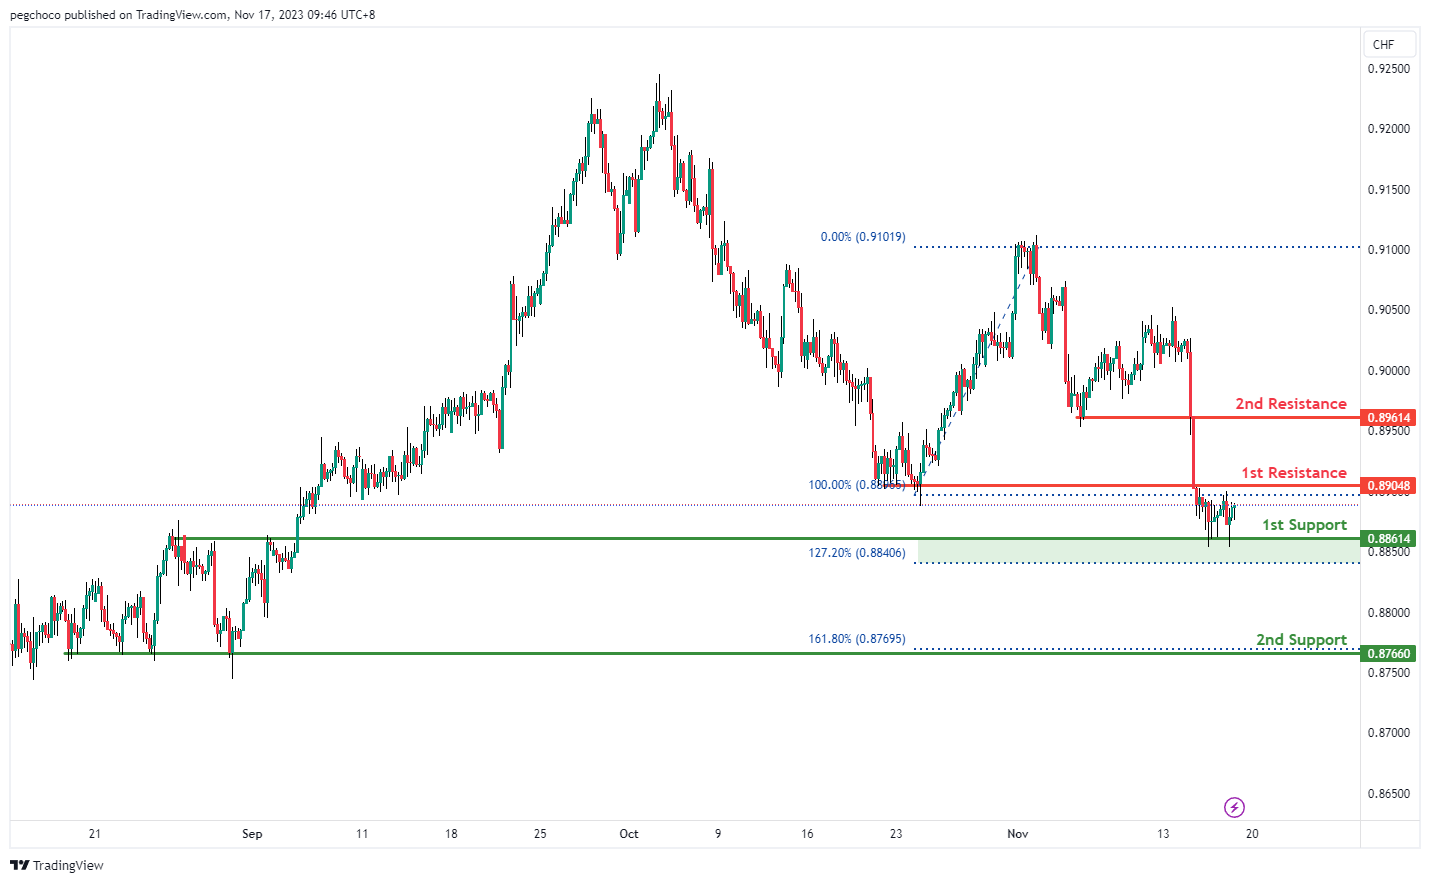
USD/CHF:
The USD/CHF chart currently exhibits a neutral overall momentum, suggesting potential price fluctuations between the 1st resistance and 1st support levels.
The 1st support level at 0.8861 is identified as a pullback support, and it also coincides with the 127.20% Fibonacci Extension level. This confluence of support factors indicates that there could be a significant level of support in this area, potentially attracting buyers or acting as a barrier to further downward movement.
The 2nd support level at 0.8766 is considered a multi-swing low support, which reinforces its potential as a support level. Multi-swing lows often signify areas where buyers have intervened in the past, making it a relevant support level.
On the resistance side, the 1st resistance at 0.8904 is categorized as a pullback resistance. This level could potentially act as a barrier to upward price movement, where sellers may step in or where the price could find resistance.
The 2nd resistance at 0.8961 is also a pullback resistance, further indicating a potential level of selling pressure in the USD/CHF chart.
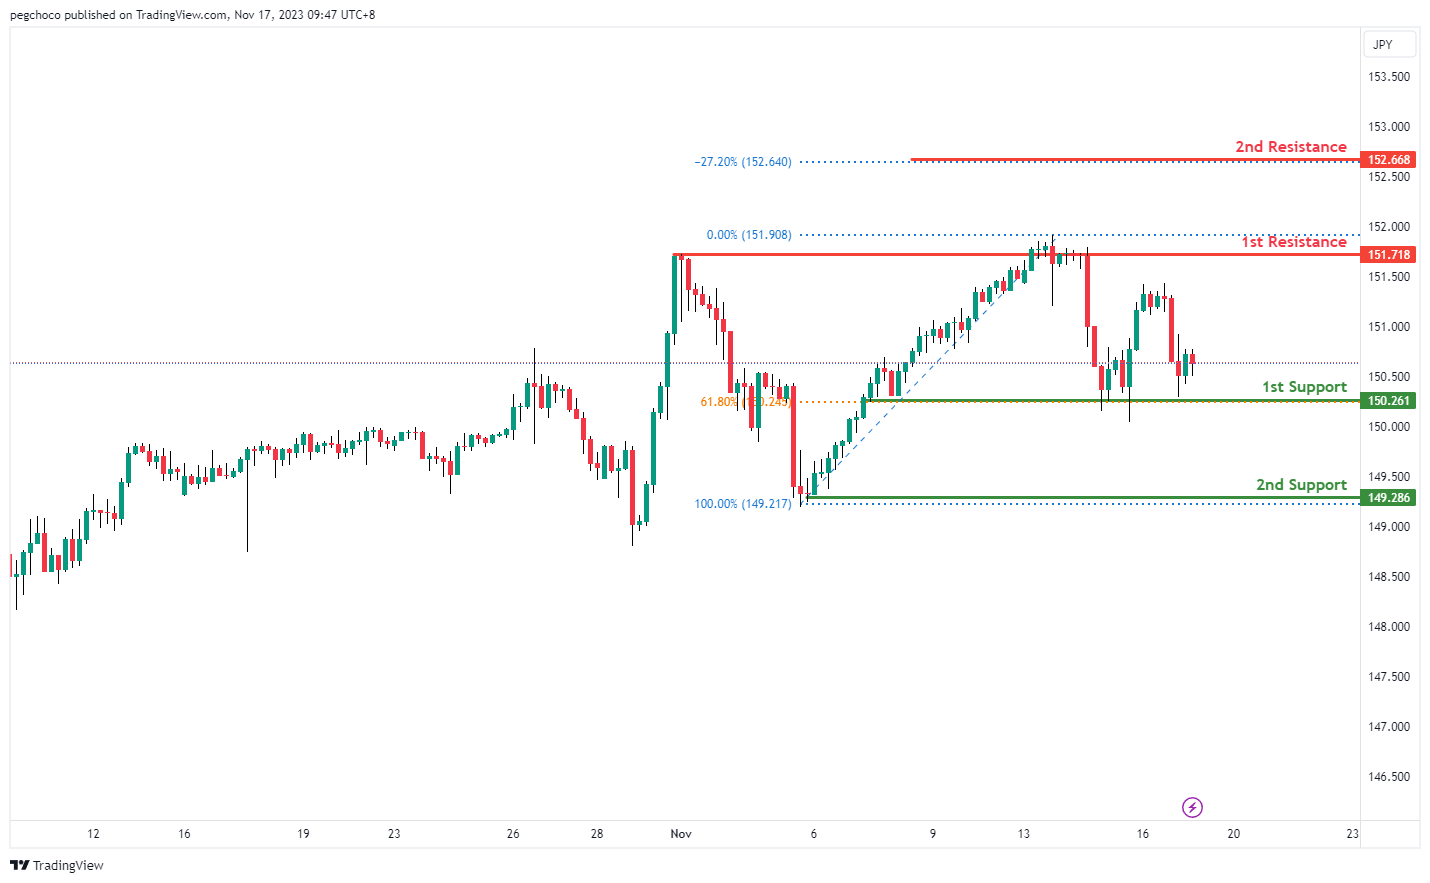
USD/JPY:
The USD/JPY chart currently displays a bullish overall momentum, indicating the potential for a bullish continuation towards the 1st resistance level.
The 1st support at 150.26 is identified as an overlap support, and it also coincides with the 61.80% Fibonacci Retracement level. This confluence of support factors suggests that there could be a significant level of support in this area, potentially attracting buyers or serving as a level where the bearish momentum may pause.
The 2nd support at 149.28 is considered a swing low support, further reinforcing its potential as a support level. Swing lows often represent areas where buyers have previously entered the market, making it a relevant support level.
On the resistance side, the 1st resistance at 151.71 is categorized as a multi-swing high resistance. This level may act as a barrier to upward price movement, where sellers may step in or where the price could encounter resistance.
The 2nd resistance at 152.66 is noted as a -27% Fibonacci Expansion level, which indicates a potential price projection beyond the previous high points. It could serve as an extended target if the bullish momentum continues.
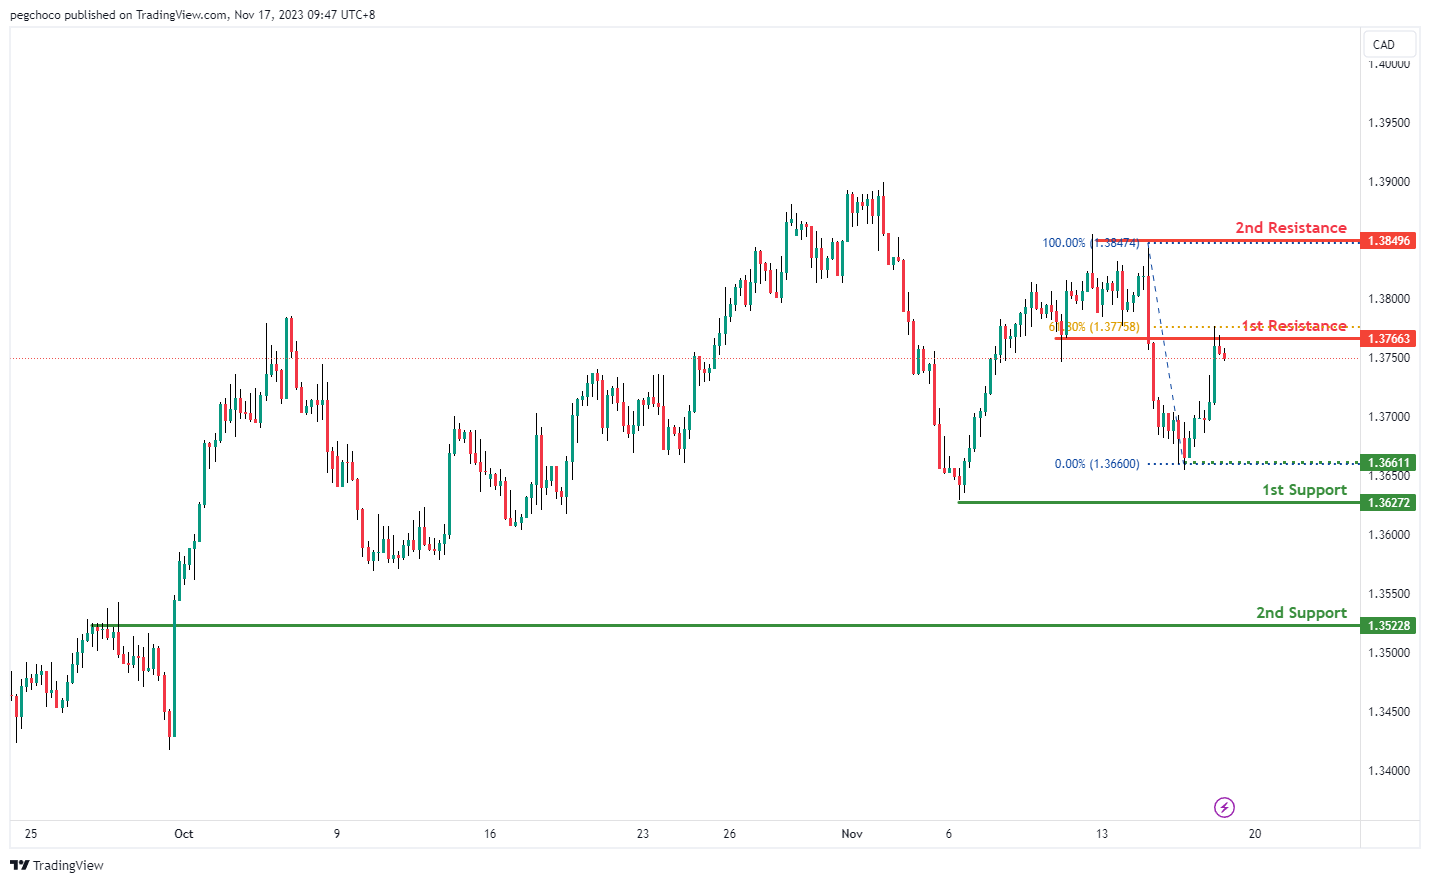
USD/CAD:
The USD/CAD chart currently exhibits a bearish overall momentum, indicating the potential for a bearish reaction off the 1st resistance level with a subsequent drop towards the 1st support level.
The 1st support at 1.3627 is identified as a swing low support. This level signifies a point where the price has previously found buying interest or reversed its bearish movement. Traders may expect this level to act as a potential area of support.
The 2nd support at 1.3522 is considered a pullback support. Pullback supports often indicate areas where buyers are likely to step in, further reinforcing the potential significance of this level as a support zone.
On the resistance side, the 1st resistance at 1.3766 is categorized as an overlap resistance. This level coincides with the 61.80% Fibonacci Retracement level, suggesting potential selling interest in this area and acting as a barrier to further upward movement.
The 2nd resistance at 1.3849 is noted as a swing high resistance. This level marks a point where the price has previously encountered selling pressure and reversed its direction.
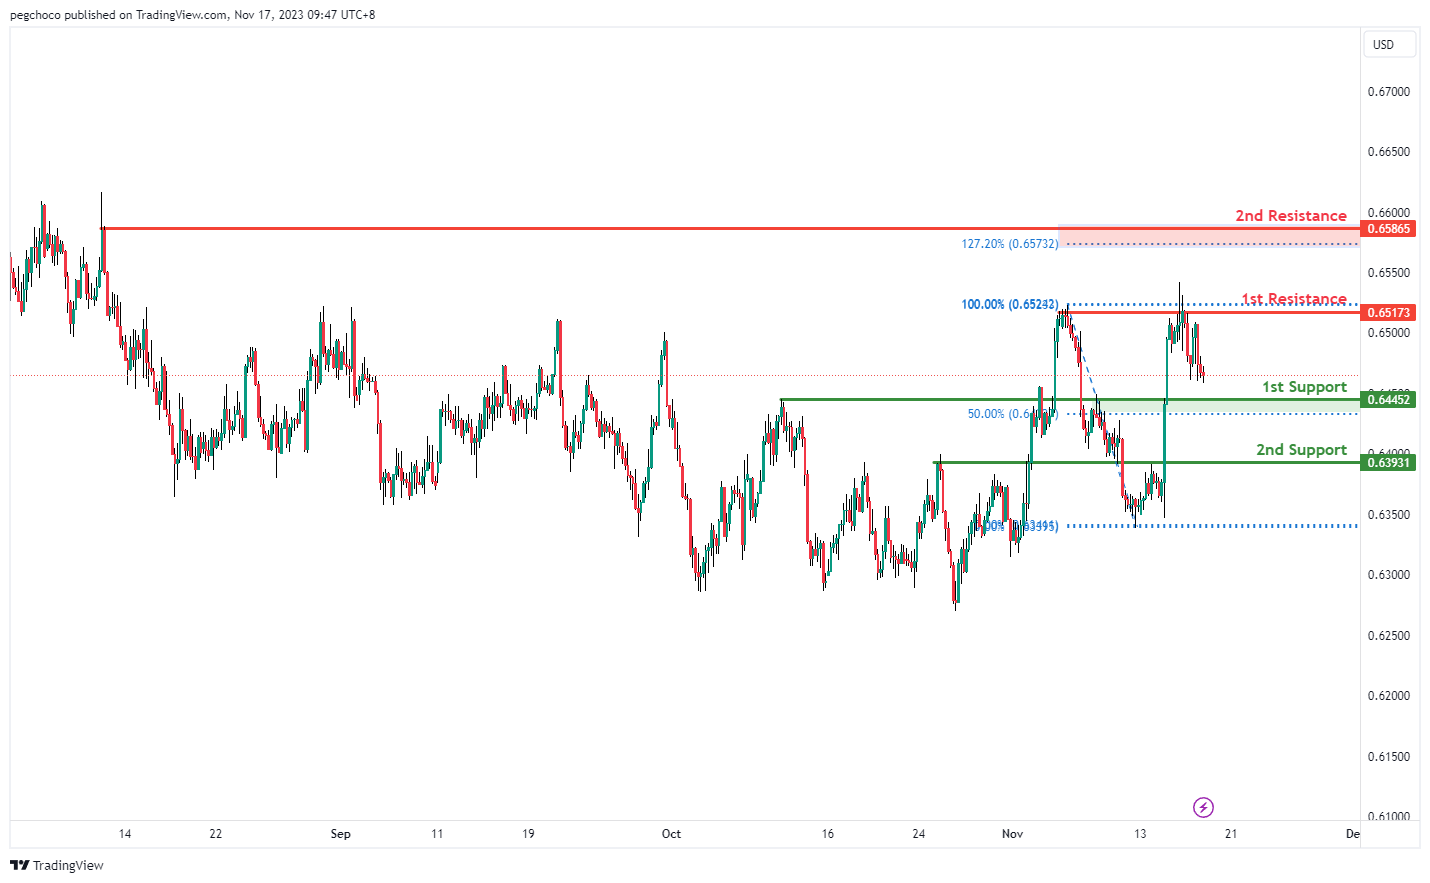
AUD/USD:
The AUD/USD chart currently shows a bearish overall momentum, suggesting the potential for a bearish continuation towards the 1st support level.
The 1st support at 0.6445 is identified as a pullback support, and it also coincides with the 50% Fibonacci Retracement level. This level indicates that there could be a significant level of support, and traders may expect the price to find buying interest or a pause in the bearish movement around this area.
The 2nd support at 0.6393 is considered a pullback support as well, further reinforcing its potential as a support level. Pullback supports often indicate areas where buyers have stepped in previously, making it a relevant support level.
On the resistance side, the 1st resistance at 0.6517 is categorized as a multi-swing high resistance. This level suggests that there could be selling interest in this area, potentially acting as a barrier to further upward movement.
The 2nd resistance at 0.6585 coincides with the 127.20% Fibonacci Retracement level and is also noted as a swing high resistance. This level further strengthens its significance as a resistance zone.
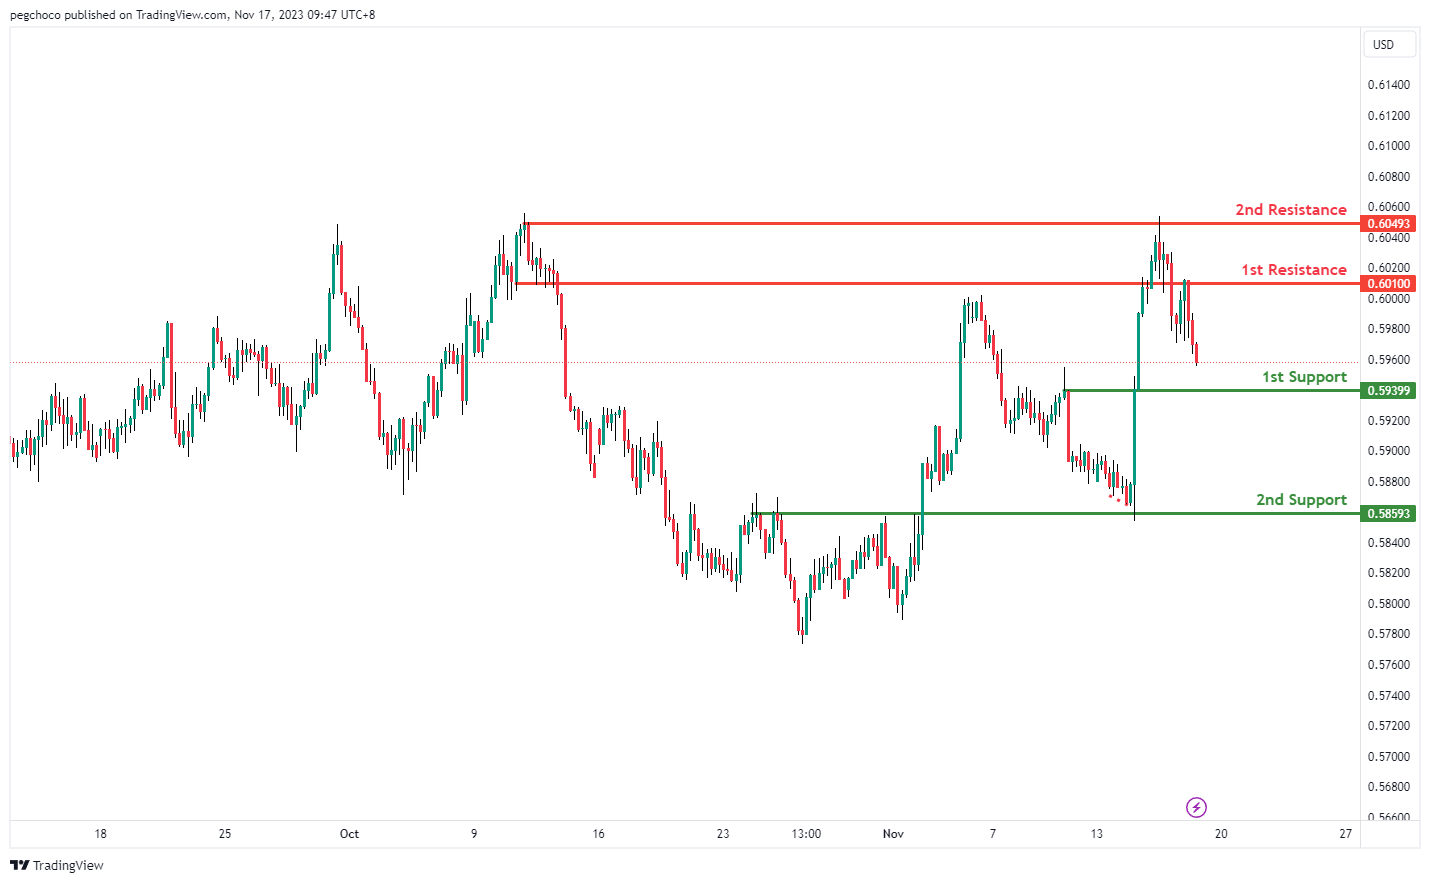
NZD/USD
The NZD/USD chart currently exhibits a bearish overall momentum, indicating the potential for a bearish continuation towards the 1st support level.
The 1st support at 0.5939 is identified as a pullback support. This level suggests that there could be a significant level of support, potentially causing the price to find buying interest or experience a pause in its bearish movement around this area.
The 2nd support at 0.5859 is considered an overlap support, further reinforcing its potential as a support level. Overlap supports often indicate areas where buyers have intervened previously, making it a relevant support level.
On the resistance side, the 1st resistance at 0.6010 is categorized as an overlap resistance. This level could act as a barrier to further upward movement due to potential selling interest.
The 2nd resistance at 0.6049 coincides with a swing high resistance, making it another significant resistance zone.
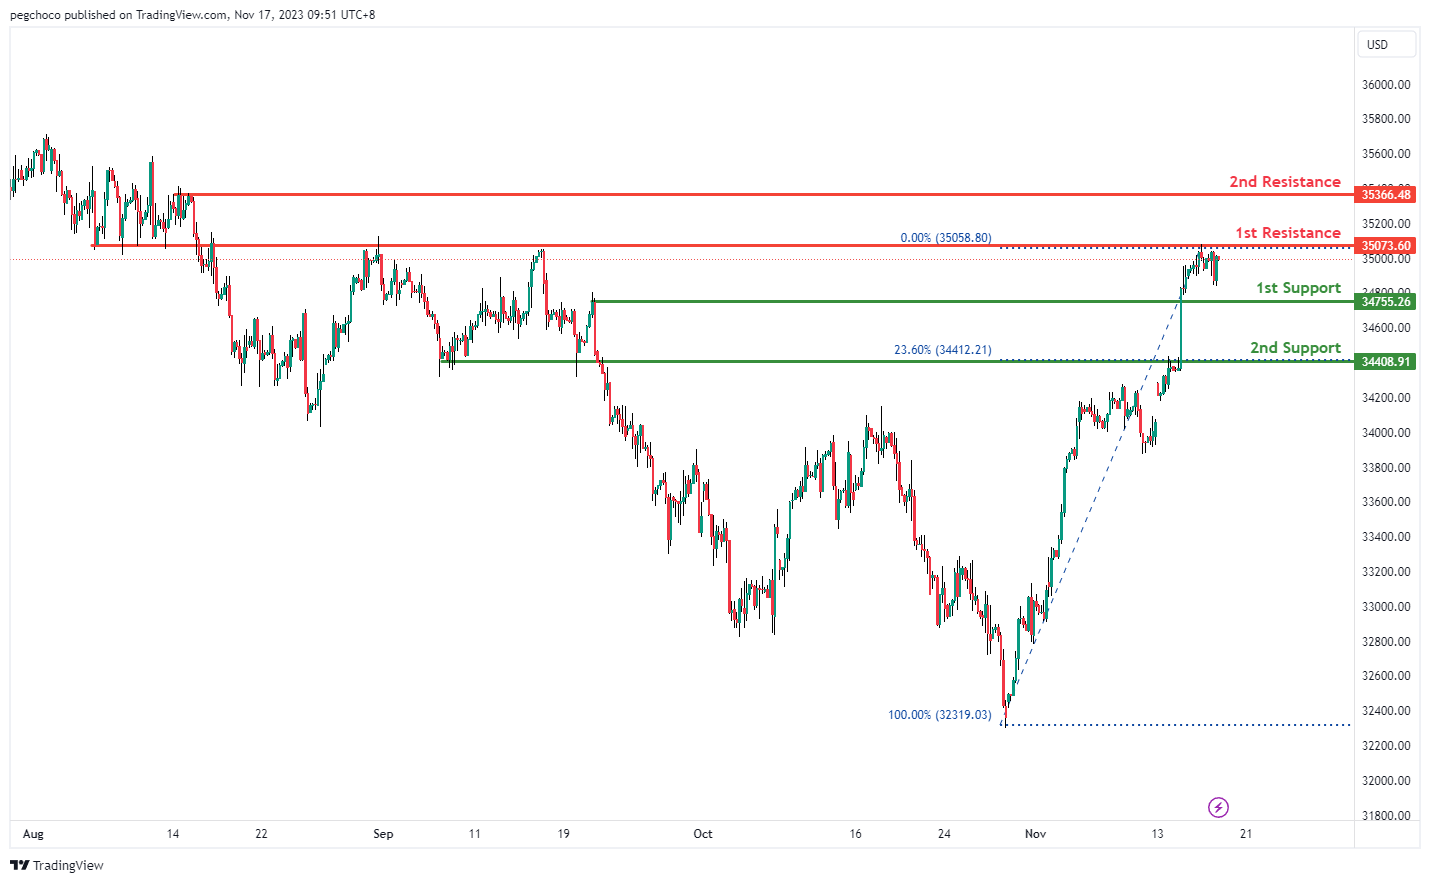
DJ30:
The DJ30 (Dow Jones 30) chart currently exhibits a neutral overall momentum, suggesting the potential for price to fluctuate between the 1st resistance and 1st support levels.
The 1st support at 34,755.26 is identified as a pullback support level, indicating that this area may have historical significance as a support zone.
The 2nd support at 34,408.91 coincides with the 23.60% Fibonacci Retracement level, making it another potential support level. Fibonacci retracement levels often act as relevant price areas.
On the resistance side, the 1st resistance at 35,073.60 is categorized as an overlap resistance, suggesting that there may be selling interest in this area, potentially acting as a barrier to further upward movement.
The 2nd resistance at 35,366.48 is considered a multi-swing high resistance, indicating another potential level where the price may encounter selling pressure.
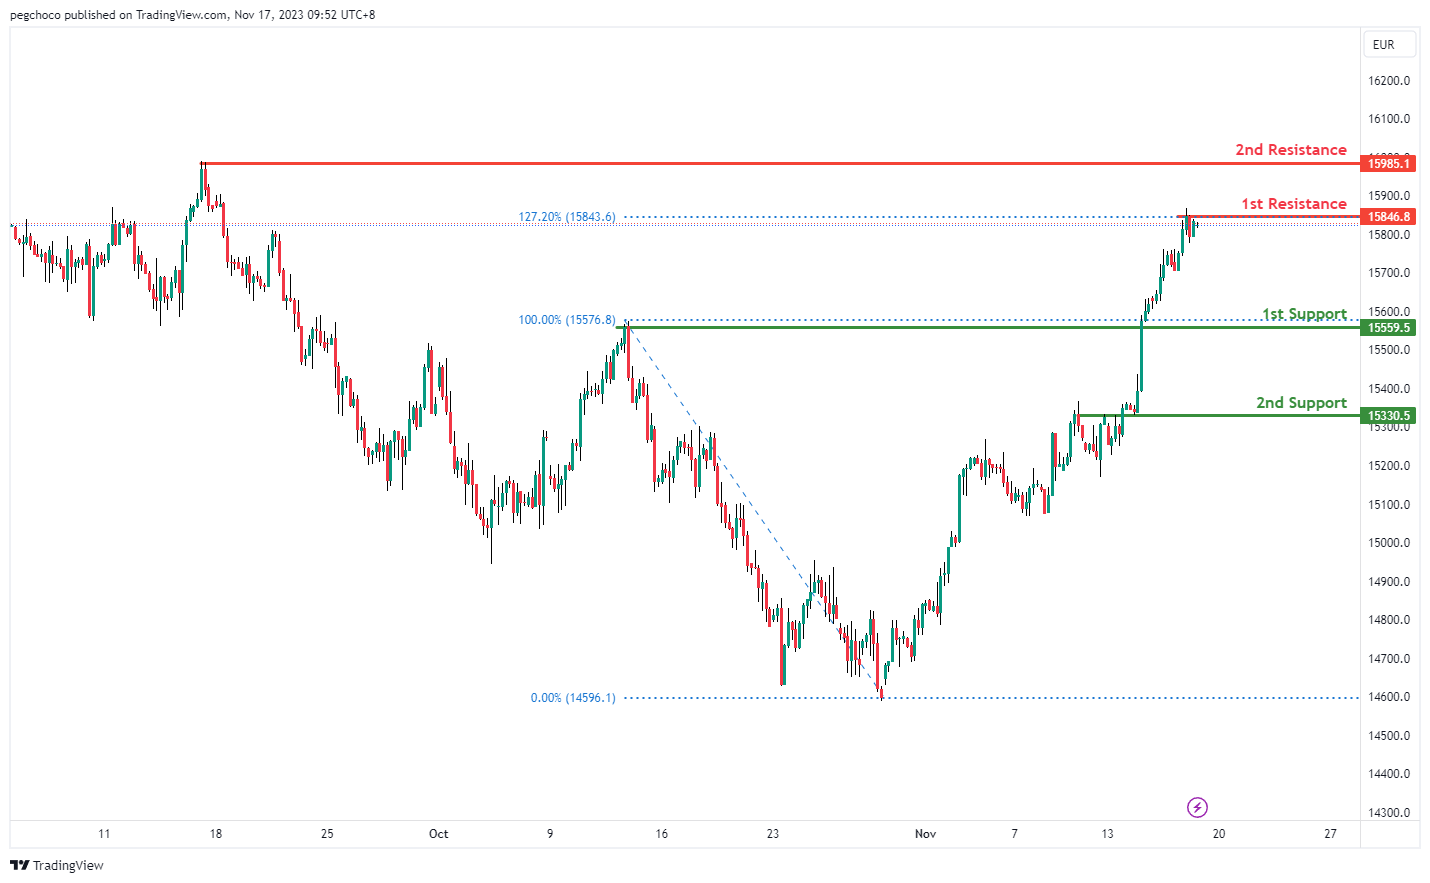
GER40:
The GER40 chart currently has a bearish overall momentum, suggesting the potential for a bearish reaction off the 1st resistance level followed by a drop towards the 1st support.
The 1st support at 15,559.5 is considered a pullback support level, indicating that this area may have historical significance as a support zone.
The 2nd support at 15,330.5 is an overlap support level, reinforcing its potential as a relevant support level where buyers have previously stepped in.
On the resistance side, the 1st resistance at 15,846.8 is categorized as a swing high resistance, and it also coincides with the 127.20% Fibonacci Extension level. This suggests that there could be significant selling interest in this area, making it a key barrier to further upward movement.
The 2nd resistance at 15,985.1 is another swing high resistance, indicating another potential level where the price may encounter selling pressure.
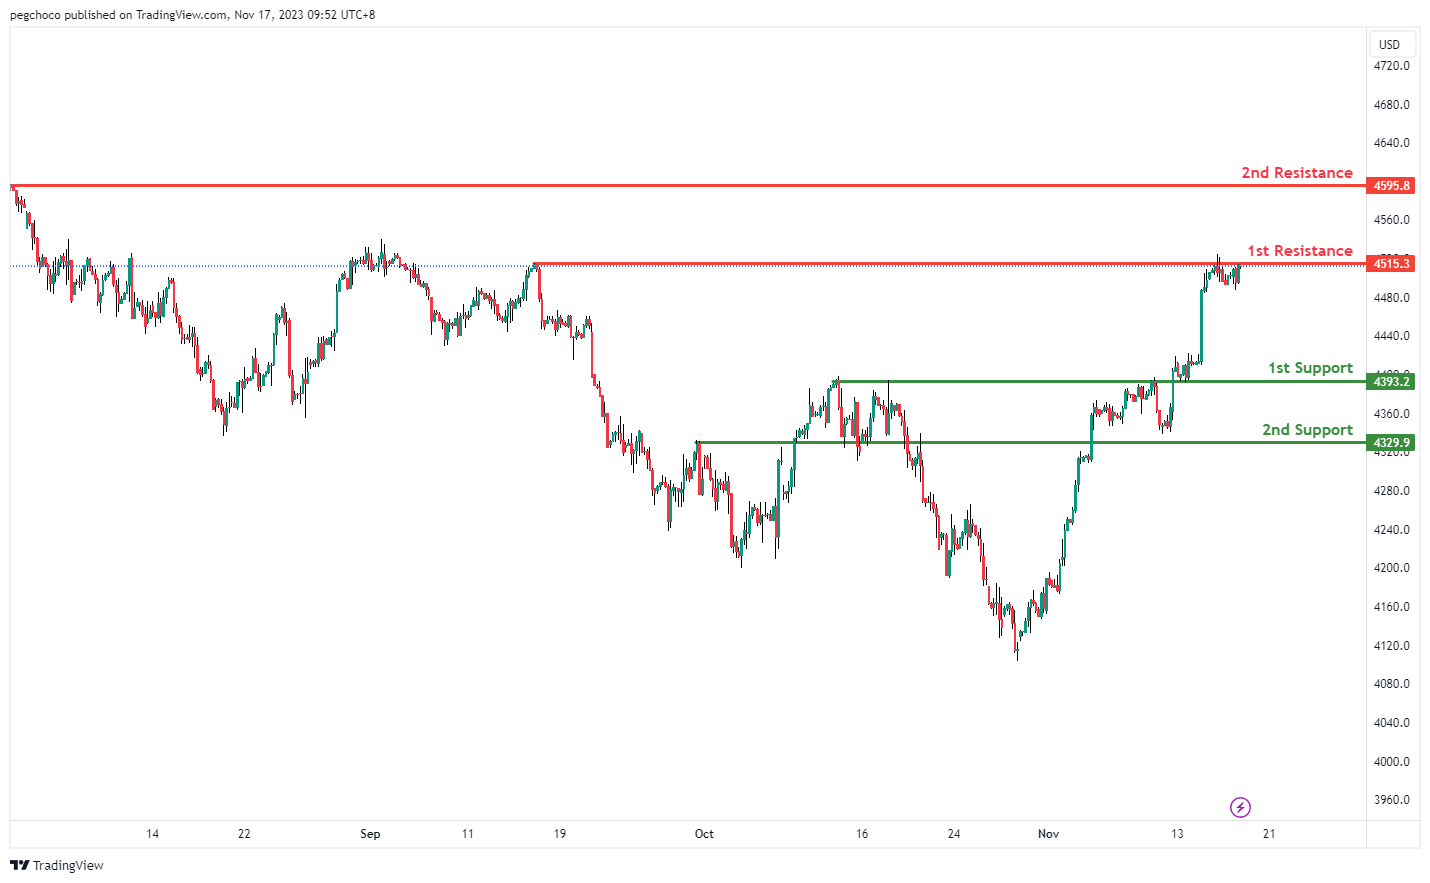
US500
The US500 chart currently exhibits a bearish overall momentum, indicating the potential for a bearish reaction off the 1st resistance level with a subsequent drop towards the 1st support.
The 1st support at 4,393.2 is identified as an overlap support, suggesting that this level may have historical significance as a support zone.
The 2nd support at 4,329.9 is also an overlap support, further reinforcing its potential as a relevant support level.
On the resistance side, the 1st resistance at 4,515.3 is categorized as a multi-swing high resistance, indicating that this level has historically acted as a significant barrier to further upward movement.
The 2nd resistance at 4,595.8 is a swing high resistance, making it another key level where traders may anticipate selling pressure.
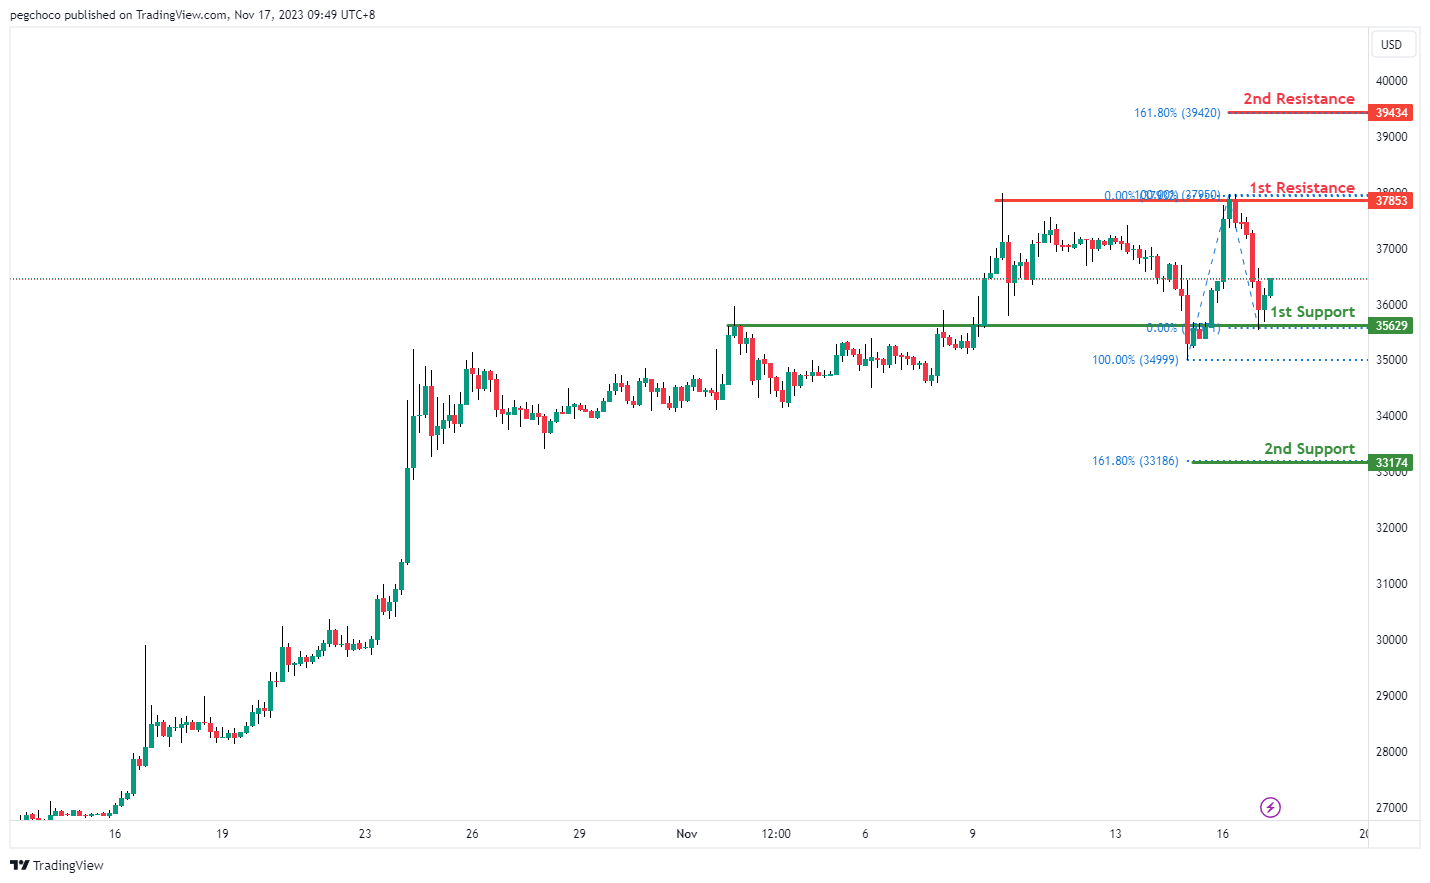
BTC/USD:
The BTC/USD chart currently shows a bullish overall momentum, indicating the potential for a bullish continuation towards the 1st resistance.
The 1st support at 35,629 is identified as an overlap support, suggesting that this level may provide significant support for the price. Traders may expect buying interest or a pause in the bullish movement around this area.
The 2nd support at 33,174 is considered a pullback support and coincides with the 161.80% Fibonacci Extension level. This level adds to its significance as a potential support level.
On the resistance side, the 1st resistance at 37,853 is categorized as a multi-swing high resistance. This level suggests that there may be selling interest in this area, potentially acting as a barrier to further upward movement.
The 2nd resistance at 39,434 is noted as a significant resistance level, coinciding with the 161.80% Fibonacci Extension. This adds another layer of resistance to the chart.
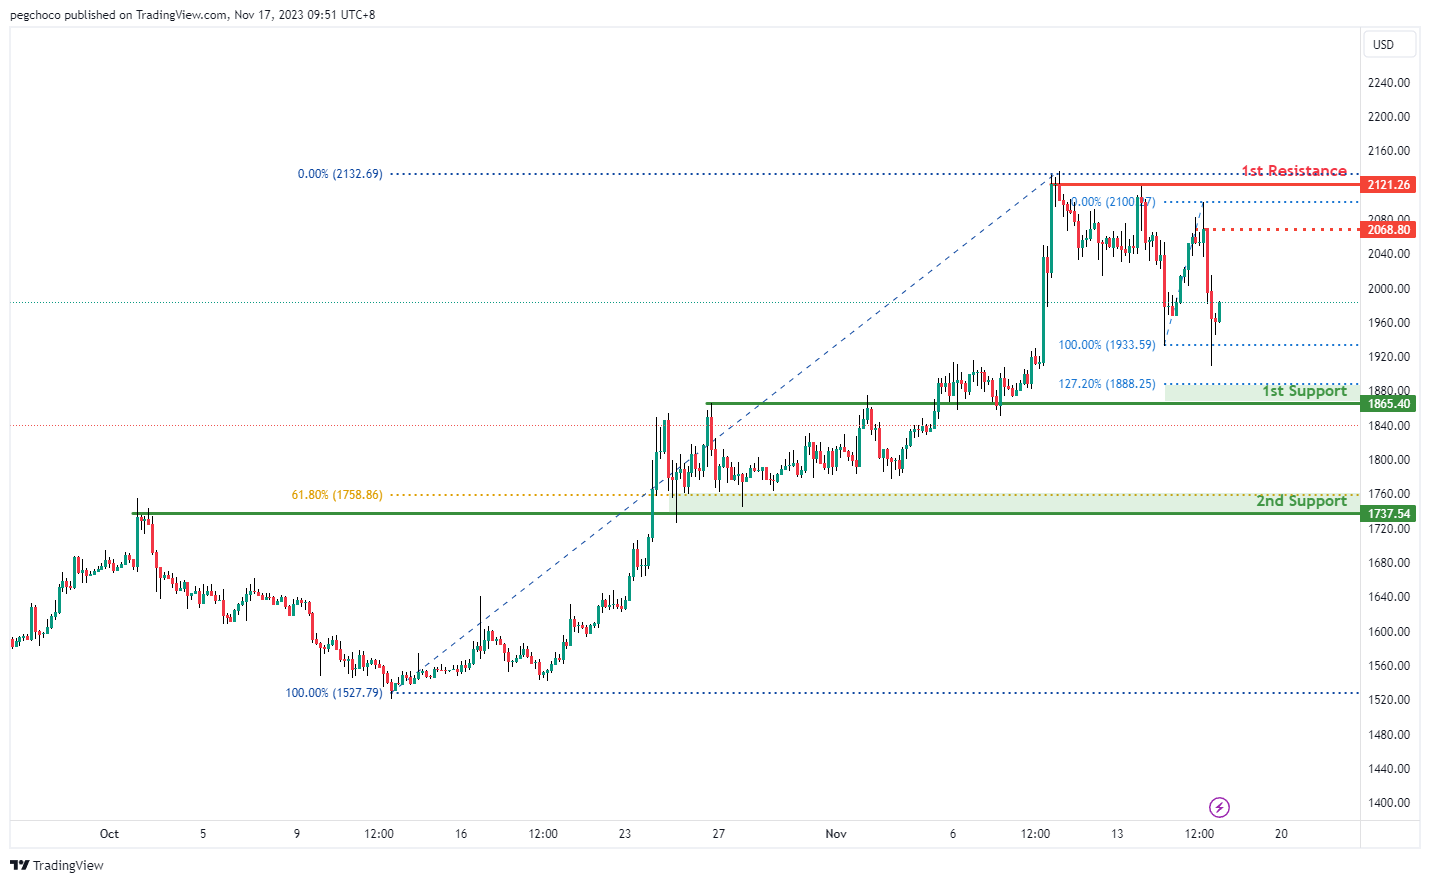
ETH/USD:
The ETH/USD chart currently displays a bearish overall momentum, suggesting the potential for a bearish continuation towards the 1st support.
The 1st support at 1,865.40 is identified as an overlap support and also coincides with the 127.20% Fibonacci Extension level. This confluence of technical factors indicates that this level could provide significant support, and traders may anticipate a potential bounce or a pause in the bearish movement around this area.
The 2nd support at 1,737.54 is considered an overlap support and is further reinforced by the 61.80% Fibonacci Retracement level. This makes it a relevant support level with the potential to halt or slow down the bearish momentum.
On the resistance side, the 1st resistance at 2,121.26 is categorized as a multi-swing high resistance, suggesting that this level may act as a barrier to upward movement.
Intermediate resistance at 2,068.80 is also a significant level, coinciding with a swing high resistance. Traders should pay attention to this level as it may pose resistance during the bearish continuation.
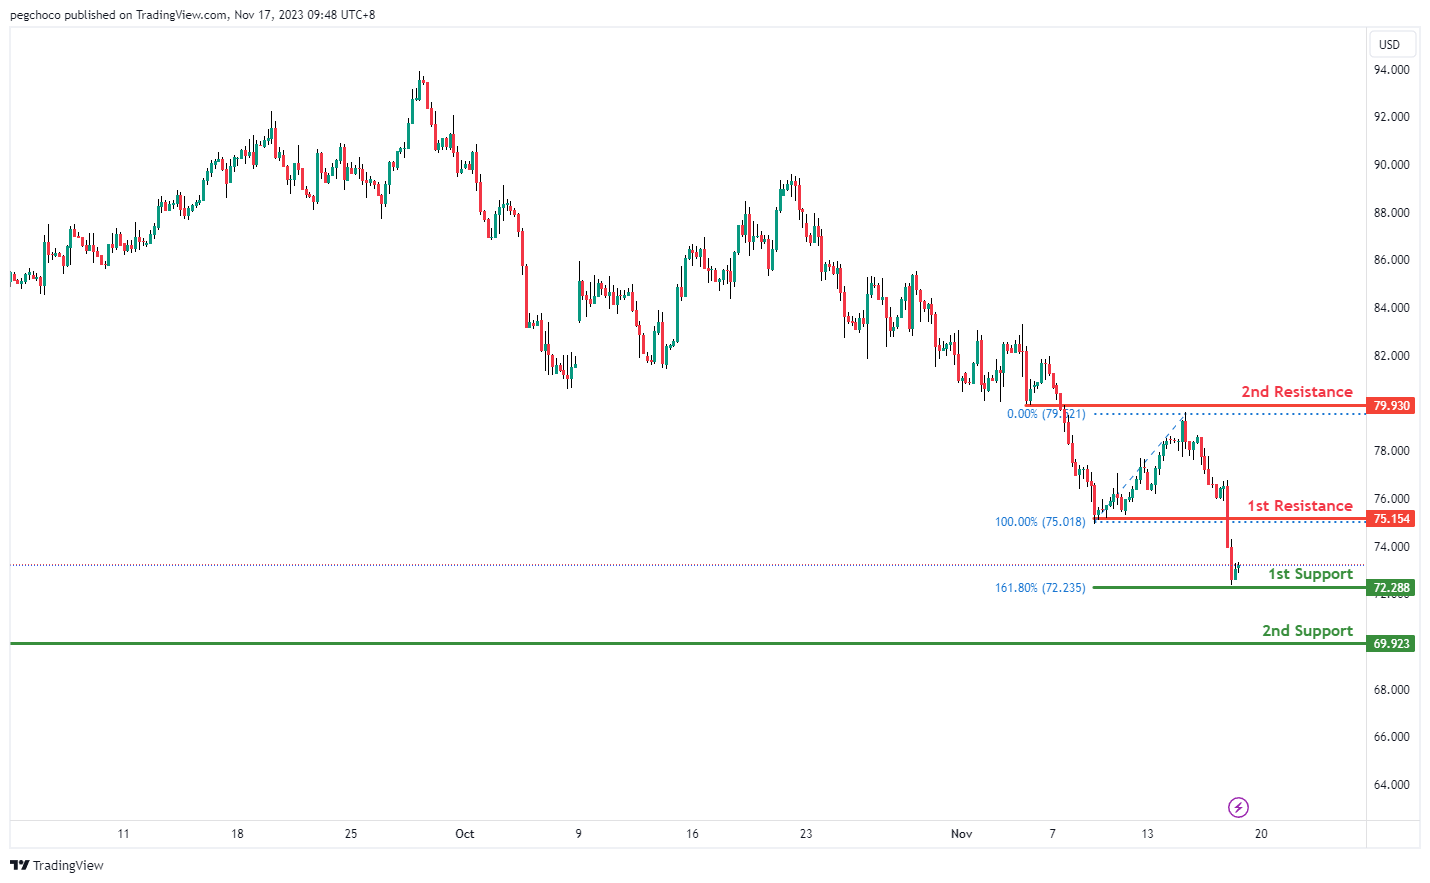
WTI/USD:
The WTI chart currently exhibits a bullish overall momentum, suggesting the potential for a bullish bounce off the 1st support level with a potential move towards the 1st resistance.
The 1st support at 72.28 is identified as a swing low support and coincides with the 161.80% Fibonacci Extension level. This level indicates strong potential support and may attract buying interest or a reversal of the price’s bullish movement.
The 2nd support at 69.92 is considered an overlap support, further reinforcing its potential as a support level. Overlap supports often indicate areas where buyers have previously intervened, making it a relevant support level.
On the resistance side, the 1st resistance at 75.15 is categorized as a pullback resistance. This level suggests the possibility of selling interest in this area, potentially acting as a barrier to further upward movement.
The 2nd resistance at 79.93 is noted as an overlap resistance, indicating another significant resistance zone.
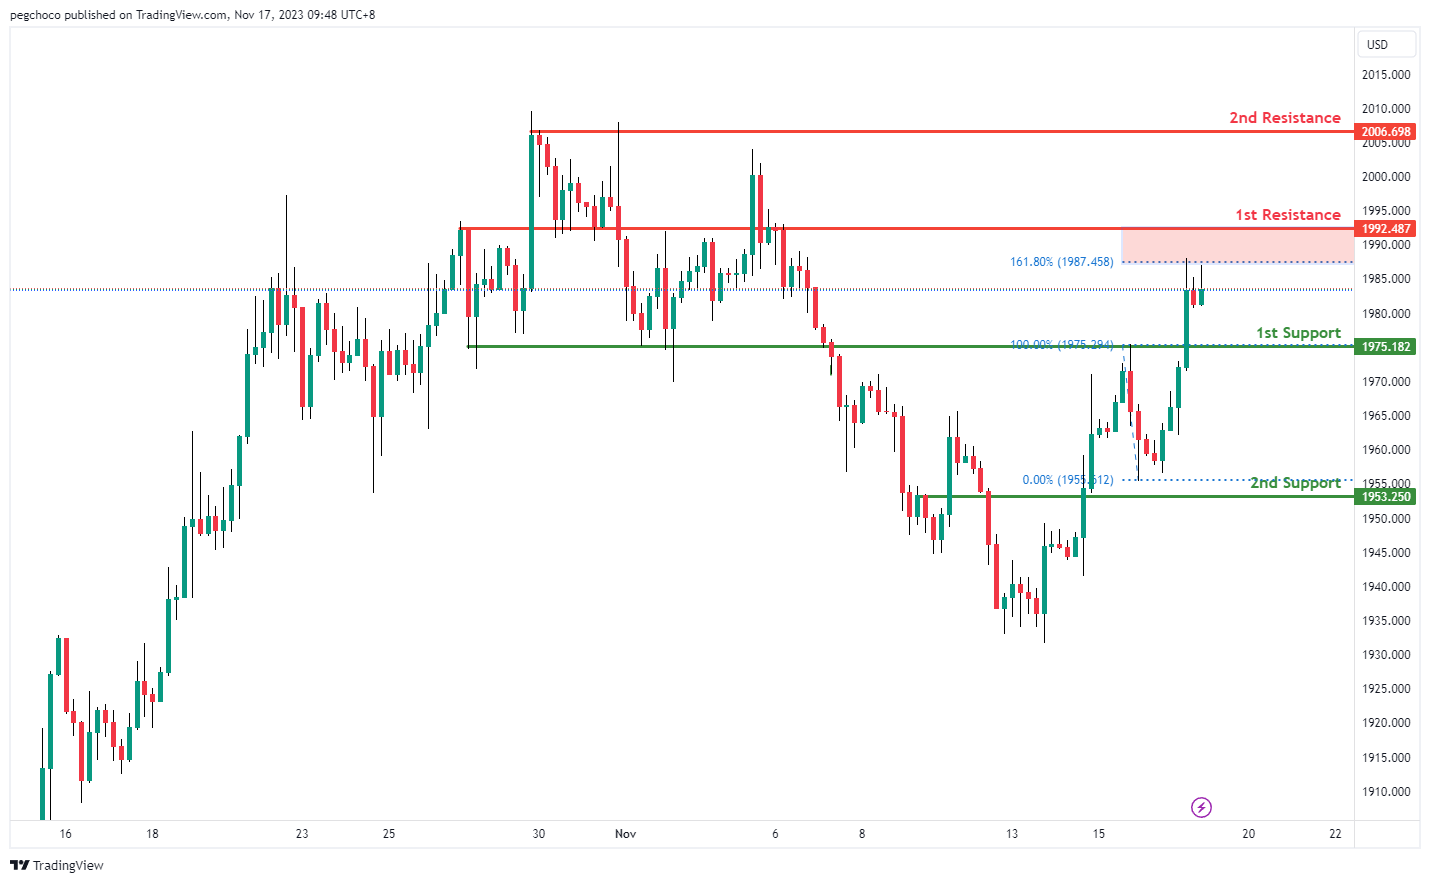
XAU/USD (GOLD):
The XAU/USD chart currently exhibits a bearish overall momentum, suggesting the potential for a bearish continuation towards the 1st support level.
The 1st support at 1975.12 is identified as a pullback support level, indicating a point where the price may find buying interest or a pause in its bearish movement. This level is significant as it represents a potential area where buyers could step in.
The 2nd support at 1953.25 is considered an overlap support, further reinforcing its potential as a support level. Overlap supports often indicate areas where price reversals or consolidations have occurred in the past, making it a relevant support level to watch.
On the resistance side, the 1st resistance at 1992.48 is categorized as a pullback resistance. This level may act as a barrier to upward price movement, where sellers may become more active or where the price could encounter resistance.
The 2nd resistance at 2006.69 is noted as a swing high resistance, signifying a point where the price previously encountered selling pressure and reversed its direction.


