
The Japanese stock market index, made up of shares of 225 companies, is showing high volatility today, attempting to break through the September high. Reuters wrote that the index had reached its highest level since 1990. The record is due to low rates from the Bank of Japan, which are helping the country’s export-oriented industry (in particular, the automobile industry) and financial sector to grow.
At the same time, in various financial markets, Nikkei-related instruments may not have recorded a maximum in 33 years — the reason is liquidity and what appears to be the top of the market:
→ there was a massive liquidation of short positions;
→ major market participants recorded profits.
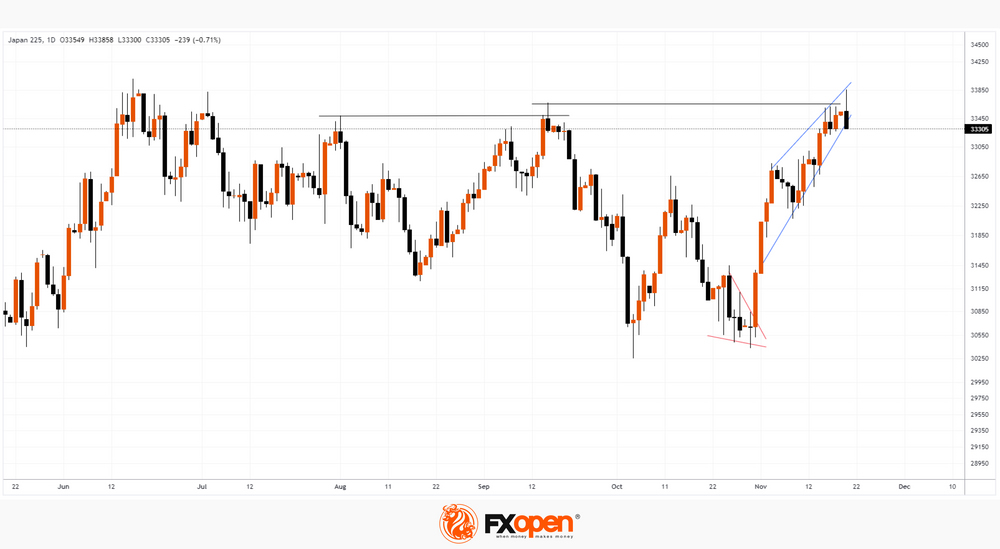
Therefore, the daily candlestick on European Monday morning has a long upper shadow. Note that today’s high could be a false breakout of the September top, which in turn is a false breakout of the August top.
The chart shows that the price of NIKKEI is forming a tapering wedge pattern (shown with blue lines) pointing upward. A bearish breakout of this pattern could lead to the development of a downtrend.
Something similar (but in a mirror image) was recorded at the end of October, when a downward wedge formed on the chart (shown by red lines, more clearly visible on the 4-hour chart). The breakout of this wedge led to a rally of over 9%.
If the NIKKEI enters a downtrend, it could be fueled by rumors of an end to the low rate policy. Experts in the media are increasingly predicting this move by the Bank of Japan.
This article represents the opinion of the Companies operating under the FXOpen brand only. It is not to be construed as an offer, solicitation, or recommendation with respect to products and services provided by the Companies operating under the FXOpen brand, nor is it to be considered financial advice.


 and financial sector to grow.)