
DXY:
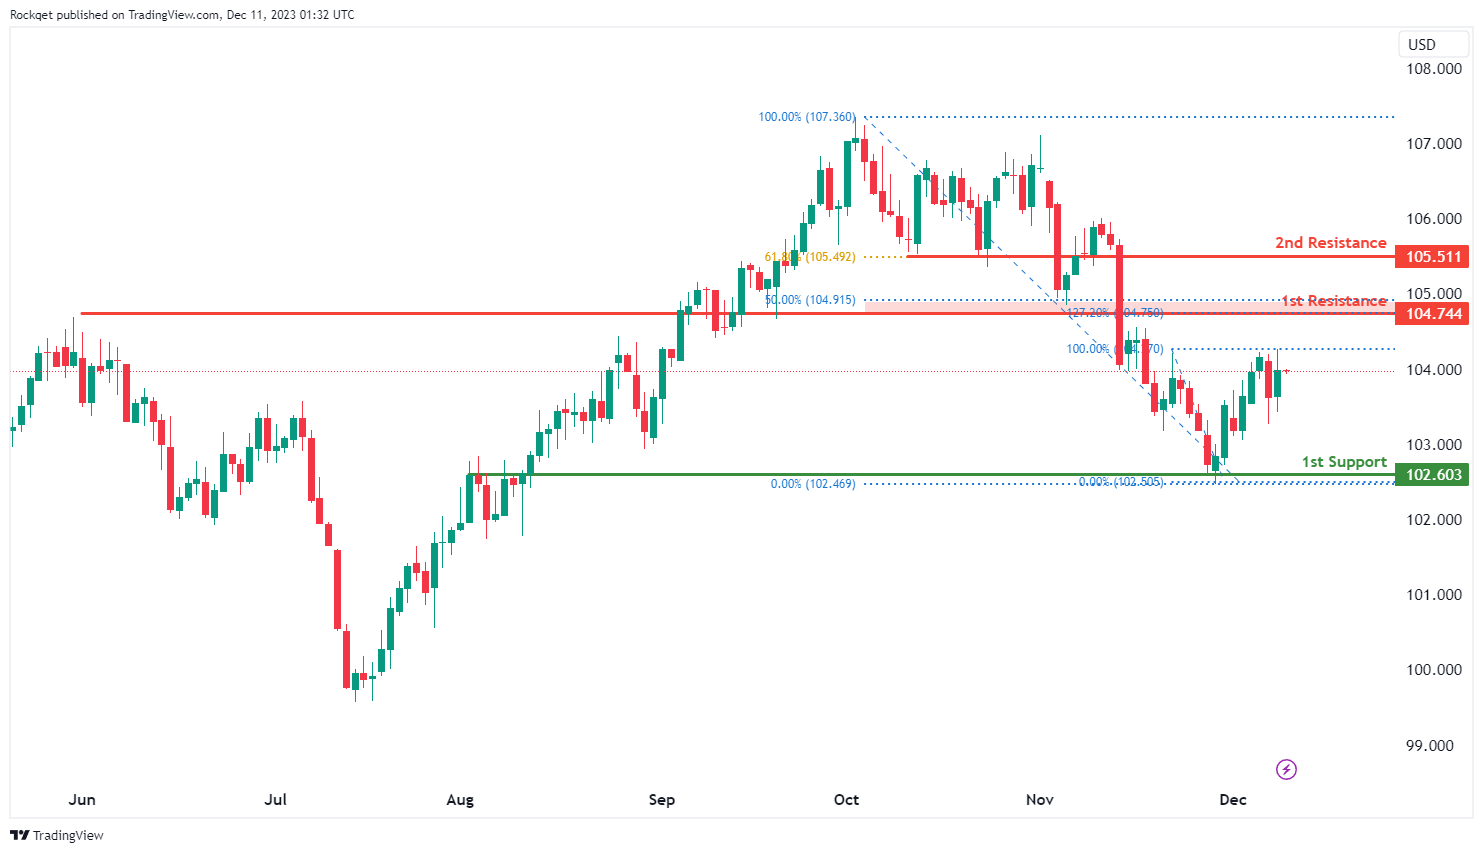
The DXY chart currently exhibits a bearish overall momentum, and there’s potential for a bearish reaction off the 1st resistance level, suggesting a possible downward movement towards the 1st support.
The 1st support at 102.60 is categorized as an overlap support, which implies that it could be a significant level where buying interest may emerge, potentially providing some support for the DXY.
On the resistance side, the 1st resistance at 104.74 is noted as a pullback resistance, and it coincides with the 50% Fibonacci Retracement level. This indicates that it’s a substantial barrier where selling interest could intensify, potentially leading to a bearish reaction.
Additionally, the 2nd resistance at 105.51 is categorized as a pullback resistance and coincides with the 61.80% Fibonacci Retracement level, further reinforcing its significance as a level where selling pressure may increase.
EUR/USD:
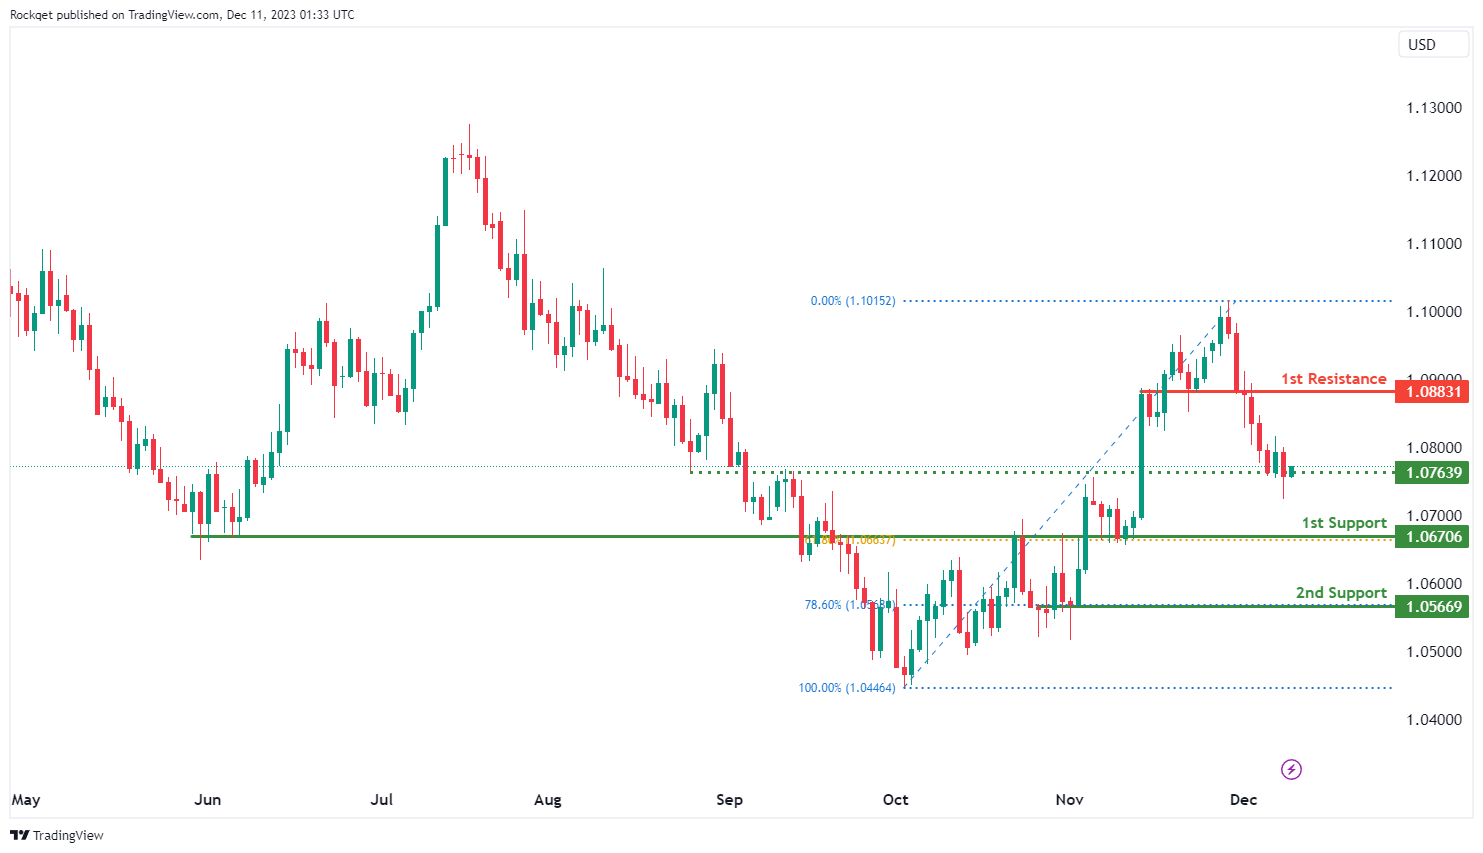
The EUR/USD chart currently exhibits a bullish overall momentum, and there’s potential for a bullish bounce off the 1st support level, indicating a possible upward movement towards the 1st resistance.
The 1st support at 1.0670 is categorized as a pullback support and coincides with the 61.80% Fibonacci Retracement level. This level is significant as it suggests a potential area where buying interest may emerge, providing support for the EUR/USD pair.
Further down, the 2nd support at 1.0566 is identified as a support level and coincides with the 78.60% Fibonacci Retracement level, reinforcing its significance as a potential area where buyers might become active.
On the resistance side, the 1st resistance at 1.0883 is noted as a pullback resistance. This implies that it’s a substantial barrier where selling interest could intensify, potentially limiting the upward movements of EUR/USD.
EUR/JPY:
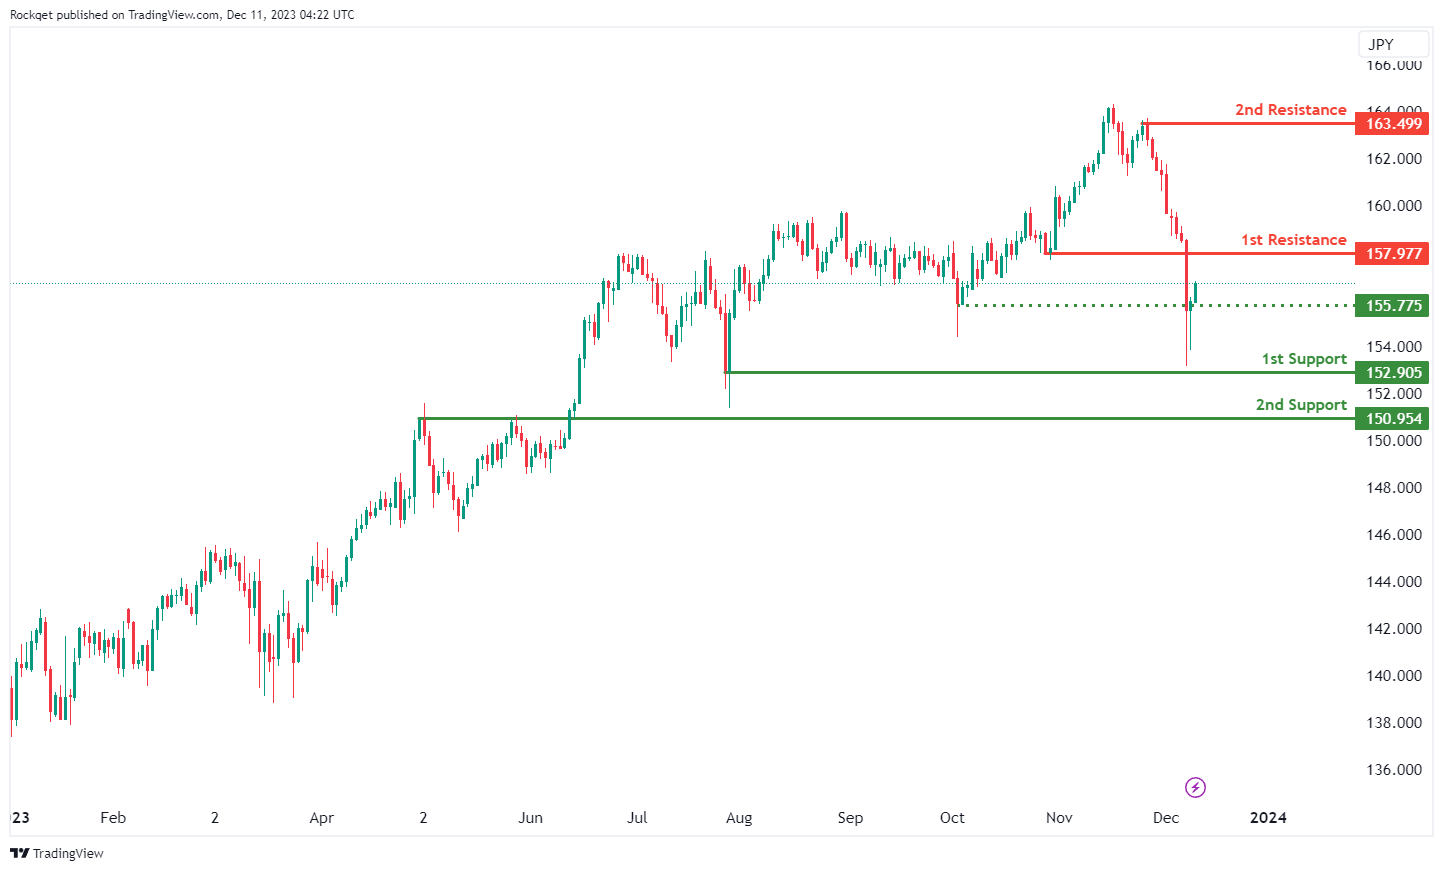
The EUR/JPY chart currently has bullish overall momentum, suggesting a potential bullish continuation towards the first resistance.
1st Support at 152.91: This level is identified as a pullback support, indicating a potential area where buying interest might emerge. It serves as a support zone for potential price stabilization.
2nd Support at 150.95: The second support is described as a multi-swing low support, suggesting historical significance as a level where the price has found support. This support level adds strength to the potential bullish movement.
1st Resistance at 157.98: The first resistance is recognized as a pullback resistance, suggesting a level where selling interest might be observed, acting as a potential hurdle to further upward movement.
2nd Resistance at 163.50: The second resistance is noted as a pullback resistance, indicating a level where selling interest might be encountered, potentially acting as an additional barrier to the bullish trend.
EUR/GBP:
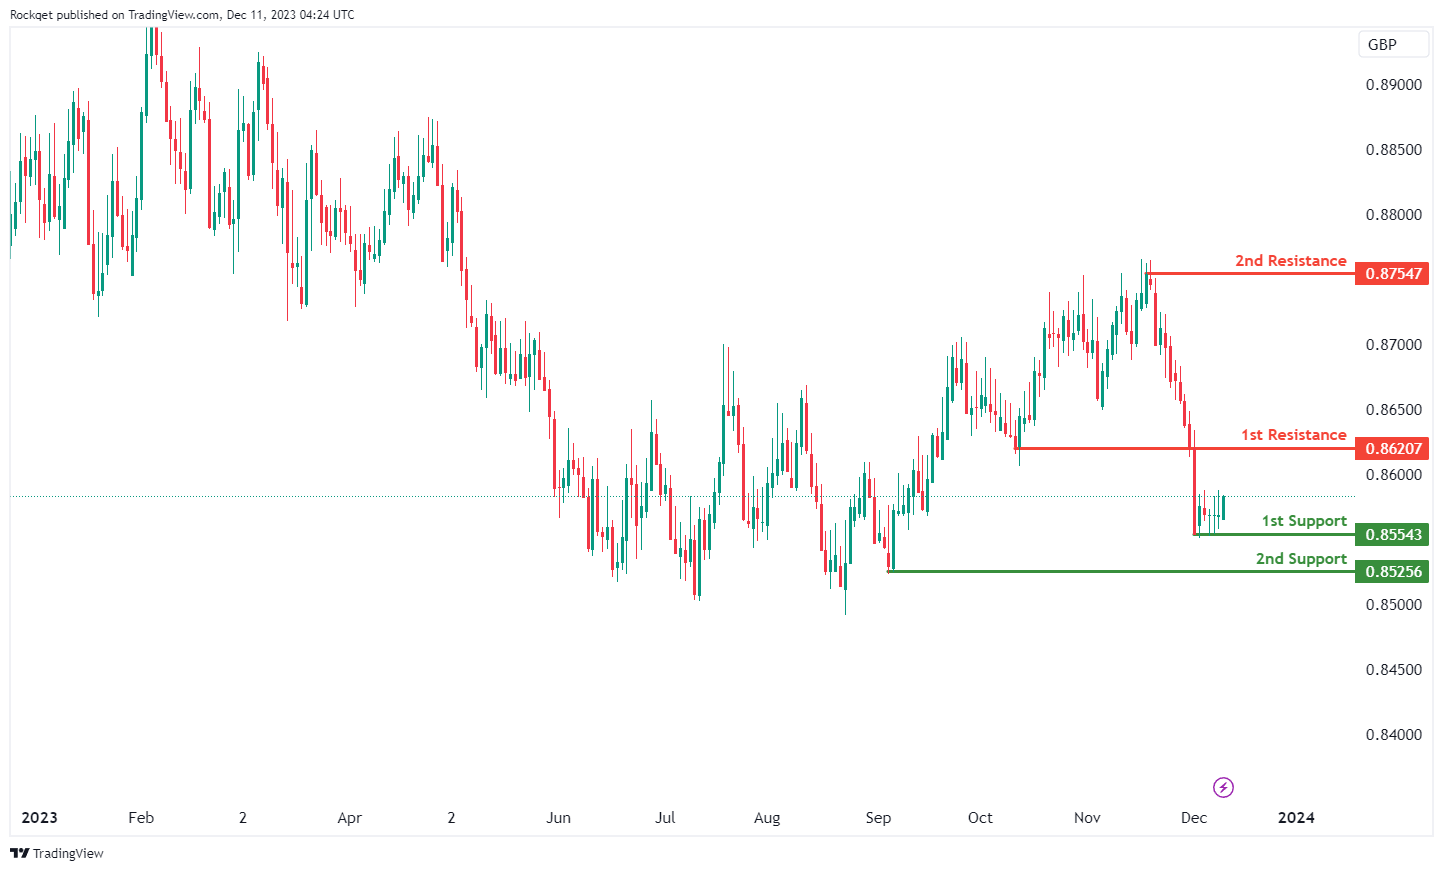
The EUR/GBP currency pair exhibits a bullish overall momentum, suggesting a potential bullish bounce off the first support towards the first resistance.
1st Support at 0.8554: This level is identified as a multi-swing low support, indicating historical significance as a level where the price has found support. It represents a potential area for buying interest.
2nd Support at 0.85226: The second support is described as a pullback support, suggesting a level where buyers might show interest. This support level adds strength to the potential bullish movement.
1st Resistance at 0.8621:The first resistance is recognized as a pullback resistance, suggesting a level where selling interest might be observed, potentially acting as a hurdle to further upward movement.
2nd Resistance at 0.9755: The second resistance is noted as a multi-swing high resistance, indicating historical points where the price faced obstacles and potential reversals. This level may act as a barrier to further bullish movement.
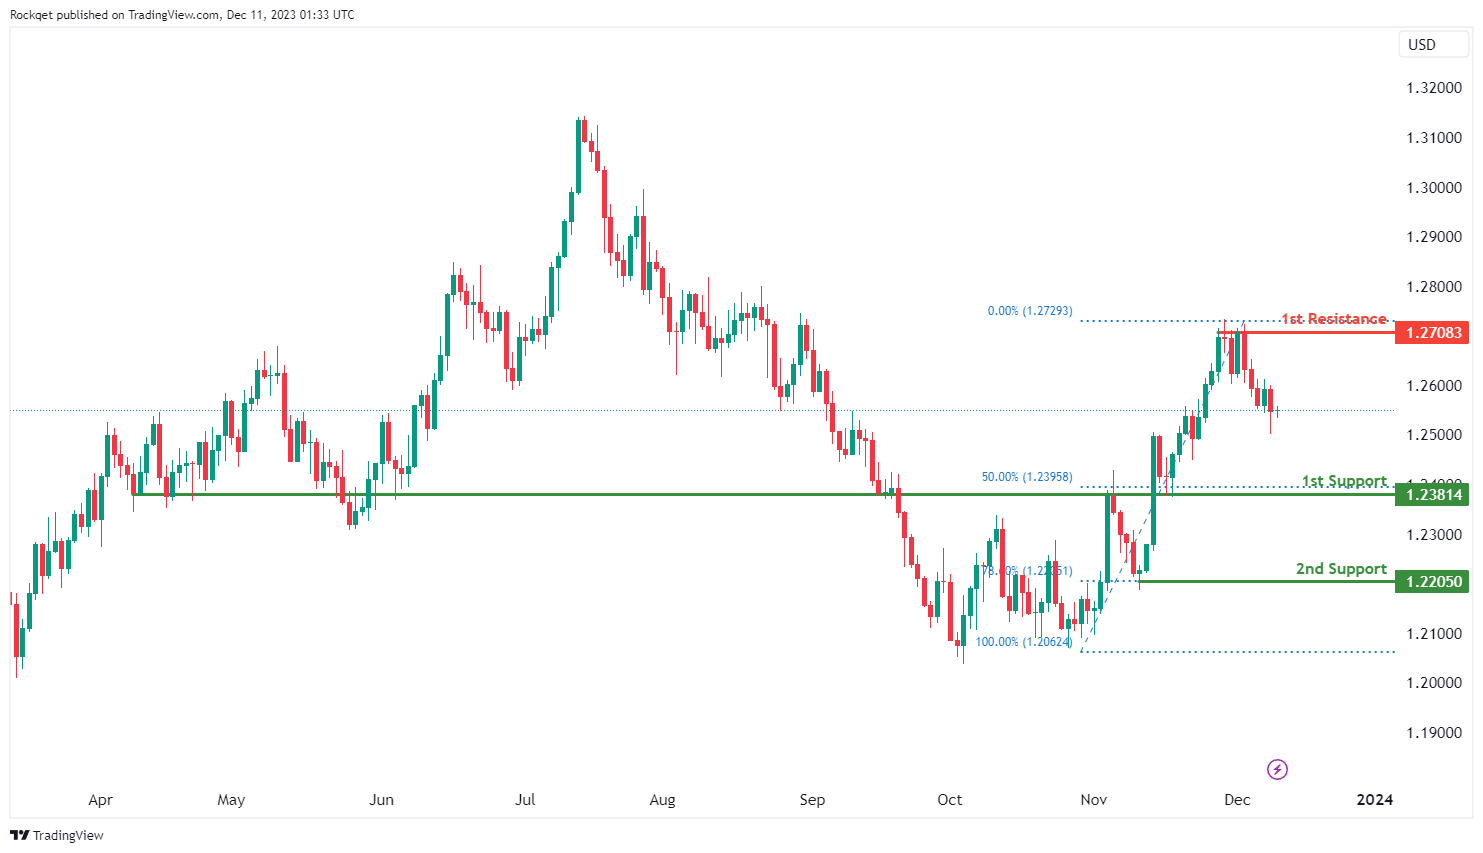
GBP/USD:
The GBP/USD chart currently exhibits a bullish overall momentum, and there’s potential for a bullish bounce off the 1st support level, indicating a possible upward movement towards the 1st resistance.
The 1st support at 1.2381 is categorized as an overlap support and coincides with the 50% Fibonacci Retracement level. This level is significant as it suggests a potential area where buying interest may emerge, providing support for the GBP/USD pair.
Further down, the 2nd support at 1.2205 is identified as another support level and coincides with the 78.60% Fibonacci Retracement level, reinforcing its significance as a potential area where buyers might become active.
On the resistance side, the 1st resistance at 1.2708 is noted as a multi-swing high resistance. This implies that it’s a substantial barrier where selling interest could intensify, potentially limiting the upward movements of GBP/USD.
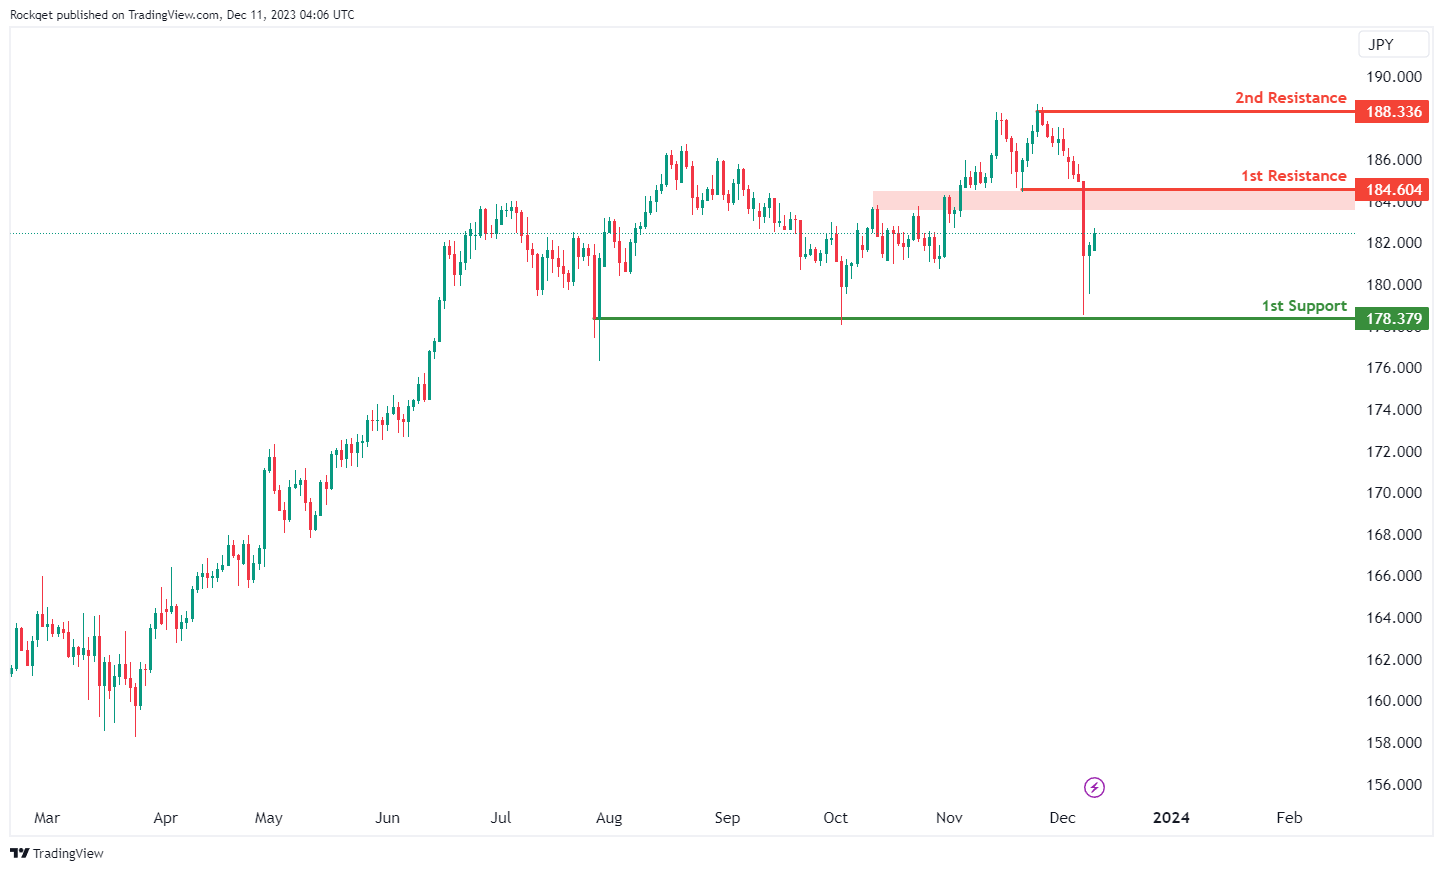
GBP/JPY:
The GBP/JPY currency pair is currently experiencing a bullish overall momentum, suggesting a potential bullish bounce off the first support towards the first resistance.
1st Support at 178.38: This level is identified as a multi-swing low support, indicating historical significance as a level where the price has found support. It represents a potential area for buying interest.
1st Resistance at 184.60: The first resistance is recognized as a pullback resistance, suggesting a level where selling interest might be observed, potentially acting as a hurdle to further upward movement.
2nd Resistance at 188.34: The second resistance is noted as a swing high resistance, indicating a level where historical selling pressure and potential reversals may occur.
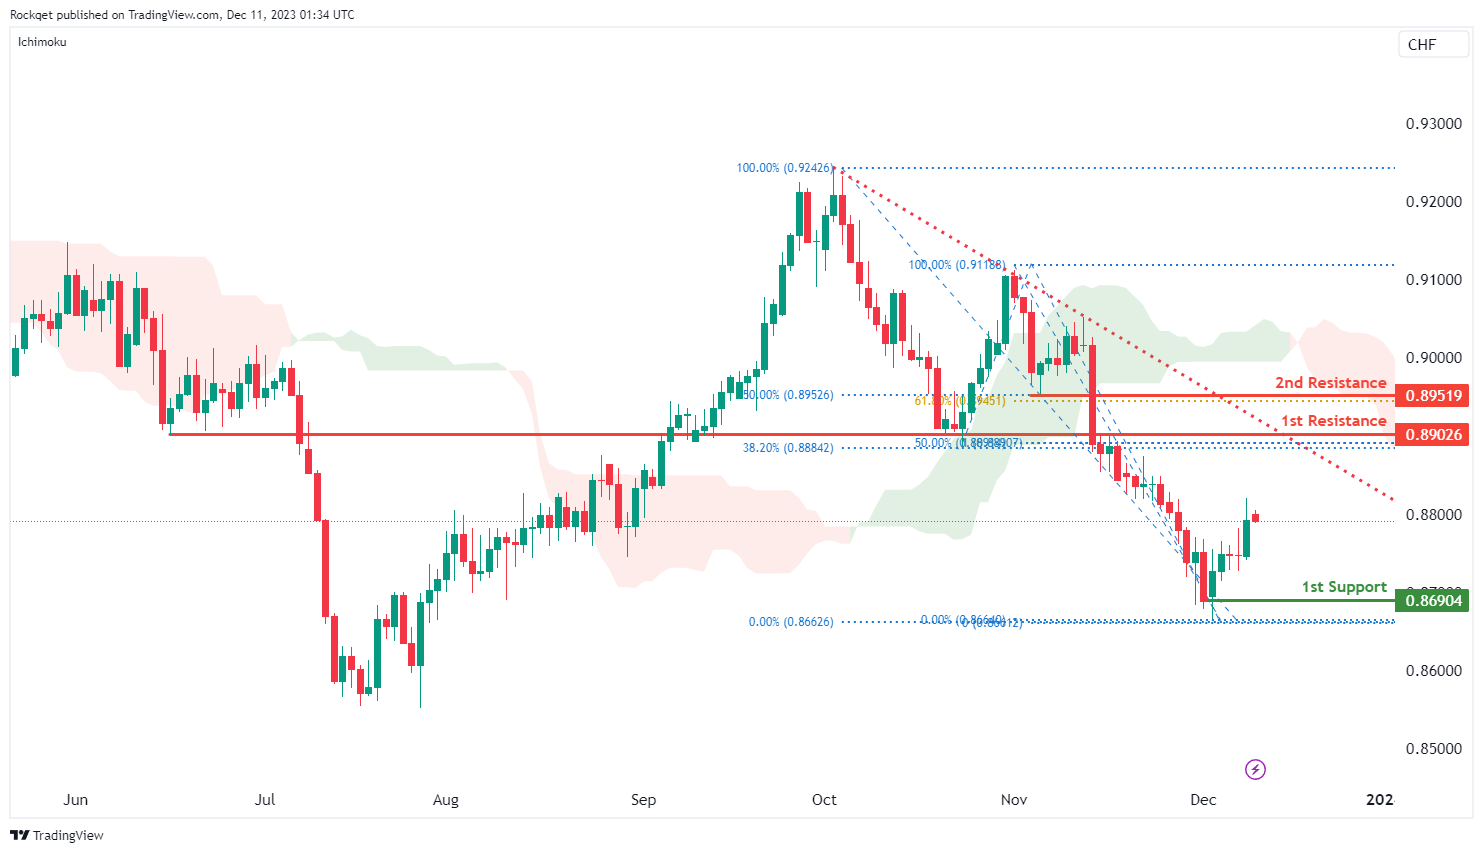
USD/CHF:
The USD/CHF chart currently has a bearish overall momentum, with price trading below a major descending trend line, indicating a bearish trend is in place. In the short term, there’s potential for a temporary rise towards the 1st resistance level before a reversal and a drop towards the 1st support.
The 1st support at 0.8690 is categorized as a swing low support. This level is significant as it suggests a potential area where buying interest may emerge, providing temporary support for USD/CHF.
On the resistance side, the 1st resistance at 0.8762 is identified as an overlap resistance and coincides with the 50% and 38.20% Fibonacci Retracement levels, indicating a potential confluence of Fibonacci levels. This level is likely to act as a substantial barrier where selling interest could intensify, potentially triggering a bearish reversal.
Further up, the 2nd resistance at 0.8951 is categorized as a pullback resistance and coincides with the 61.80% and 50% Fibonacci Retracement levels, suggesting another level where selling pressure may increase.
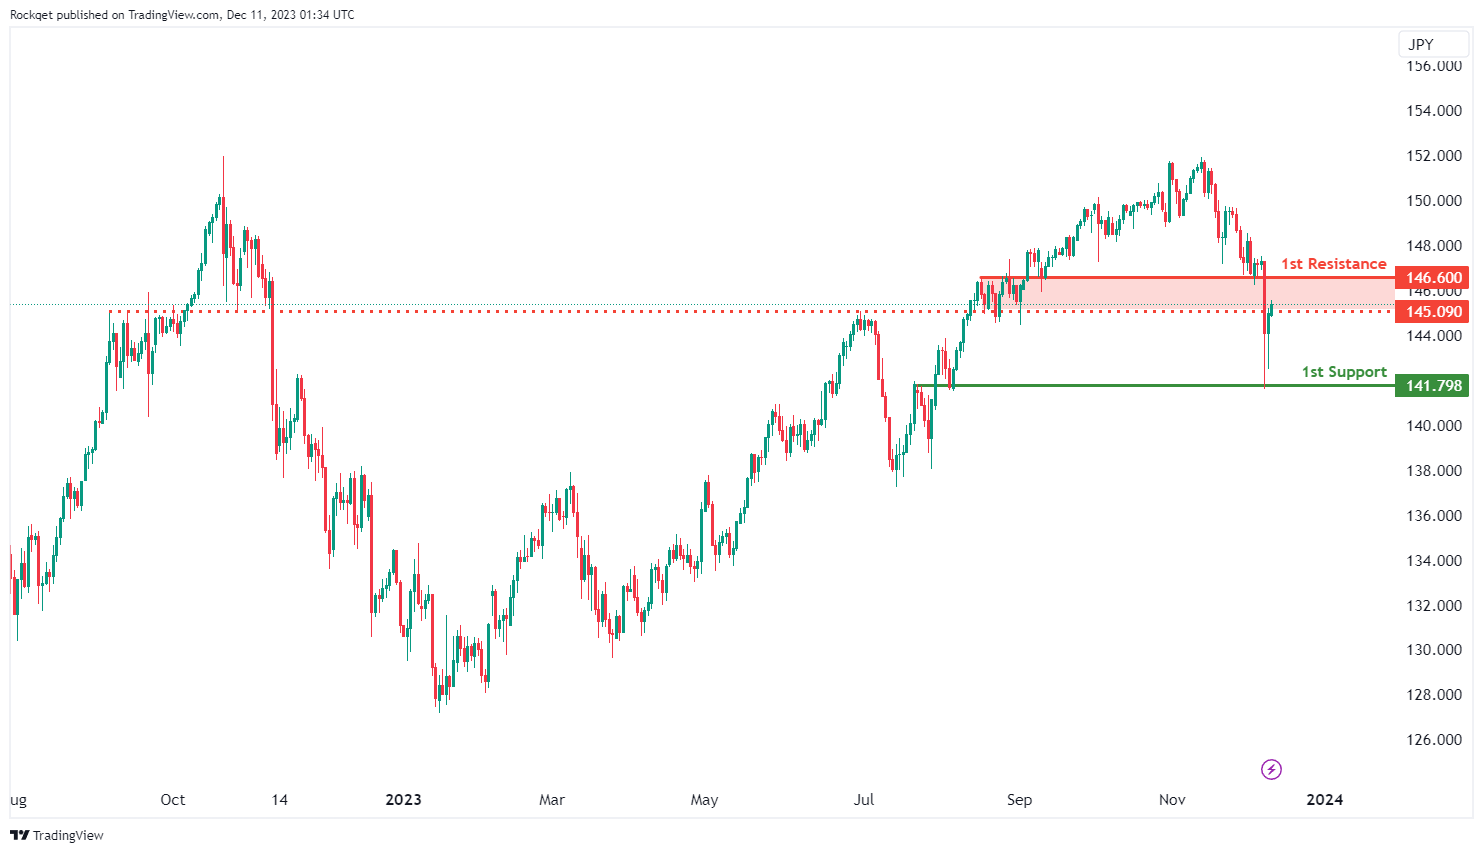
USD/JPY:
The USD/JPY chart currently has a bullish overall momentum. However, there’s potential for a bearish reaction off the 1st resistance level, followed by a drop towards the 1st support.
The 1st support at 141.79 is categorized as an overlap support. This level is significant as it suggests a potential area where buying interest may emerge, providing support for USD/JPY.
On the resistance side, the 1st resistance at 146.60 is identified as a pullback resistance. This level is likely to act as a barrier where selling interest could intensify, potentially leading to a bearish reaction.
Intermediate resistance at 145.09 is another level to watch, as it also acts as pullback resistance and could influence the price movement.
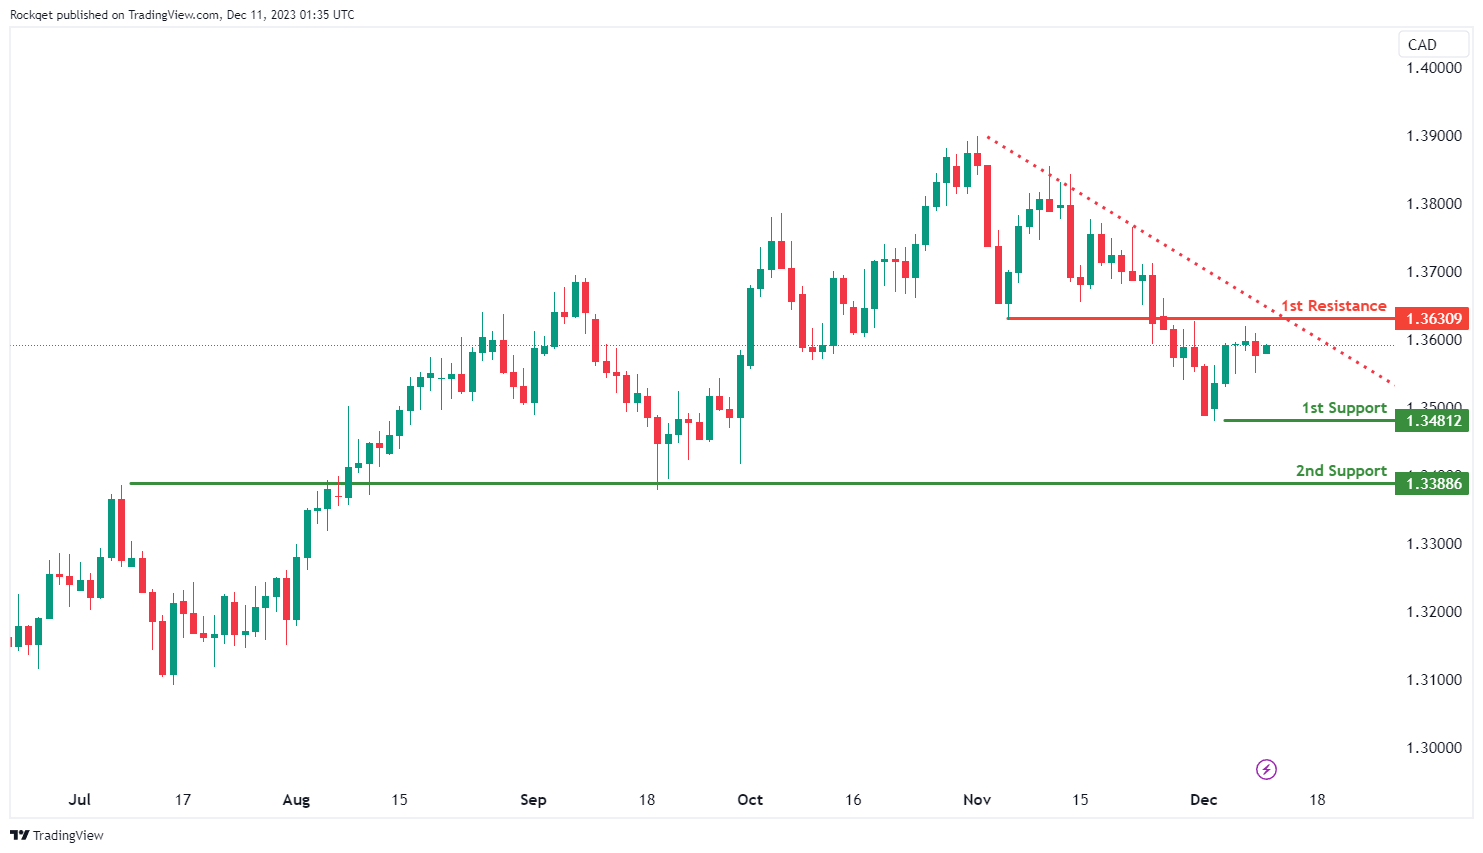
USD/CAD:
The USD/CAD chart currently exhibits a bearish overall momentum, and there’s a potential scenario where price could make a bearish reaction off the 1st resistance level and drop to the 1st support.
The 1st support at 1.3481 is identified as a swing low support, suggesting that it could be a significant level where buying interest may emerge, potentially providing support for the USD/CAD pair.
The 2nd support at 1.3388 is categorized as an overlap support, further reinforcing its significance as a potential level where buyers might become active.
On the resistance side, the 1st resistance at 1.3630 is noted as an overlap resistance. This level is likely to act as a substantial barrier where selling interest may intensify, potentially leading to a bearish reversal.
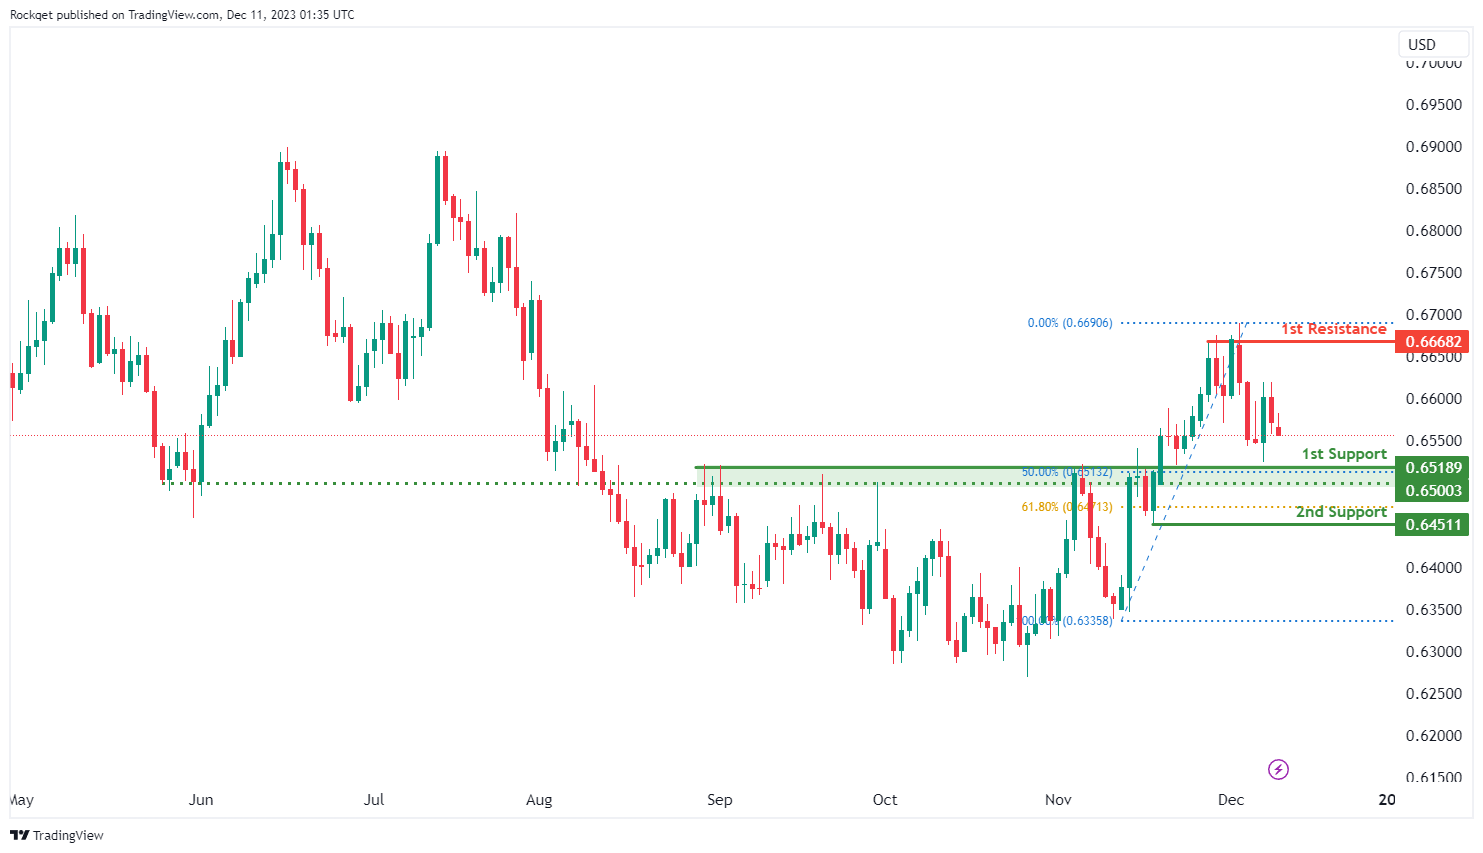
AUD/USD:
The AUD/USD chart currently shows a bullish overall momentum, and there’s a potential scenario where price could make a bullish bounce off the 1st support level and head towards the 1st resistance.
The 1st support at 0.6518 is identified as an overlap support and coincides with the 50% Fibonacci Retracement level. This level is significant and suggests it could act as a substantial area where buying interest may emerge, providing support for the AUD/USD pair.
The 2nd support at 0.6451 is noted as a 61.80% Fibonacci Retracement level, reinforcing its significance as a potential level where buyers might become active.
On the resistance side, the 1st resistance at 0.6668 is categorized as multi-swing high resistance. This level is likely to act as a substantial barrier where selling interest may intensify, potentially limiting upward movements.
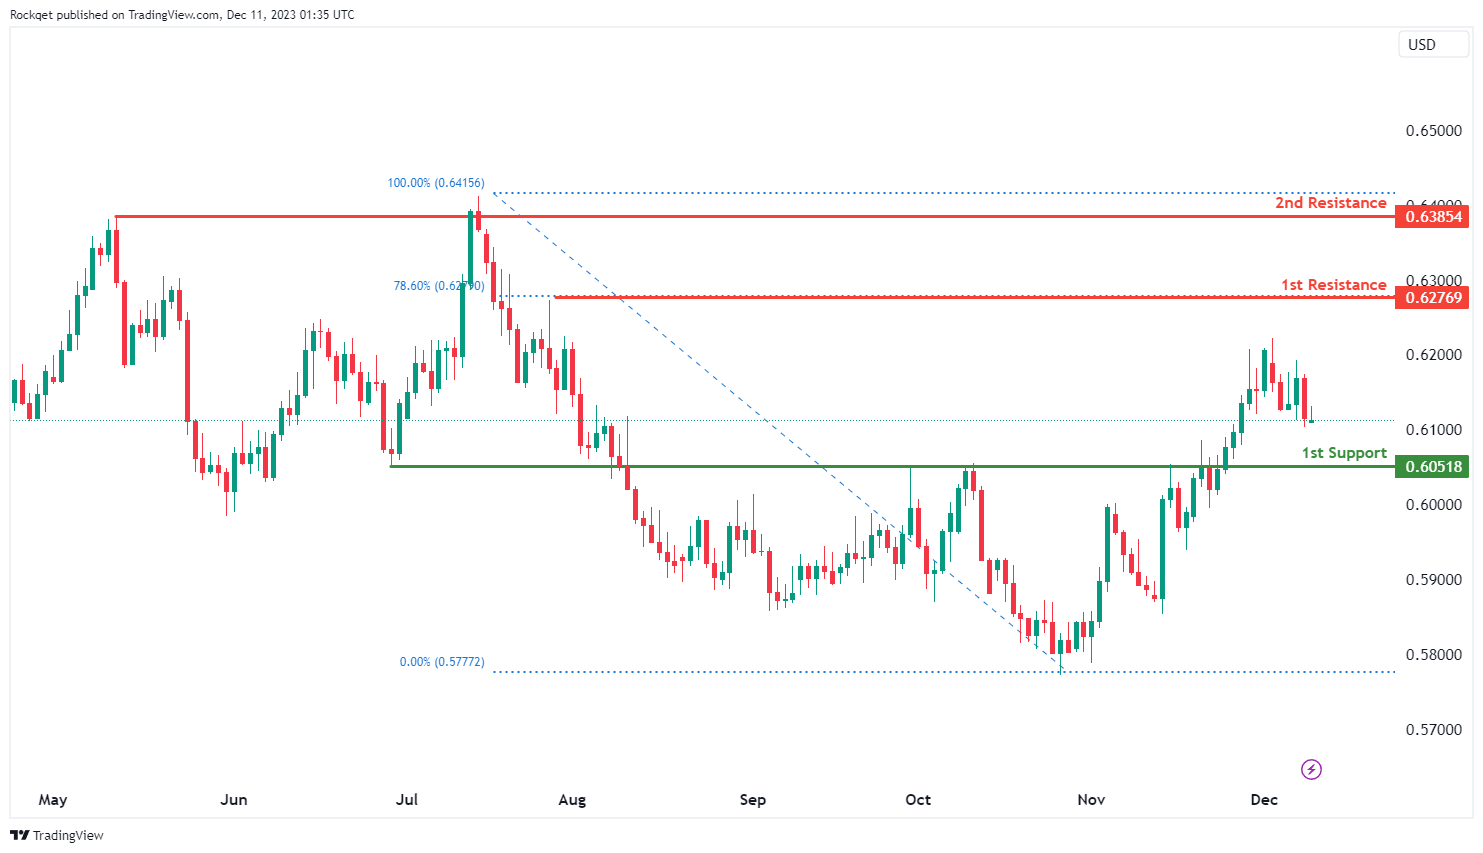
NZD/USD
The NZD/USD chart currently exhibits a bullish overall momentum, and there’s a potential scenario where price could make a bullish bounce off the 1st support level and head towards the 1st resistance.
The 1st support at 0.6053 is categorized as pullback support, indicating it as a significant level where buying interest may emerge, potentially providing support for NZD/USD.
On the resistance side, the 1st resistance at 0.6276 is identified as an overlap resistance and coincides with the 78.60% Fibonacci Retracement level, suggesting a potential confluence of technical factors that could act as a substantial barrier where selling interest may intensify.
Further up, the 2nd resistance at 0.6389 is categorized as a swing high resistance.
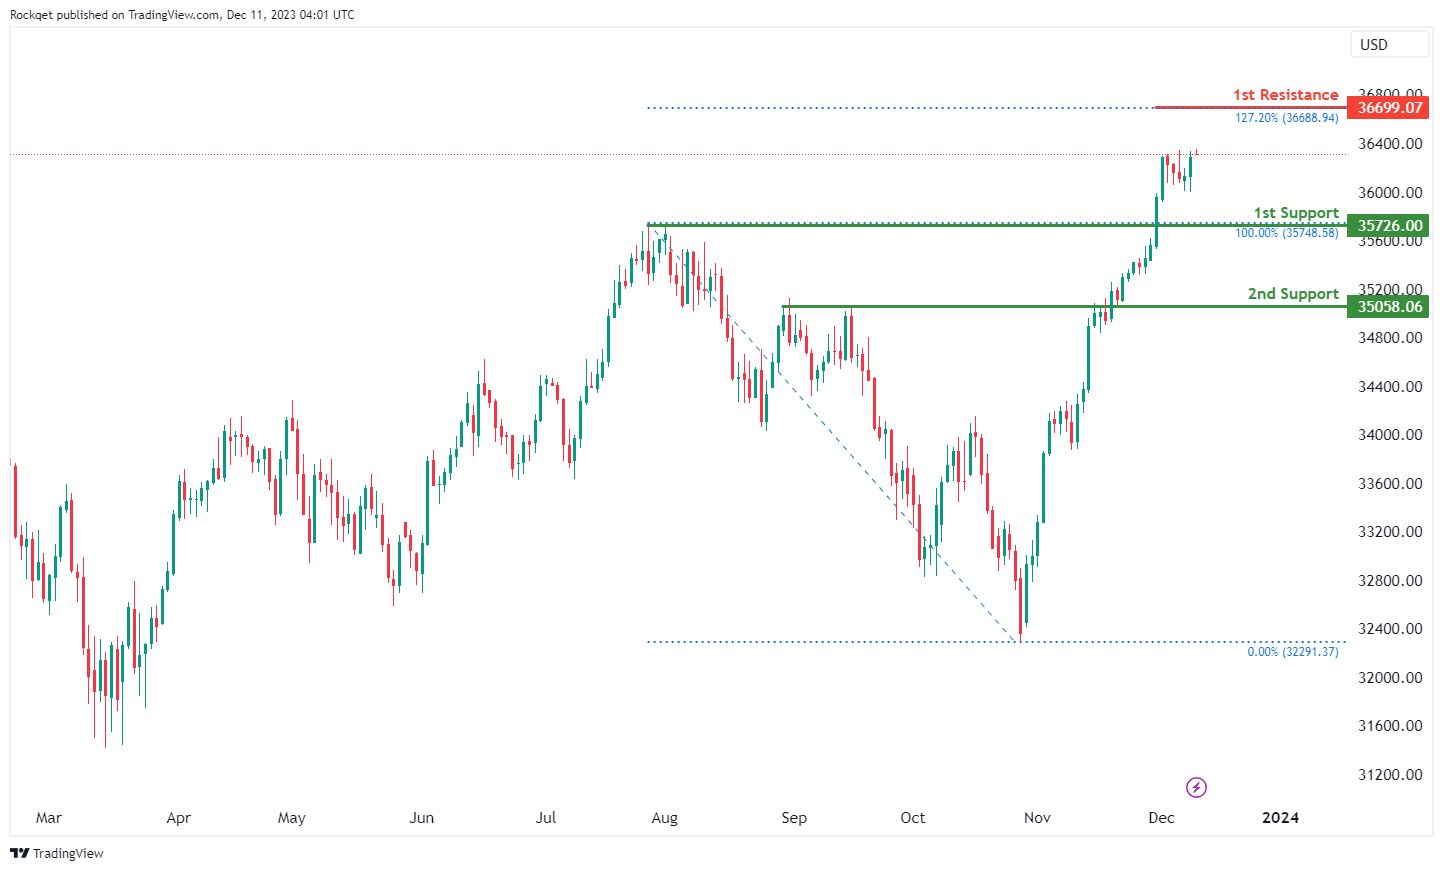
DJ30:
The DJ30 shows a bearish overall momentum, indicating a prevailing downward trend. However, there is a short-term potential for a rise towards the first resistance before a reversal and a subsequent drop towards the first support.
1st Support at 35726.00: This level is identified as a pullback support, indicating a potential area where buying interest might emerge, contributing to a short-term stabilization in the price.
2nd Support at 35058.06: The second support is described as an overlap support, suggesting historical significance as a level where the price has found support in the past.
1st Resistance at 36699.07: The first resistance is noted as being at the 127.20% Fibonacci Extension level, signifying a potential barrier where the price might face selling pressure or a reversal within its bearish trend.
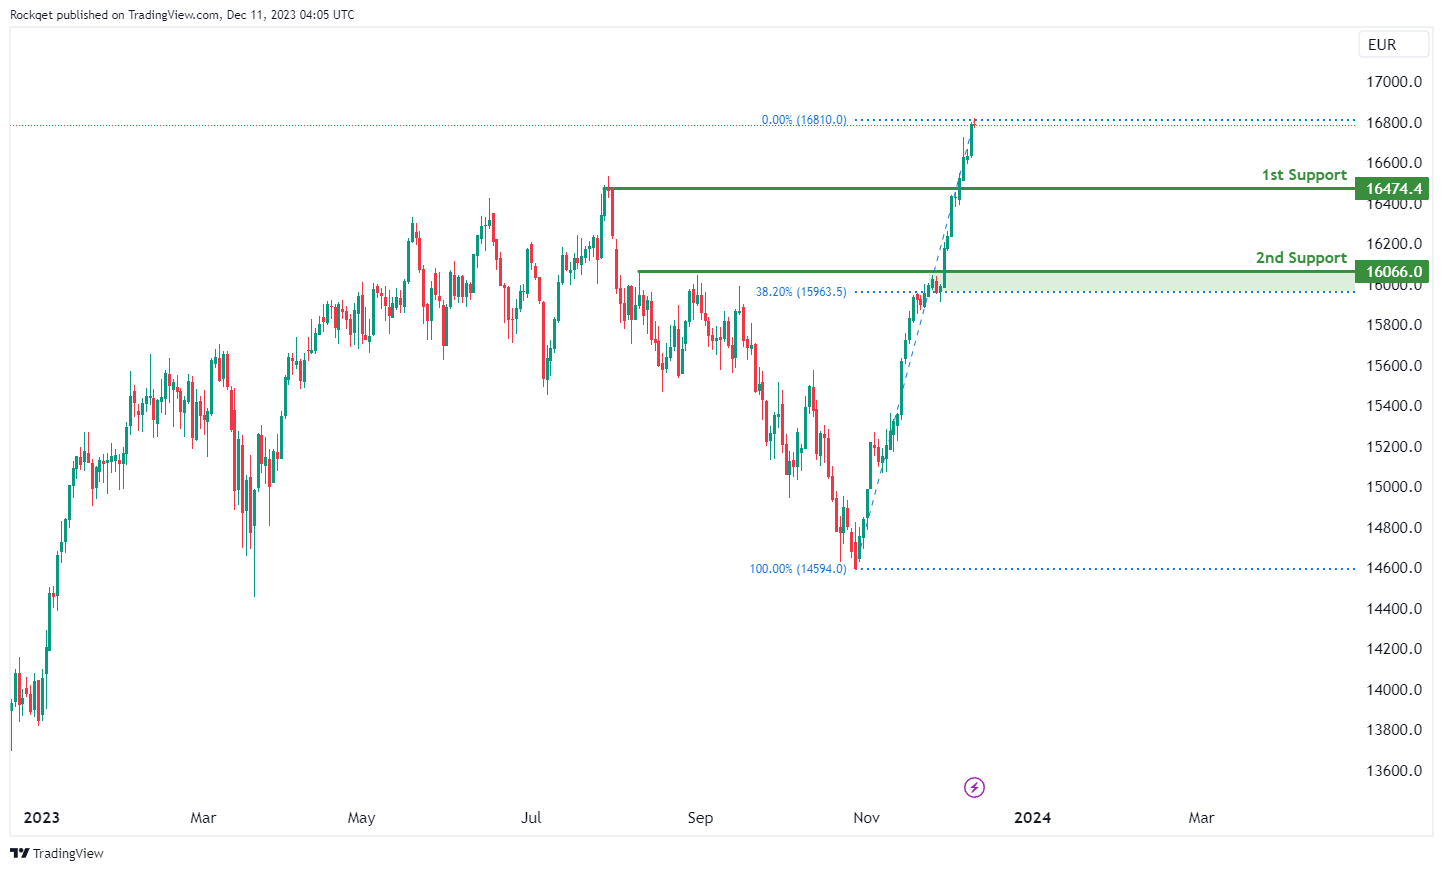
GER40:
The GER40 indicates a bullish overall momentum, suggesting a potential bullish continuation towards the first resistance.
1st Support at 16474.4: This level is identified as a pullback support, indicating a potential area where buying interest might emerge. It serves as a support zone for potential price stabilization.
2nd Support at 16066.0: The second support is described as a pullback support, reinforcing the notion that buyers might show interest at this level, potentially leading to a stabilization in price.
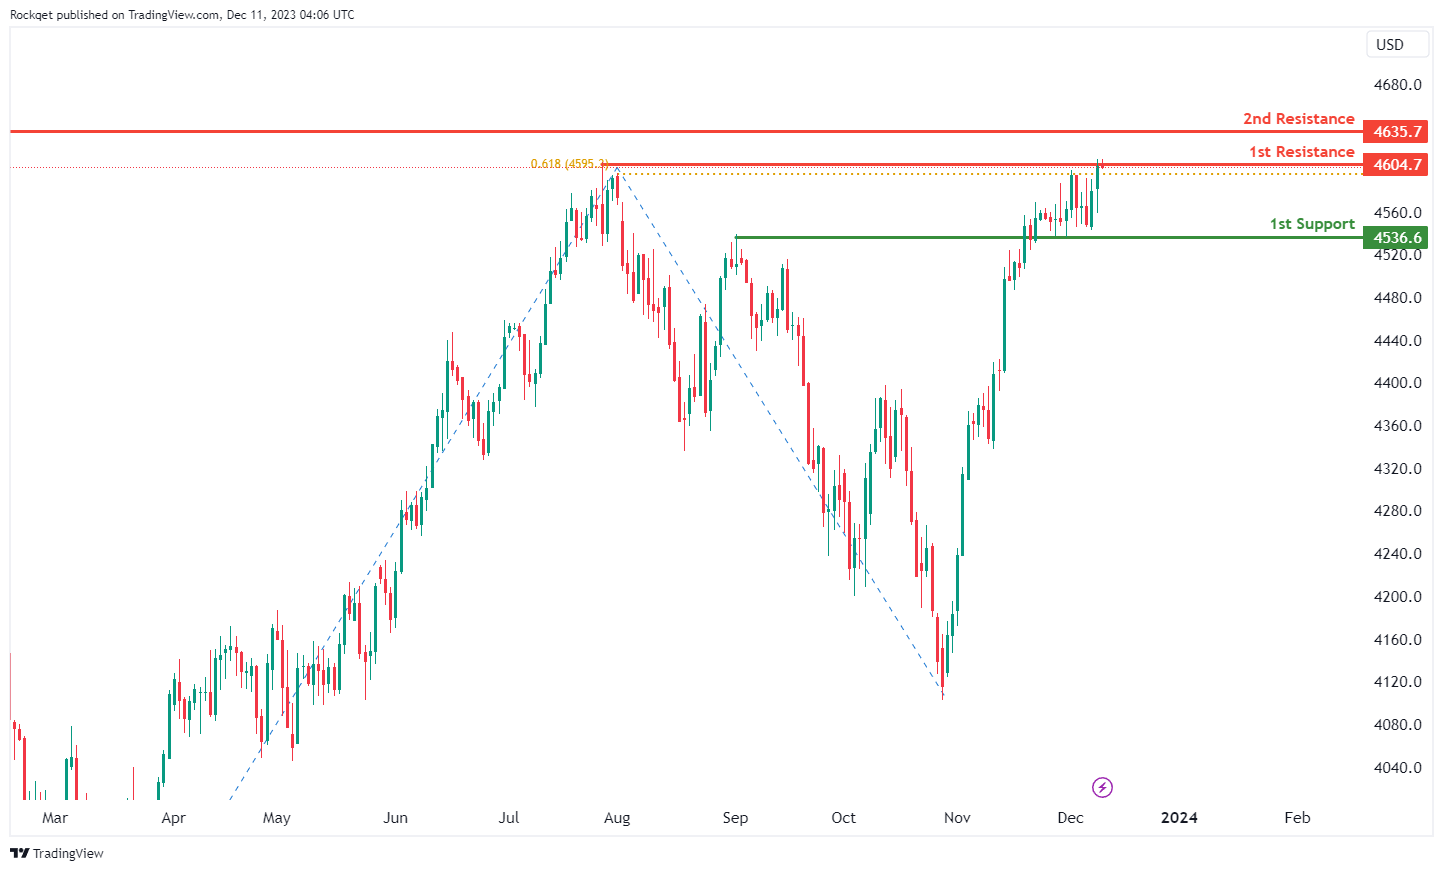
US500:
The chart of US500 indicates a bullish overall momentum, suggesting a potential bullish bounce off the first support and a subsequent movement towards the first resistance.
1st Support at 4536.6: This level is identified as an overlap support, indicating historical significance as a level where the price has found support. The overlapping support adds to its potential strength.
2nd Support at 4383.8: The second support is described as a pullback support, suggesting a level where buyers might show interest. This level contributes to the support zone, potentially stabilizing the price
1st Resistance at 4604.7: The first resistance is recognized as a multi-swing high resistance, signifying a historical point where the price has faced obstacles and potential reversals. Additionally, it aligns with the -61.8% Fibonacci Projection, adding further significance to this resistance level.
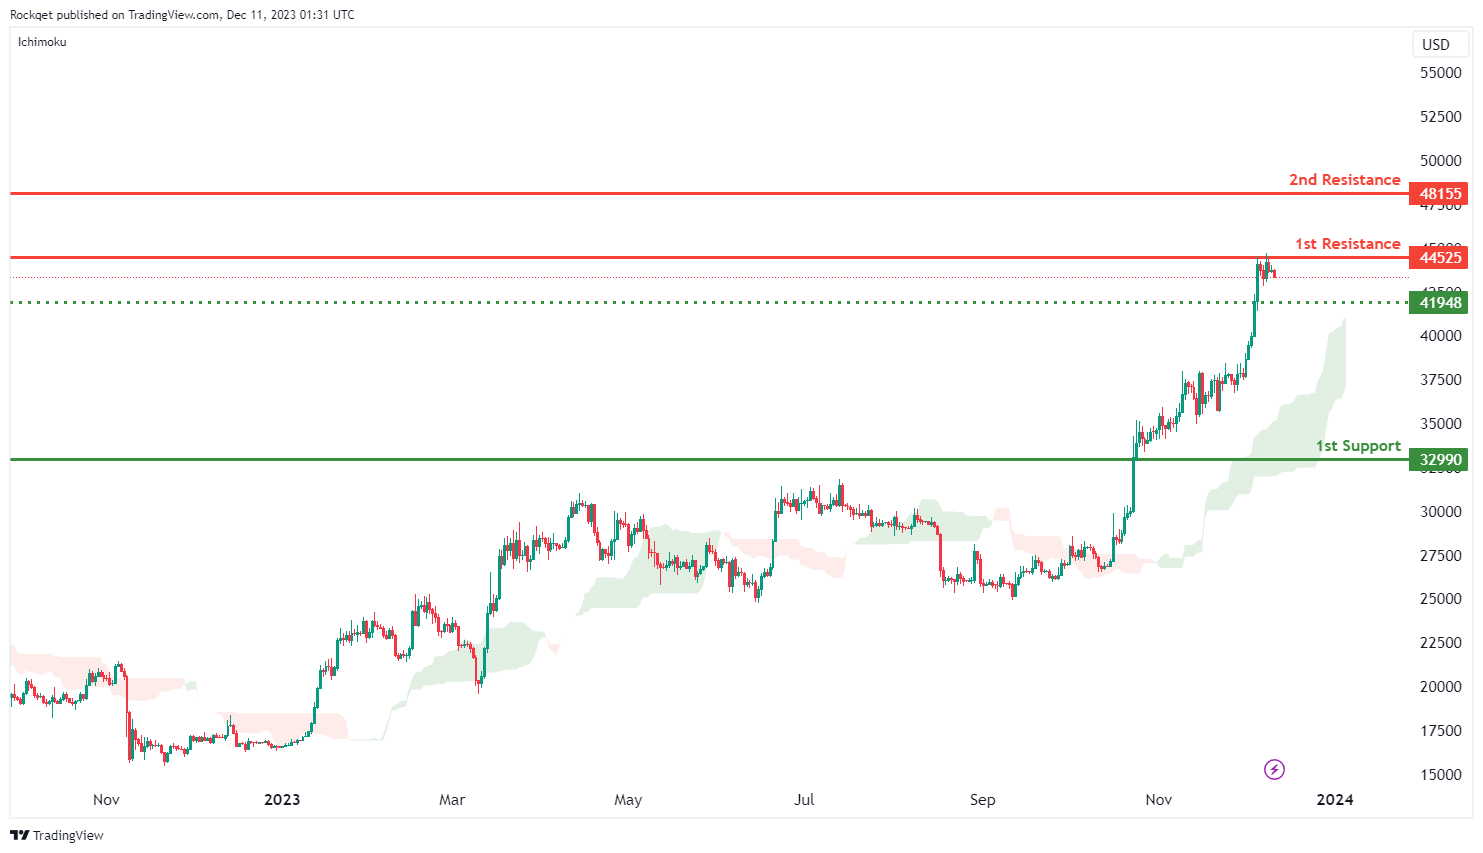
BTC/USD:
The BTC/USD chart currently has a bullish overall momentum, and there’s a potential scenario where price could make a bullish bounce off the 1st support level and head towards the 1st resistance.
The 1st support at 32,990 is identified as a pullback support, suggesting that it could be a significant level where buying interest may emerge, potentially providing support for the BTC/USD pair.
The intermediate support at 41,948 is also categorized as a pullback support, further reinforcing its significance as a potential level where buyers might become active.
On the resistance side, the 1st resistance at 48,155 is noted as a multi-swing high resistance. This level is likely to act as a substantial barrier where selling interest may intensify, potentially triggering a bearish reversal.
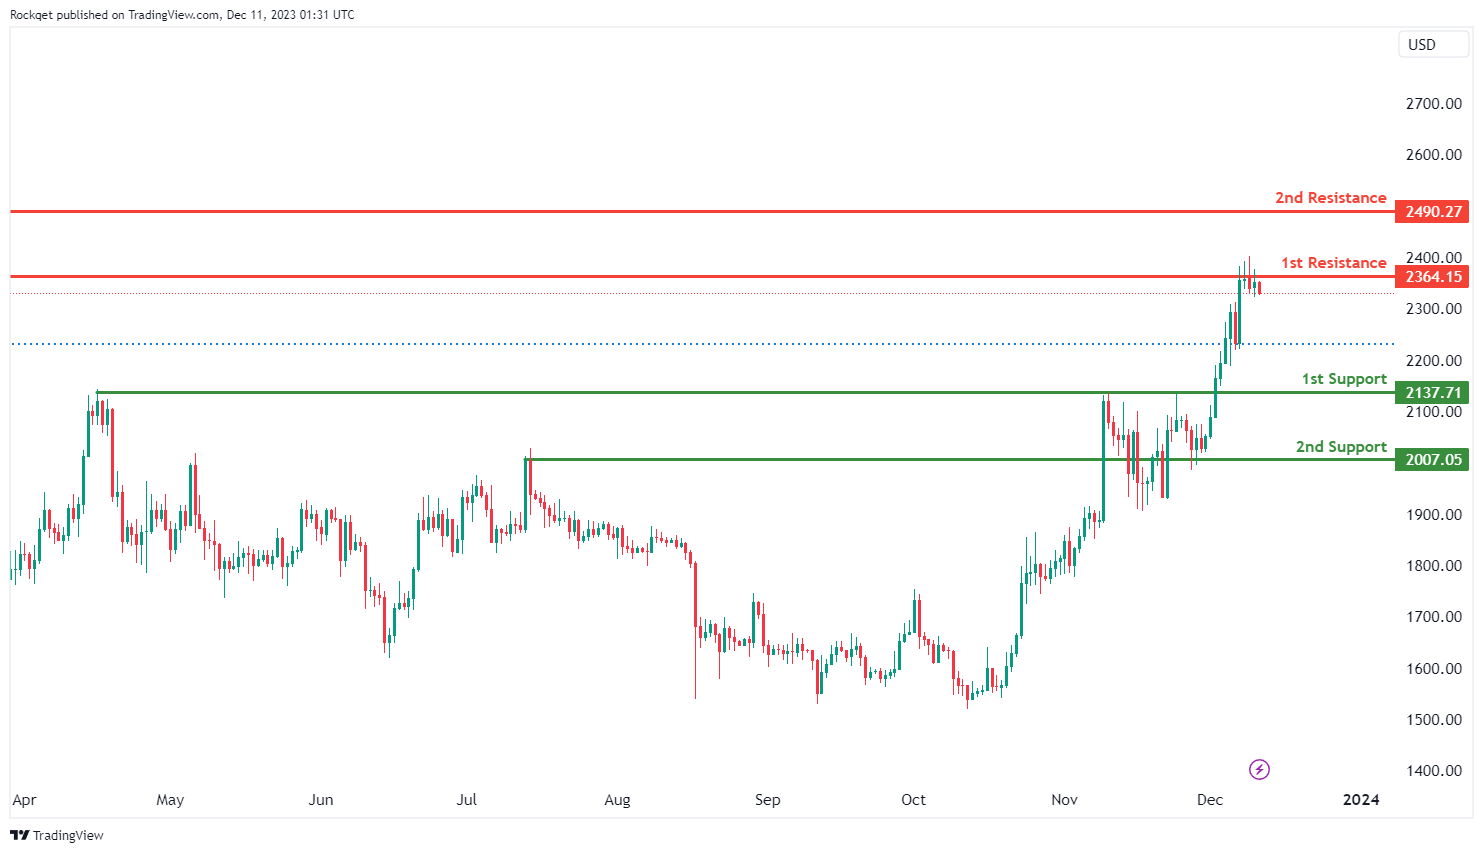
ETH/USD:
The ETH/USD chart currently has a bullish overall momentum, and there’s a potential scenario where price could make a bullish bounce off the 1st support level and head towards the 1st resistance.
The 1st support at 2,137.71 is identified as a pullback support, suggesting that it could be a significant level where buying interest may emerge, potentially providing support for the ETH/USD pair.
The 2nd support at 2,007.05 is categorized as an overlap support, further reinforcing its significance as a potential level where buyers might become active.
On the resistance side, the 1st resistance at 2,364.15 is noted as a multi-swing high resistance. This level is likely to act as a substantial barrier where selling interest may intensify, potentially triggering a bearish reversal.
The 2nd resistance at 2,490.27 is categorized as a pullback resistance, indicating another level where selling pressure may increase.
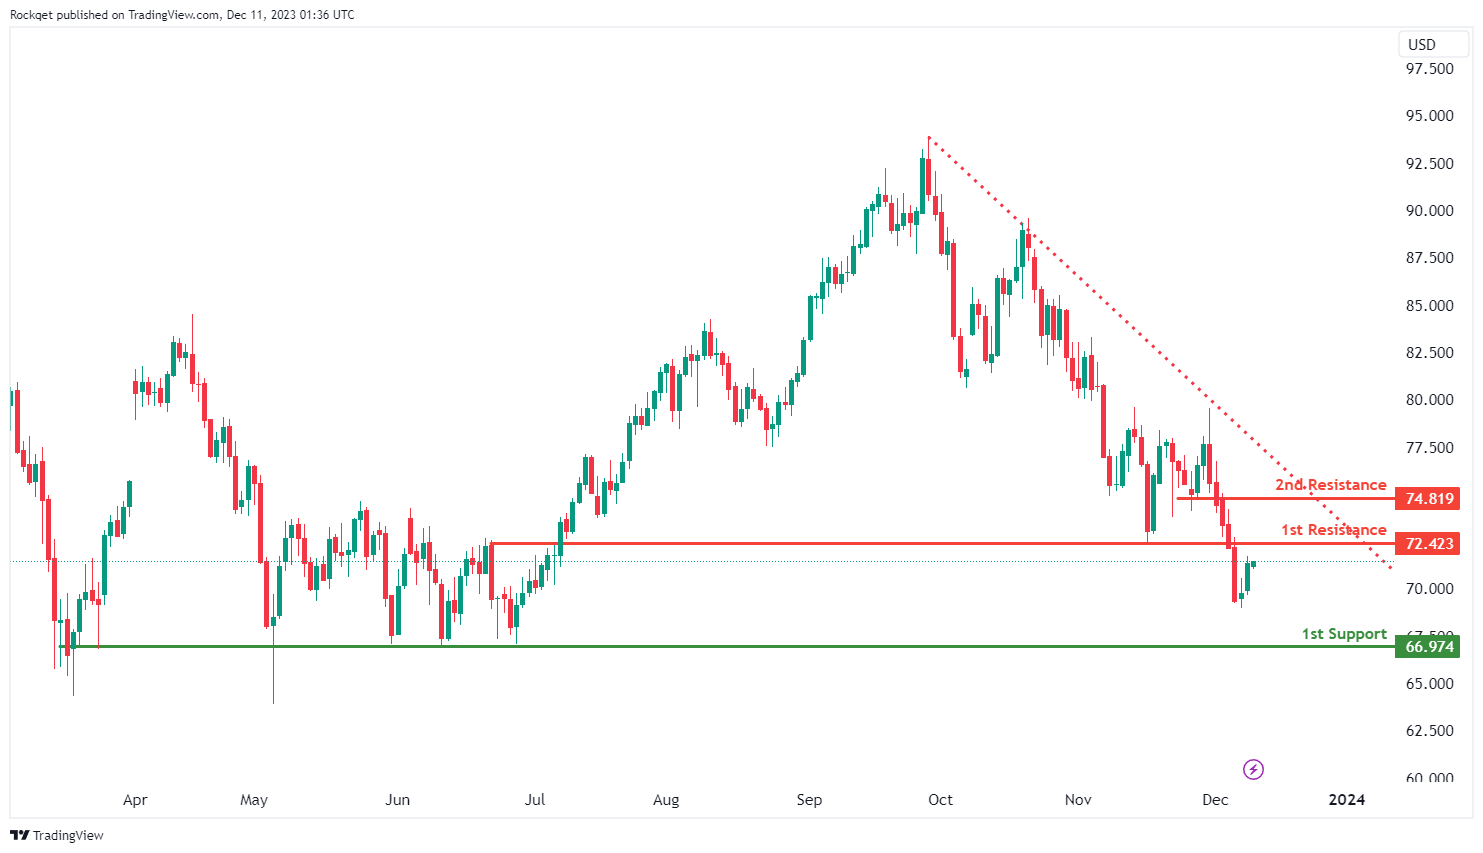
WTI/USD:
The WTI chart currently has a bearish overall momentum, and this bearishness is reinforced by the fact that price is trading below a major descending trend line, indicating a bearish trend is in place.
There’s a potential scenario where price could make a bearish reaction off the 1st resistance level and drop towards the 1st support.
The 1st support at 66.97 is categorized as a multi-swing low support. This level is significant as it implies a potential area where buying interest may emerge, potentially providing support for WTI.
On the resistance side, the 1st resistance at 72.42 is identified as pullback resistance. This level is likely to act as a substantial barrier where selling interest could intensify, potentially causing a bearish reaction.
Further up, the 2nd resistance at 74.81 is also categorized as pullback resistance, suggesting another level where selling pressure may increase.
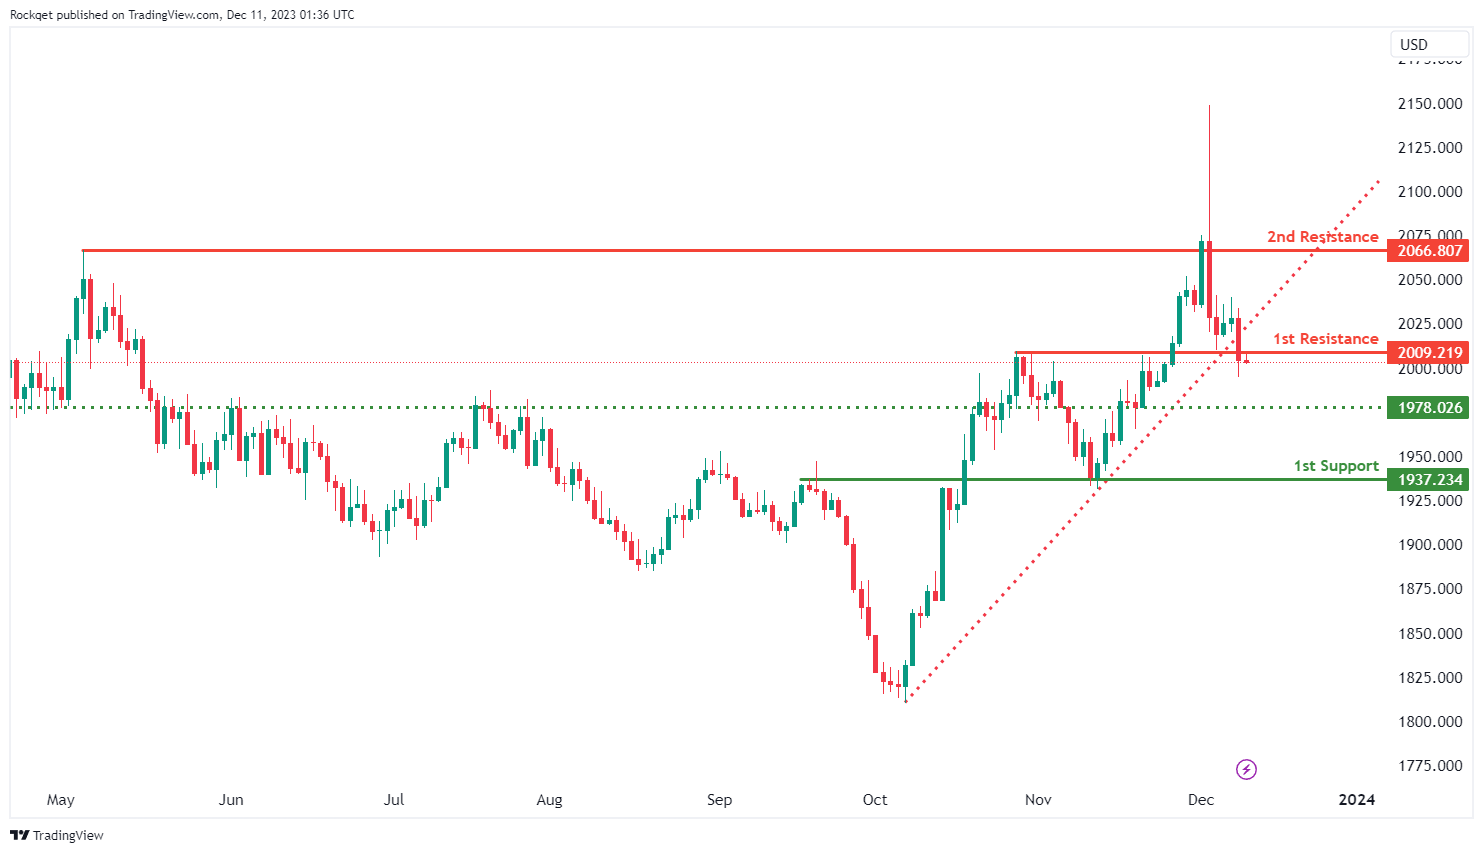
XAU/USD (GOLD):
The XAU/USD chart currently has a bearish overall momentum, and this is attributed to the price breaking below an ascending support line, indicating the potential for a bearish move.
There’s a possibility that price could make a bearish reaction off the 1st resistance level and drop towards the 1st support.
The 1st support at 1937.23 is categorized as an overlap support, which suggests it could be a significant level where buying interest may emerge, potentially providing support for XAU/USD.
Intermediate support at 1978.02 is another level to consider, as it’s identified as pullback support and could act as a potential area where buyers become active.
On the resistance side, the 1st resistance at 2009.21 is noted as pullback resistance, indicating it could be a substantial barrier where selling interest may intensify, potentially causing a bearish reaction.
Further up, the 2nd resistance at 2066.80 is also categorized as pullback resistance, suggesting another level where selling pressure may increase.


