
DXY:
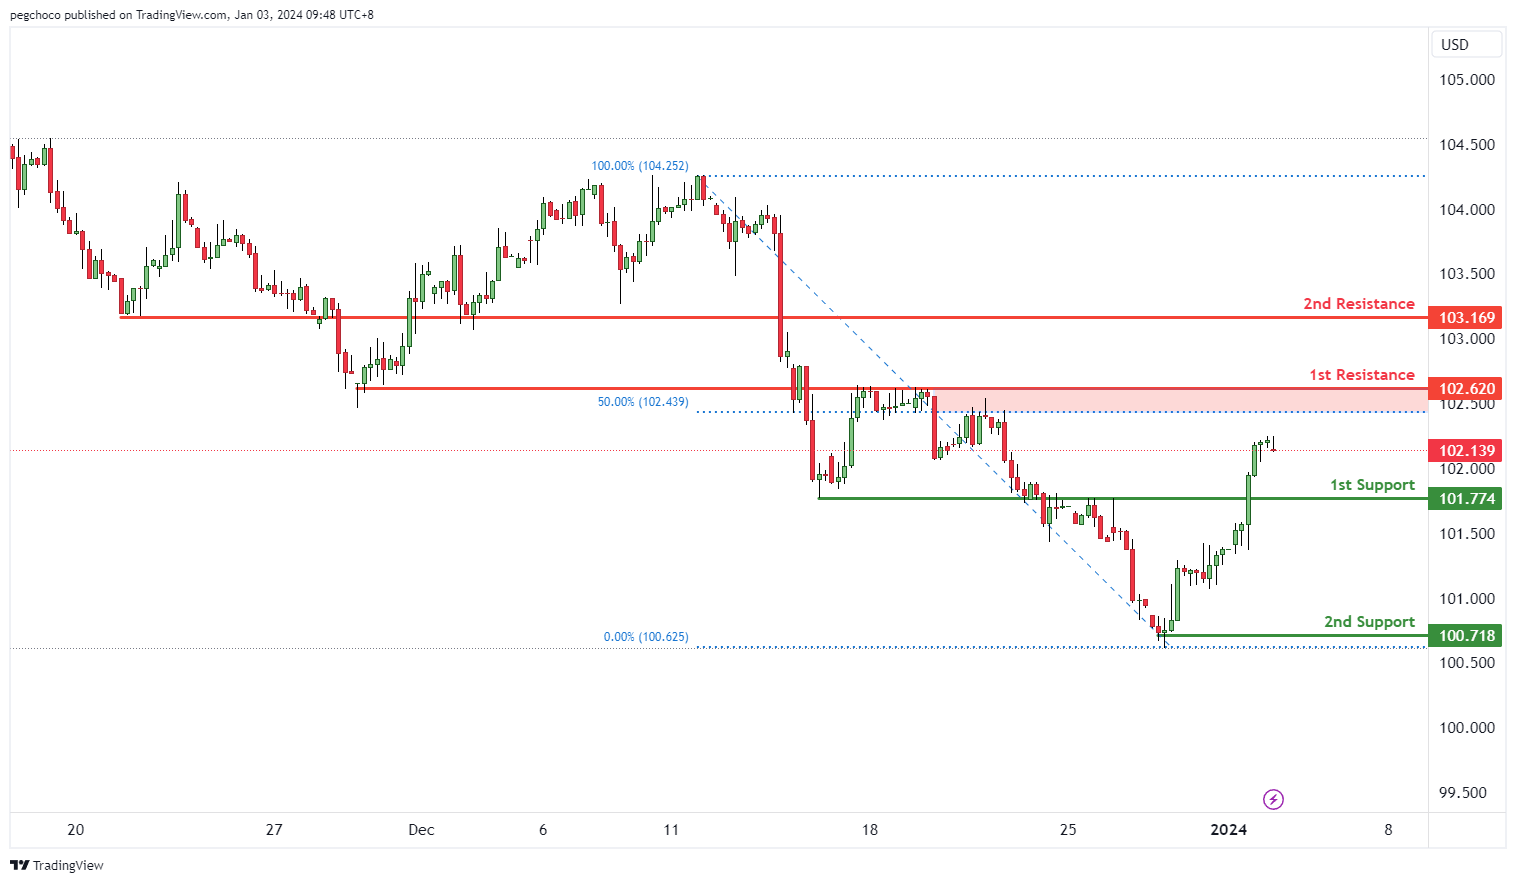
The DXY (US Dollar Index) chart currently exhibits a bullish overall momentum, suggesting a strengthening of the US Dollar. Price could potentially experience a bullish bounce off the 1st support level and move towards the 1st resistance level.
The 1st support at 101.77 is identified as a pullback support. This level is significant because it suggests a potential area where buying interest may emerge, providing temporary support for the US Dollar.
The 2nd support at 100.71 is another key level categorized as a swing low support. Swing lows are often seen as important areas of price reversal, further enhancing the significance of this support level.
On the resistance side, the 1st resistance at 102.62 is identified as an overlap resistance and coincides with the 50% Fibonacci Retracement level. This confluence of factors makes it a substantial barrier where selling interest could intensify, potentially leading to a bearish reversal.
The 2nd resistance at 103.16 is categorized as a pullback resistance, indicating another level where selling pressure may increase.
EUR/USD:
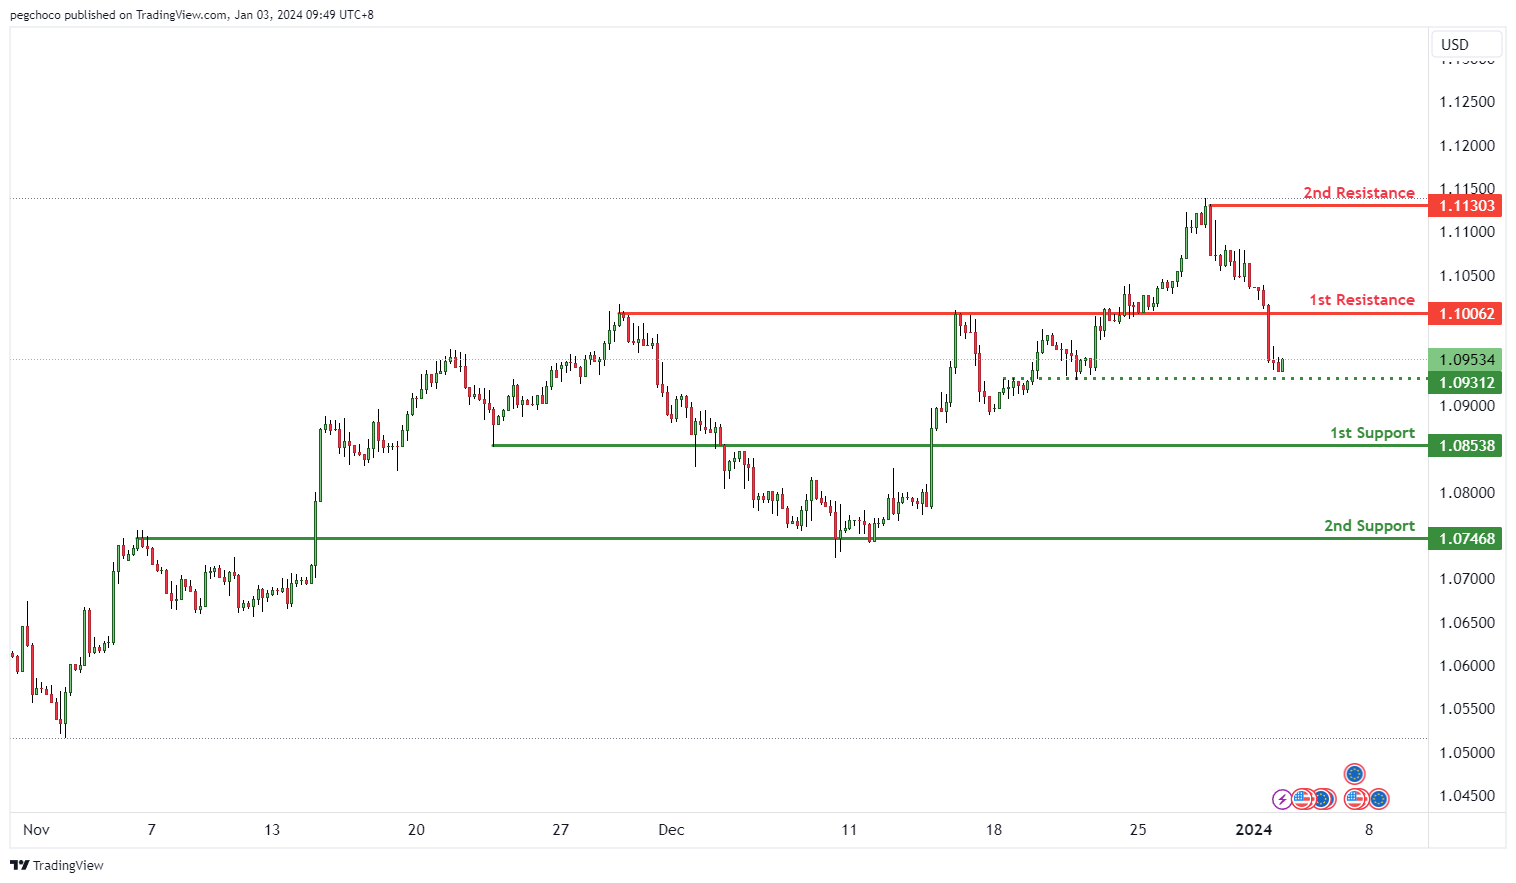
The EUR/USD chart currently has a bearish overall momentum, indicating a weaker Euro compared to the US Dollar. Price could potentially continue its bearish movement towards the 1st support level.
The 1st support at 1.0853 is categorized as a pullback support. This level is significant as it suggests a potential area where buying interest may emerge, providing temporary support for the Euro against the US Dollar.
The 2nd support at 1.0746 is identified as an overlap support. Overlap supports are areas where price has previously found stability and may act as a significant support zone.
On the resistance side, the 1st resistance at 1.1006 is categorized as a pullback resistance. This level may serve as a substantial barrier where selling interest could intensify, potentially leading to a bearish continuation.
The 2nd resistance at 1.1130 is noted as a swing high resistance. Swing highs often mark points of reversal or resistance in the price movement.
Additionally, there’s an intermediate support level at 1.0931, which is identified as an overlap support, further emphasizing the potential support zone for the EUR/USD.
EUR/JPY:
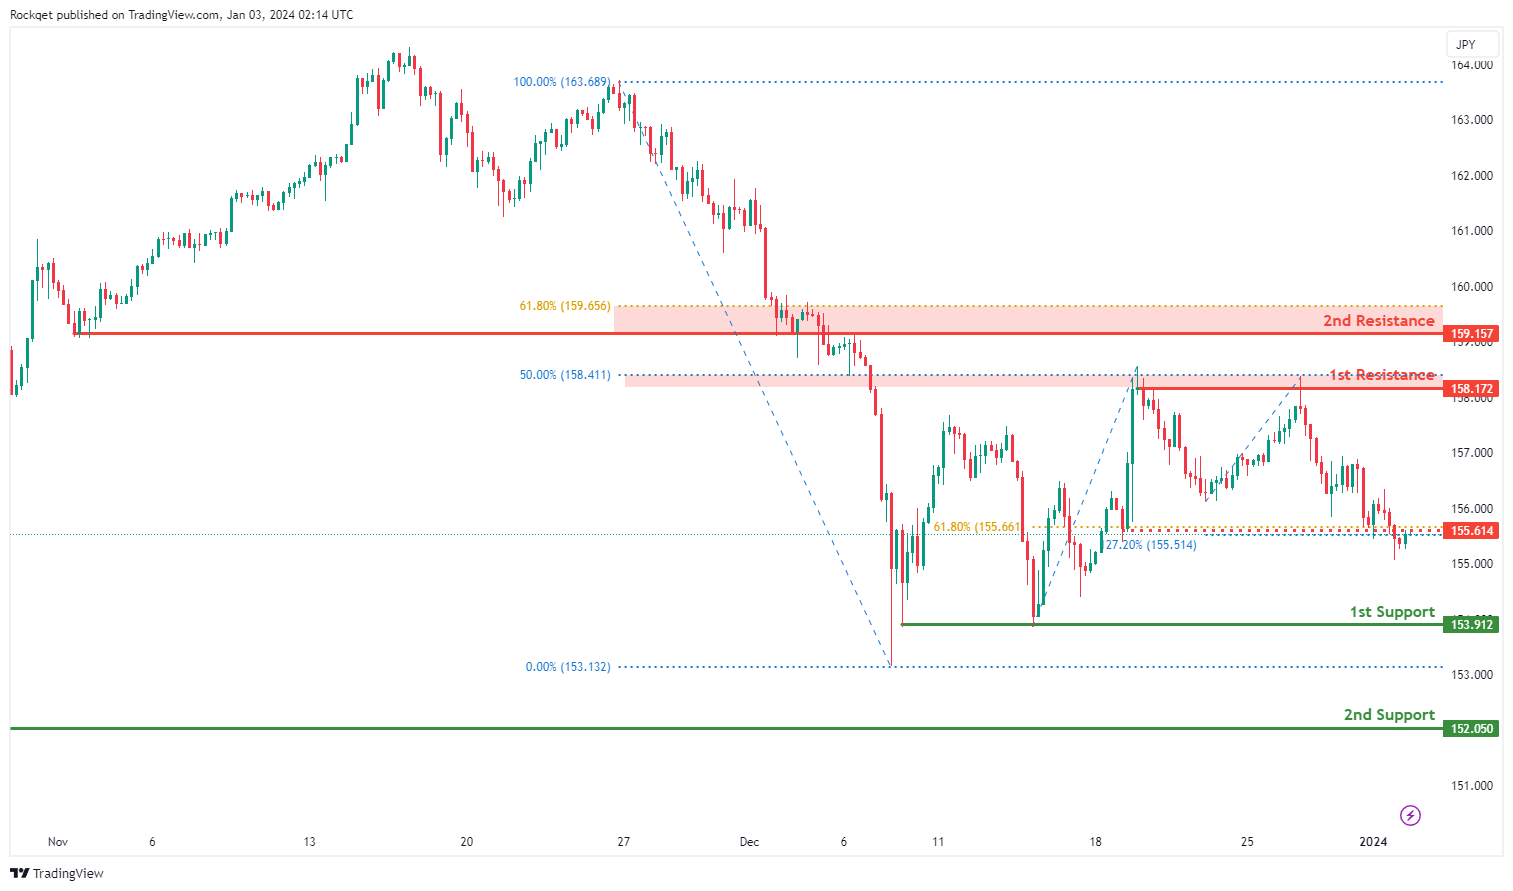
The EUR/JPY chart currently exhibits a bullish overall momentum, suggesting a potential scenario for a bullish continuation towards the 1st resistance.
The intermediate support at 155.62 is considered significant as it aligns with a pullback support, the 61.80% Fibonacci Retracement, and the -27% Fibonacci Expansion, indicating a historical area where buying interest has been present.
Additionally, the 1st support at 153.91 is identified as a multi-swing low support, providing an additional layer of potential support for the currency pair.
The 2nd support at 152.05 is identified as a swing low support, contributing to the overall bullish narrative.
On the resistance side, the 1st resistance at 158.17 is associated with a swing high resistance and the 61.80% Fibonacci Projection, indicating a level where selling interest could intensify. Furthermore, the 2nd resistance at 159.16 represents an overlap resistance and the 61.80% Fibonacci Retracement.
EUR/GBP:
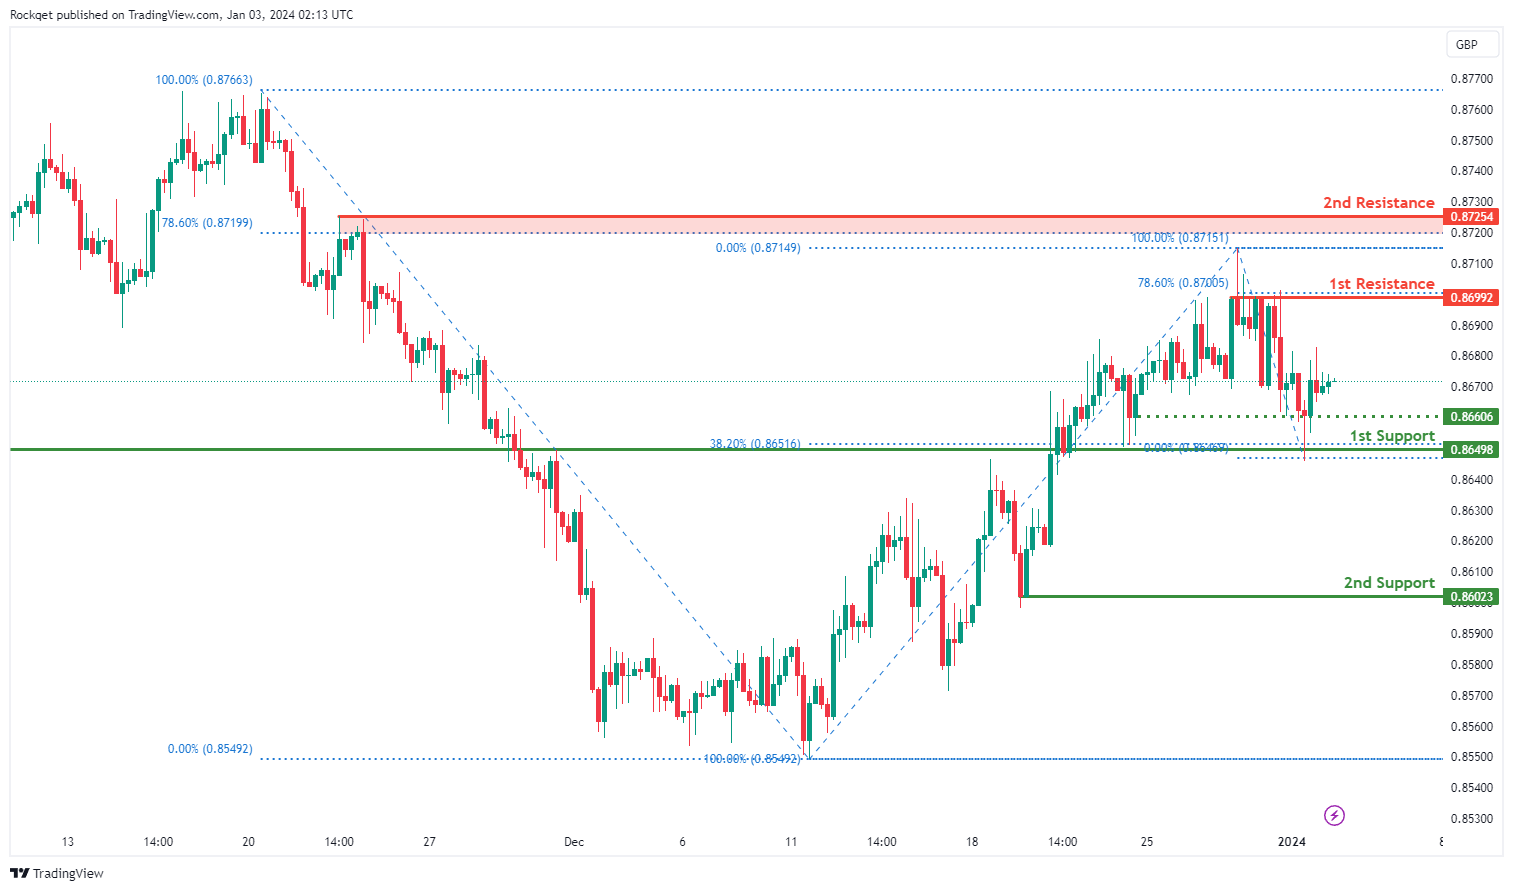
The EUR/GBP chart currently exhibits a weak bullish overall momentum with low confidence, suggesting a cautious outlook. There is a potential scenario for a bullish continuation towards the 1st resistance.
The 1st support at 0.8650 is deemed favorable due to its classification as an overlap support and coinciding with the 38.20% Fibonacci Retracement. This level has historical significance as it indicates a region where buying interest has previously emerged.
Additionally, the 2nd support at 0.8602 is identified as a pullback support, further reinforcing the potential for a bullish continuation.
An intermediate support level at 0.8661, characterized as a pullback support, provides an additional layer of potential support for the currency pair.
On the resistance side, the 1st resistance at 0.8699 is considered significant, representing a multi-swing high resistance and coinciding with the 78.60% Fibonacci Retracement. This level may act as a barrier where selling interest could materialize.
Furthermore, the 2nd resistance at 0.8725 is identified as a pullback resistance and aligns with the 78.60% Fibonacci Retracement.
GBP/USD:
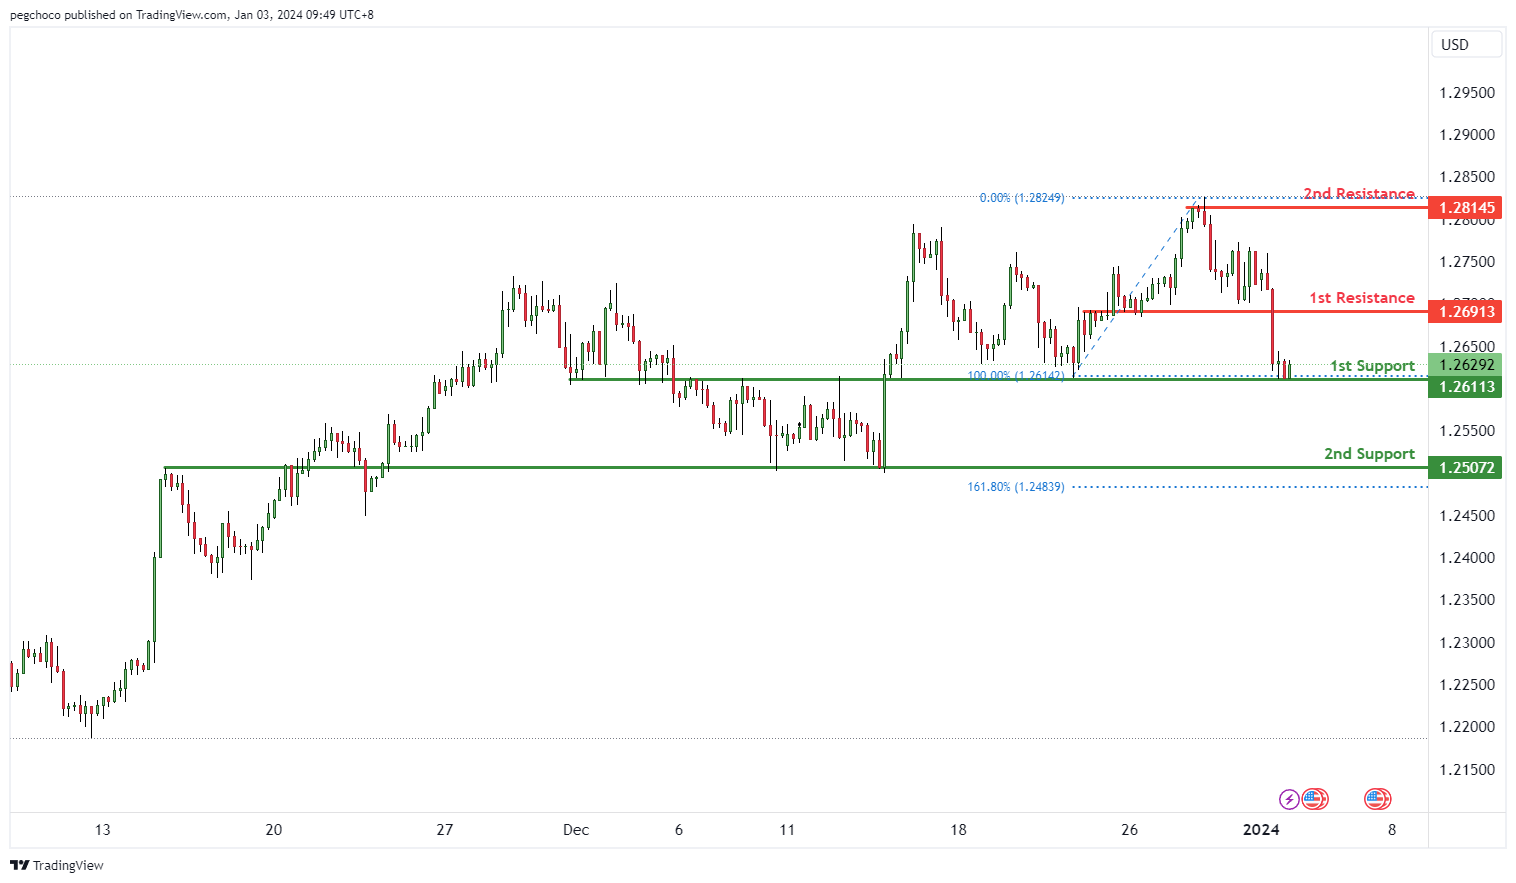
The GBP/USD chart currently has a bearish overall momentum, suggesting that the British Pound is weaker compared to the US Dollar. In the short term, there’s potential for a temporary rise towards the 1st resistance level before a reversal and a drop towards the 1st support.
The 1st support at 1.2611 is categorized as an overlap support. This level is significant as it suggests a potential area where buying interest may emerge, providing temporary support for the GBP/USD.
The 2nd support at 1.2507 is also identified as an overlap support, further reinforcing its significance as a potential support zone.
On the resistance side, the 1st resistance at 1.2691 is categorized as a pullback resistance. This level may act as a substantial barrier where selling interest could intensify, potentially triggering a bearish reversal in the short term.
The 2nd resistance at 1.2814 is noted as a swing high resistance. Swing highs often mark points of reversal or resistance in the price movement.
GBP/JPY:
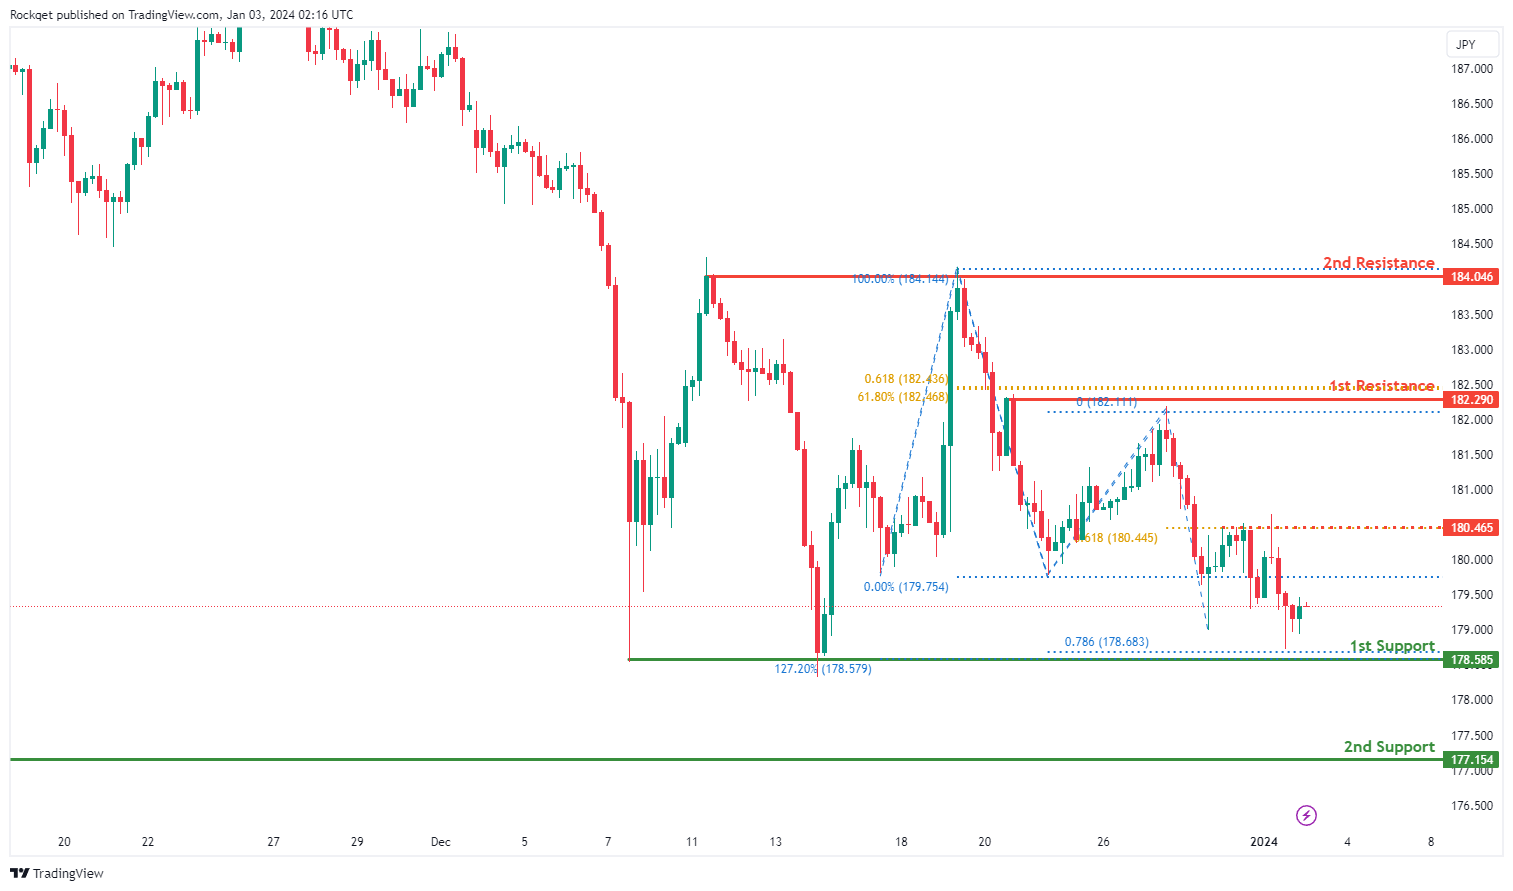
The GBP/JPY chart is currently exhibiting a bearish overall momentum, indicating a downward trend. There is a potential scenario for a bearish reaction off the 1st resistance, leading to a potential drop to the 1st support.
The 1st support at 178.59 is considered favorable for several reasons. Firstly, it is identified as a multi-swing low support, implying historical significance as a level where buying interest has previously emerged. Additionally, it coincides with the 127.20% Fibonacci Expansion and the 78.60% Fibonacci Projection, adding confluence to its significance.
The 2nd support at 177.15 is also recognized as a multi-swing low support, reinforcing its potential role as a level where buyers may step in.
On the resistance side, the 1st resistance at 182.29 is identified as a pullback resistance and coincides with both the 61.80% Fibonacci Projection and the 61.80% Fibonacci Retracement. This level may act as a barrier where selling interest could materialize.
The 2nd resistance at 184.05 is considered significant as it represents a multi-swing high resistance.
An intermediate resistance level at 180.47, characterized as a pullback resistance and aligned with the 61.80% Fibonacci Projection, provides an additional layer of potential resistance for the currency pair.
USD/CHF:
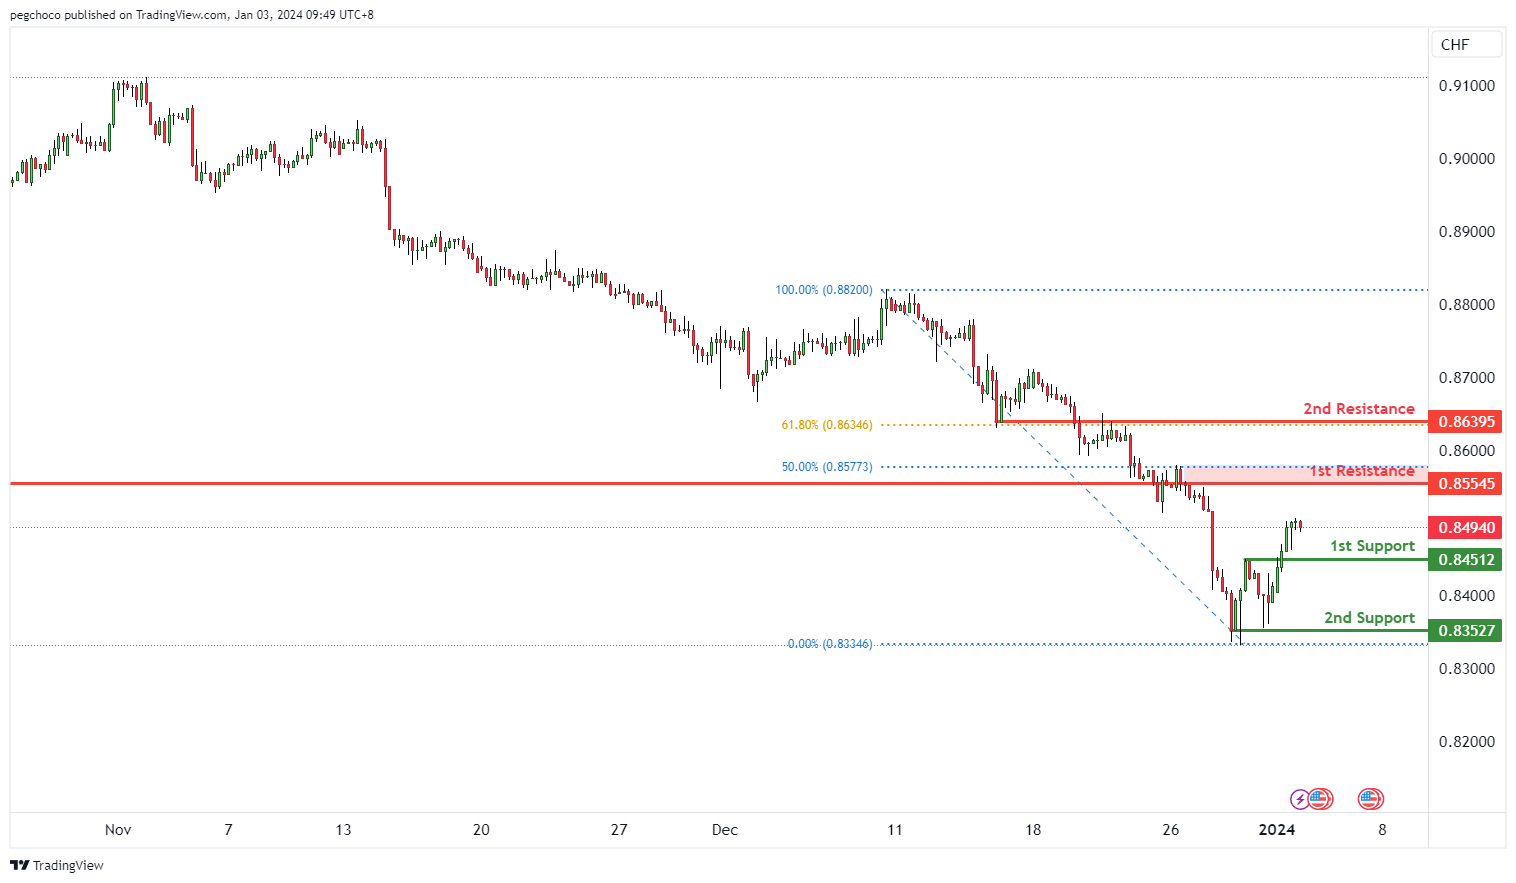
The USD/CHF chart currently has a bearish overall momentum, indicating that the US Dollar is weaker compared to the Swiss Franc. In the short term, there’s potential for a temporary rise towards the 1st resistance level before a reversal and a drop towards the 1st support.
The 1st support at 0.8451 is categorized as pullback support. This level is significant as it suggests a potential area where buying interest may emerge, providing temporary support for USD/CHF.
The 2nd support at 0.8352 is identified as multi-swing low support, further reinforcing its significance as a potential support zone.
On the resistance side, the 1st resistance at 0.8554 is categorized as an overlap resistance with a 50% Fibonacci retracement. This level may act as a substantial barrier where selling interest could intensify, potentially triggering a bearish reversal in the short term.
The 2nd resistance at 0.8639 is noted as an overlap resistance with a 61.80% Fibonacci retracement. These Fibonacci levels often add to the significance of resistance areas in price movements.
USD/JPY:
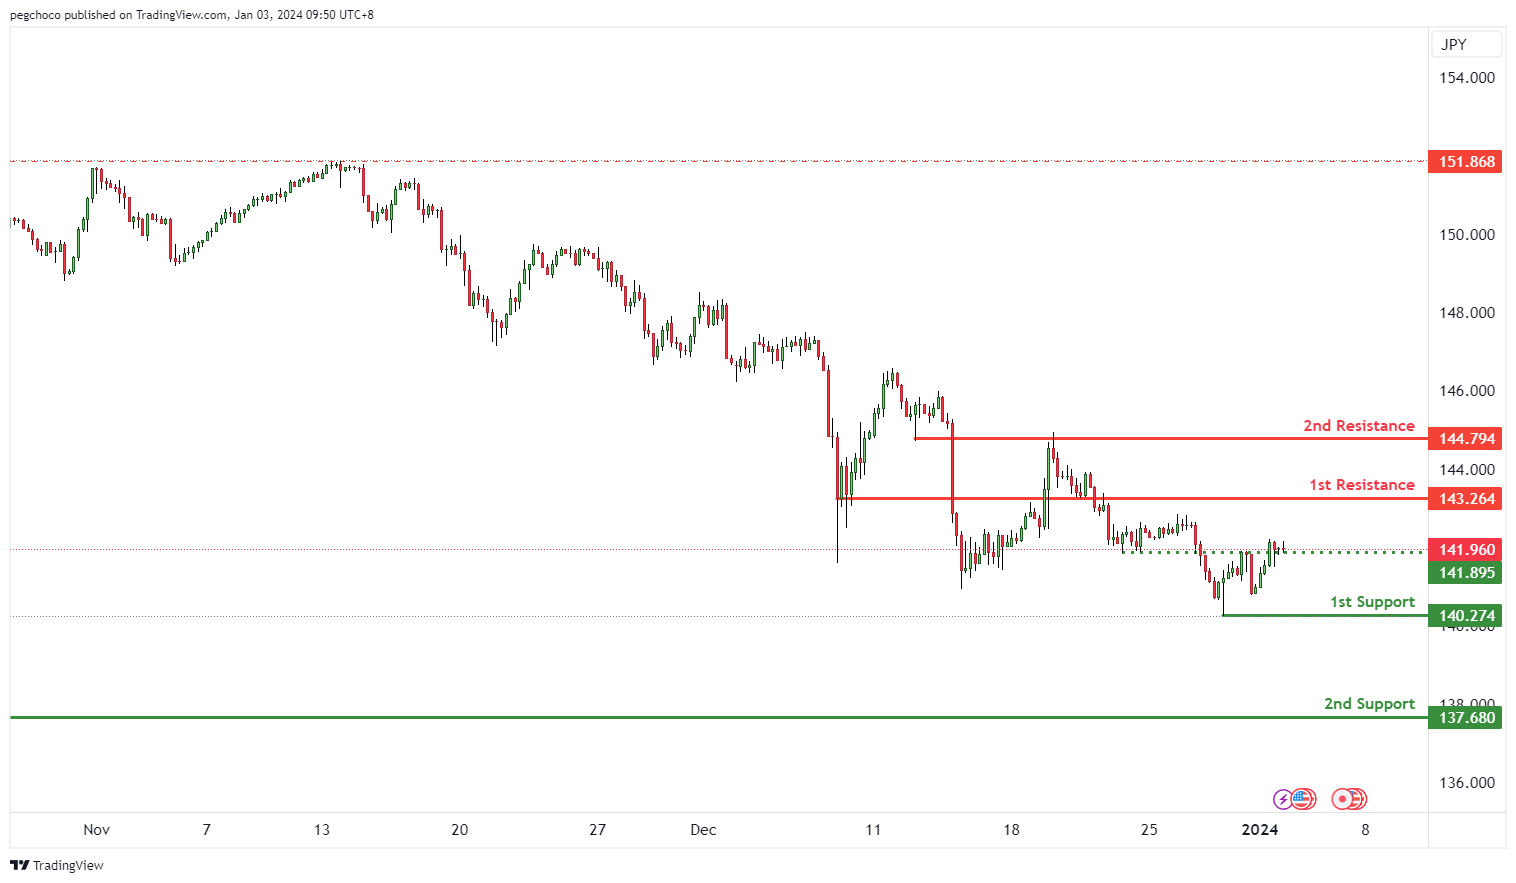
The USD/JPY chart currently exhibits a bearish overall momentum, suggesting that the US Dollar is weaker compared to the Japanese Yen. In the short term, there’s potential for a bearish continuation towards the 1st support level.
The 1st support at 140.27 is categorized as a swing low support. This level is significant as it indicates a historical price point where buying interest has previously emerged, potentially providing support to USD/JPY.
The 2nd support at 137.68 is also identified as a swing low support, further reinforcing its significance as a potential support zone.
On the resistance side, the 1st resistance at 143.26 is categorized as an overlap resistance. This level may act as a significant barrier where selling interest could intensify, potentially impeding any bullish attempts in the short term.
The 2nd resistance at 144.79 is also noted as an overlap resistance, further emphasizing its significance as a potential point of price reversal or resistance.
USD/CAD:
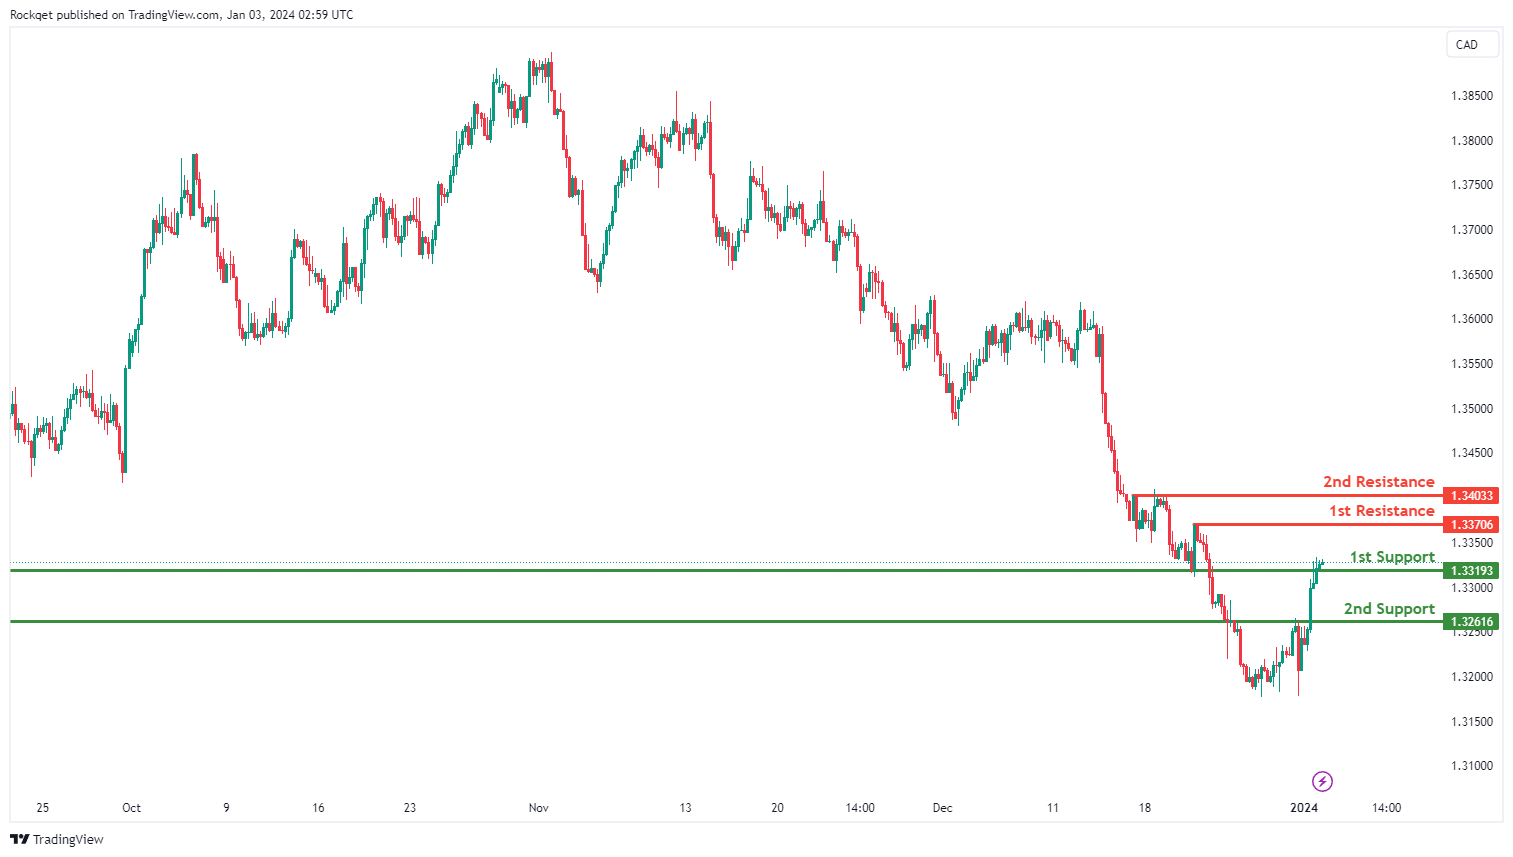
The USD/CAD chart currently exhibits an overall bullish momentum, indicating a new uptrend. In this context, there is a potential scenario for price to make a bullish continuation towards the 1st resistance.
The 1st resistance level at 1.3370 is identified as a pullback resistance. Higher up, the 2nd resistance level at 1.3403 is also marked as a pullback resistance, suggesting a potential barrier for further upside movement.
To the downside, the 1st support level at 1.3319 is identified as a pullback support. Further below, the 2nd support level at 1.3261 is noted as an overlap support, further reinforcing its importance as a key support level.
AUD/USD:
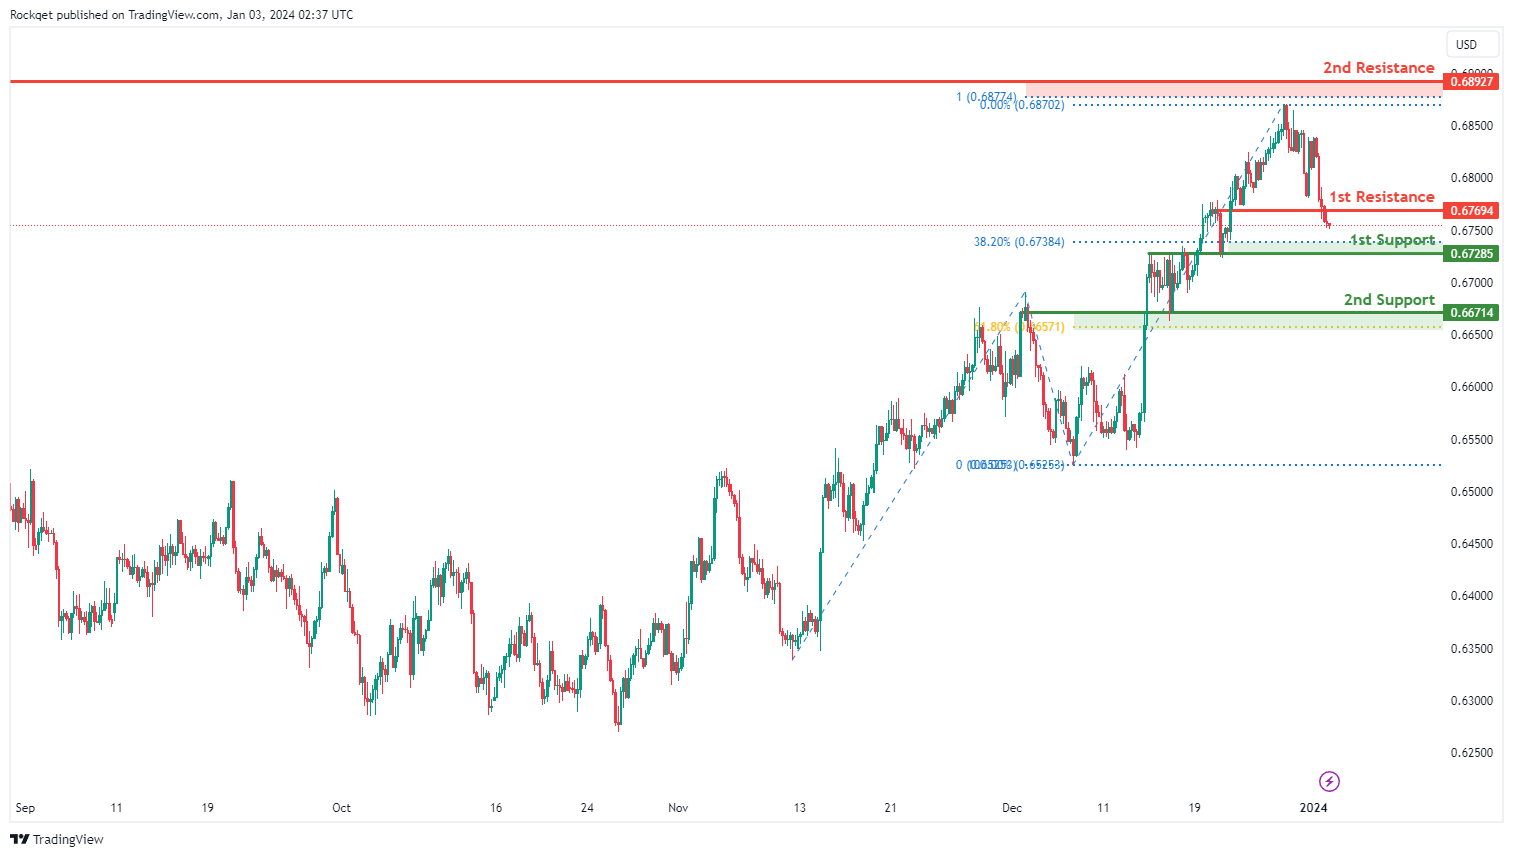
The AUD/USD chart currently exhibits an overall bearish momentum, indicating a new downtrend. In this context, there is a potential scenario for price to drop towards the 1st support.
The 1st support level at 0.6728 is identified as an overlap support that aligns close to the 38.20% Fibonacci retracement level. Further below, the 2nd support level at 0.6671 is also marked as an overlap support that aligns close to the 61.80% Fibonacci retracement level, further reinforcing its importance as a key support level.
To the upside, the 1st resistance level at 0.6769 is identified as an overlap resistance. Higher up, the 2nd resistance level at 0.6892 is noted as a multi-swing-high resistance that aligns close to the 100.00% Fibonacci projection level, indicating its potential significance as a barrier for further upward movement.
NZD/USD
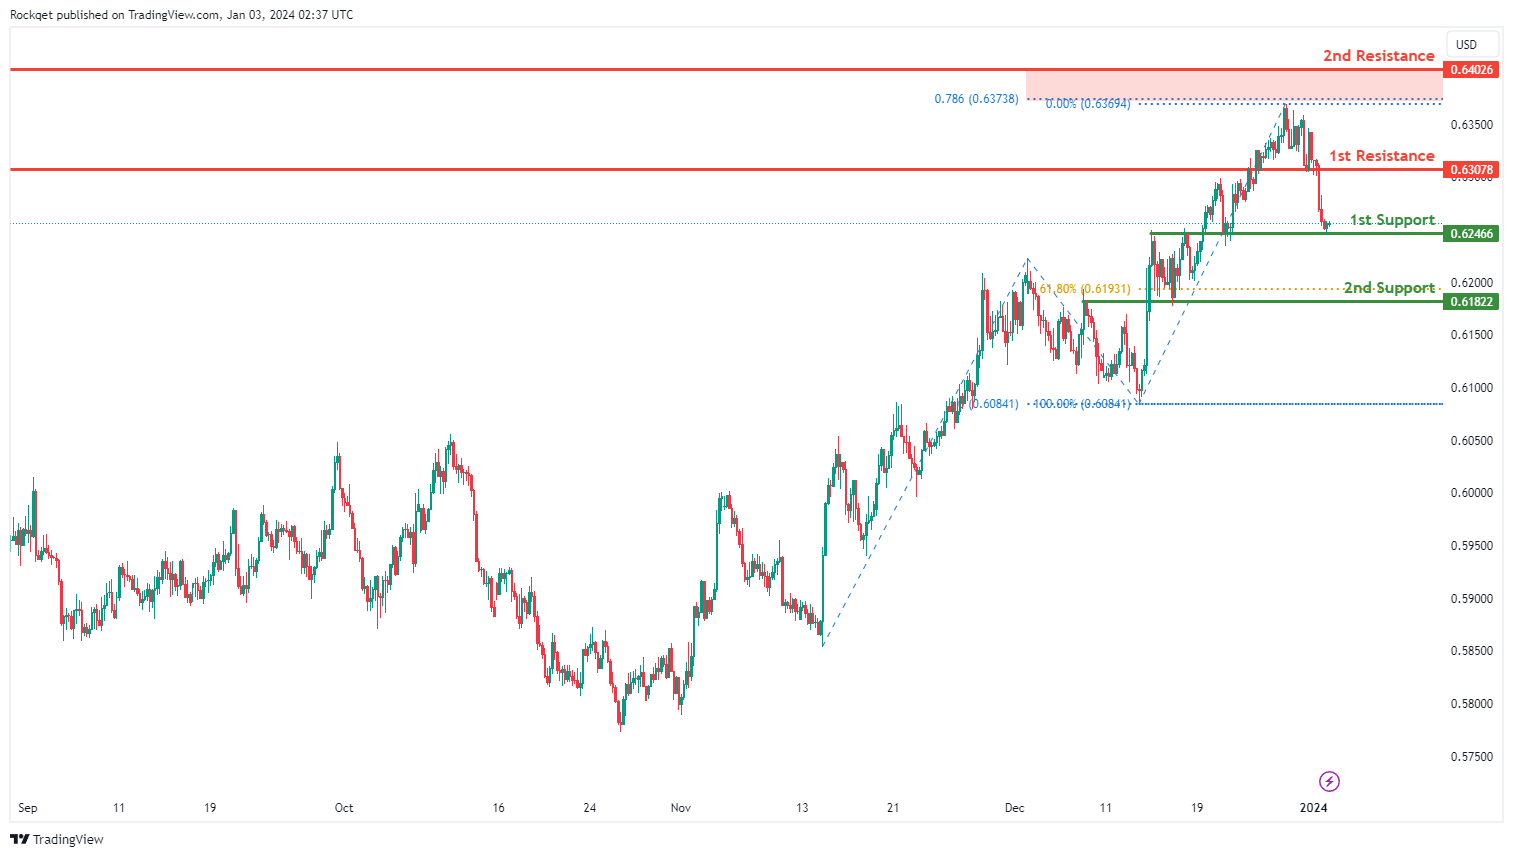
The NZD/USD chart currently exhibits an overall bearish momentum, indicating a new downtrend. However, there is a potential scenario for price to make a weak bullish bounce off the 1st support before resuming the downward trend.
The 1st support level at 0.6246 is identified as an overlap support. Further below, the 2nd support level at 0.6182 is also noted as an overlap support that aligns close to the 61.80% Fibonacci retracement level, further reinforcing its importance as a key support level.
To the upside, the 1st resistance level at 0.6307 is identified as an overlap resistance. Higher up, the 2nd resistance level at 0.6402 is marked as a swing-high resistance that aligns close to the 78.60% Fibonacci projection level, indicating its potential significance as a barrier for further upward movement.
DJ30:
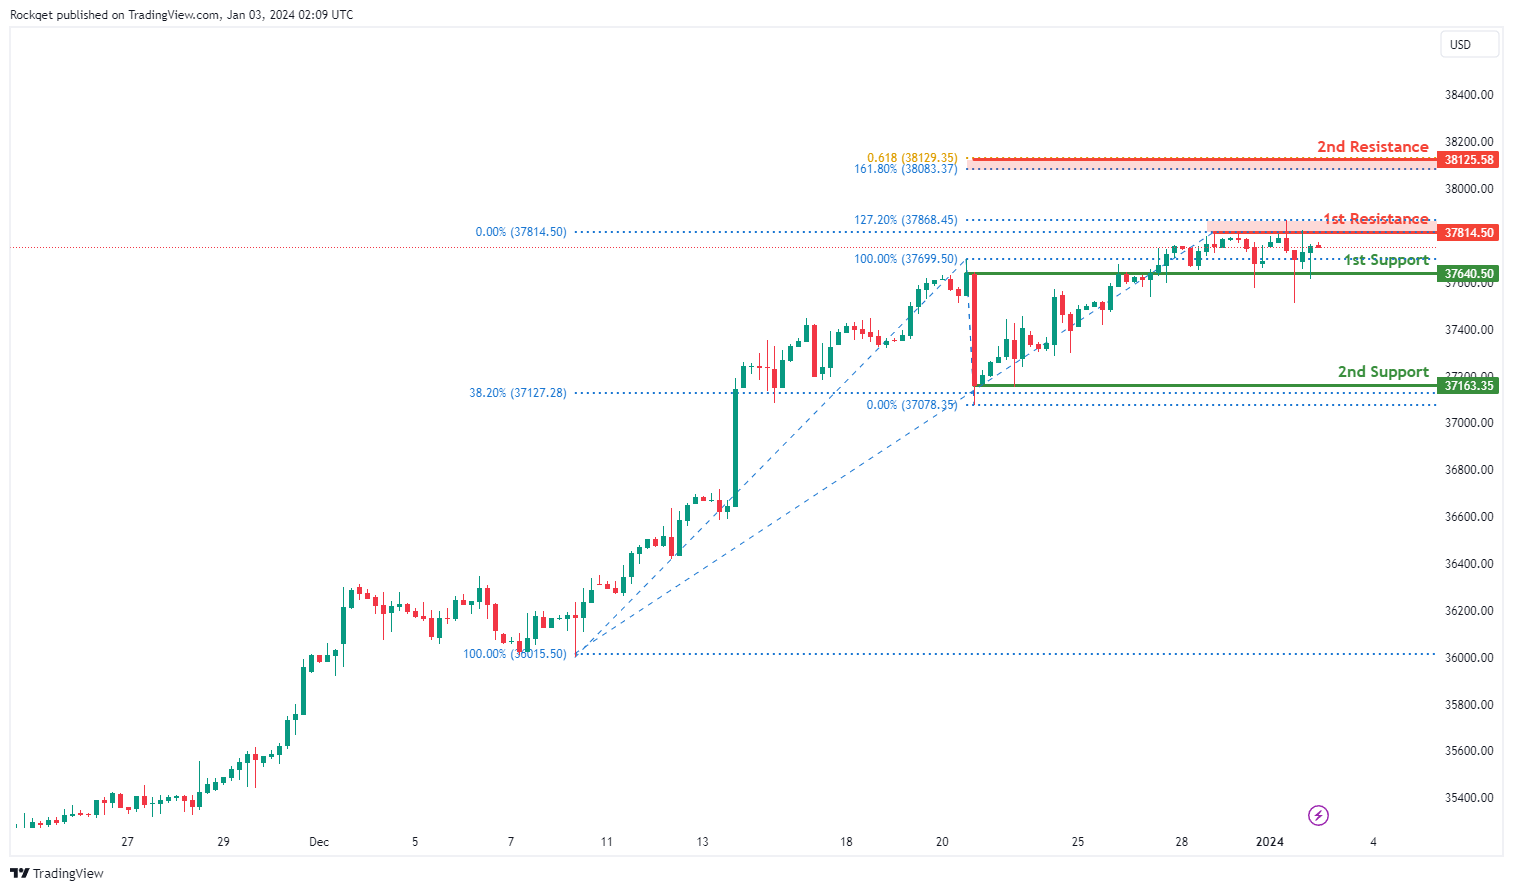
The DJ30 chart currently shows a bullish overall momentum, indicating an upward trend. There is a potential scenario for a bullish continuation towards the 1st resistance.
The 1st support at 37640.50 is considered favorable due to its identification as an overlap support, suggesting historical significance as a level where buying interest has previously emerged.
The 2nd support at 37163.35 is recognized as a swing low support and coincides with the 38.20% Fibonacci Retracement, adding confluence to its potential as a support level.
On the resistance side, the 1st resistance at 37814.50 is identified as a swing high resistance and aligns with the 127.20% Fibonacci Extension. This level may act as a barrier where selling interest could materialize.
The 2nd resistance at 38125.58 is noteworthy for multiple reasons, including the presence of the 61.80% Fibonacci Projection and the 161.80% Fibonacci Extension, adding significance to this potential resistance level.
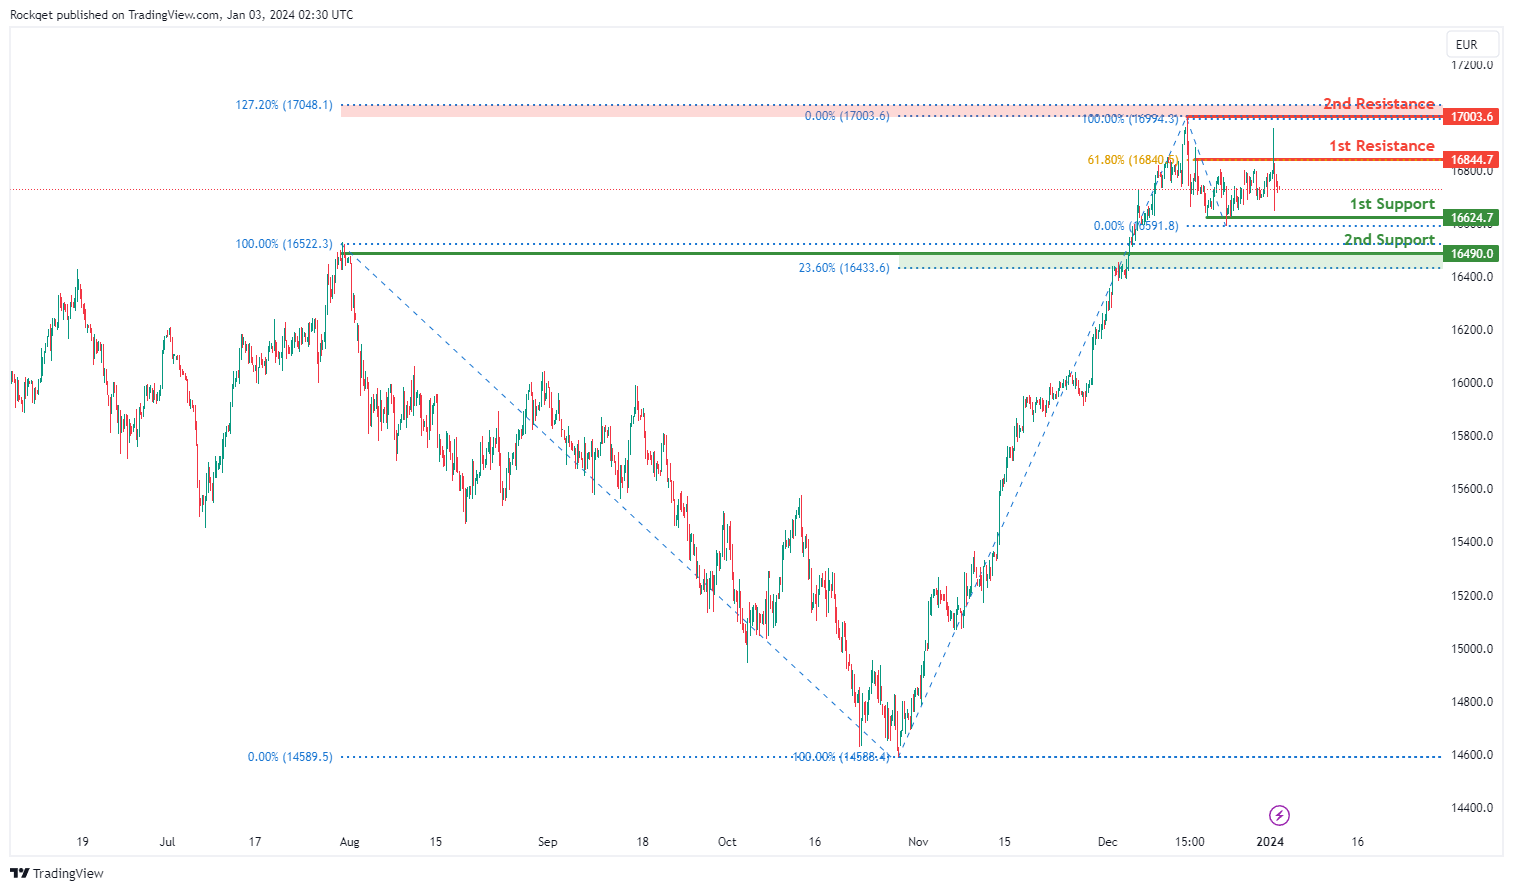
GER40:
The GER40 chart currently exhibits a bearish overall momentum, indicative of a sustained downward trend. There is a plausible scenario suggesting a bearish continuation towards the 1st support level at 16624.70.
1st support is deemed robust as it represents a multi-swing low support, denoting historical significance where buying interest has previously manifested.
Additionally, the 2nd support at 16490.00 reinforces its strength, identified as an overlap support and coinciding with the 23.60% Fibonacci Retracement, providing an additional layer of support.
On the resistance side, the 1st resistance level at 16844.70 is marked as a pullback resistance and aligns with the 61.80% Fibonacci Retracement. This level may serve as a formidable barrier where selling interest could potentially materialize.
Furthermore, the 2nd resistance at 17003.60, recognized as a swing high resistance, corresponds with the 127.20% Fibonacci Extension, adding substantial significance to its potential as a resistance level.
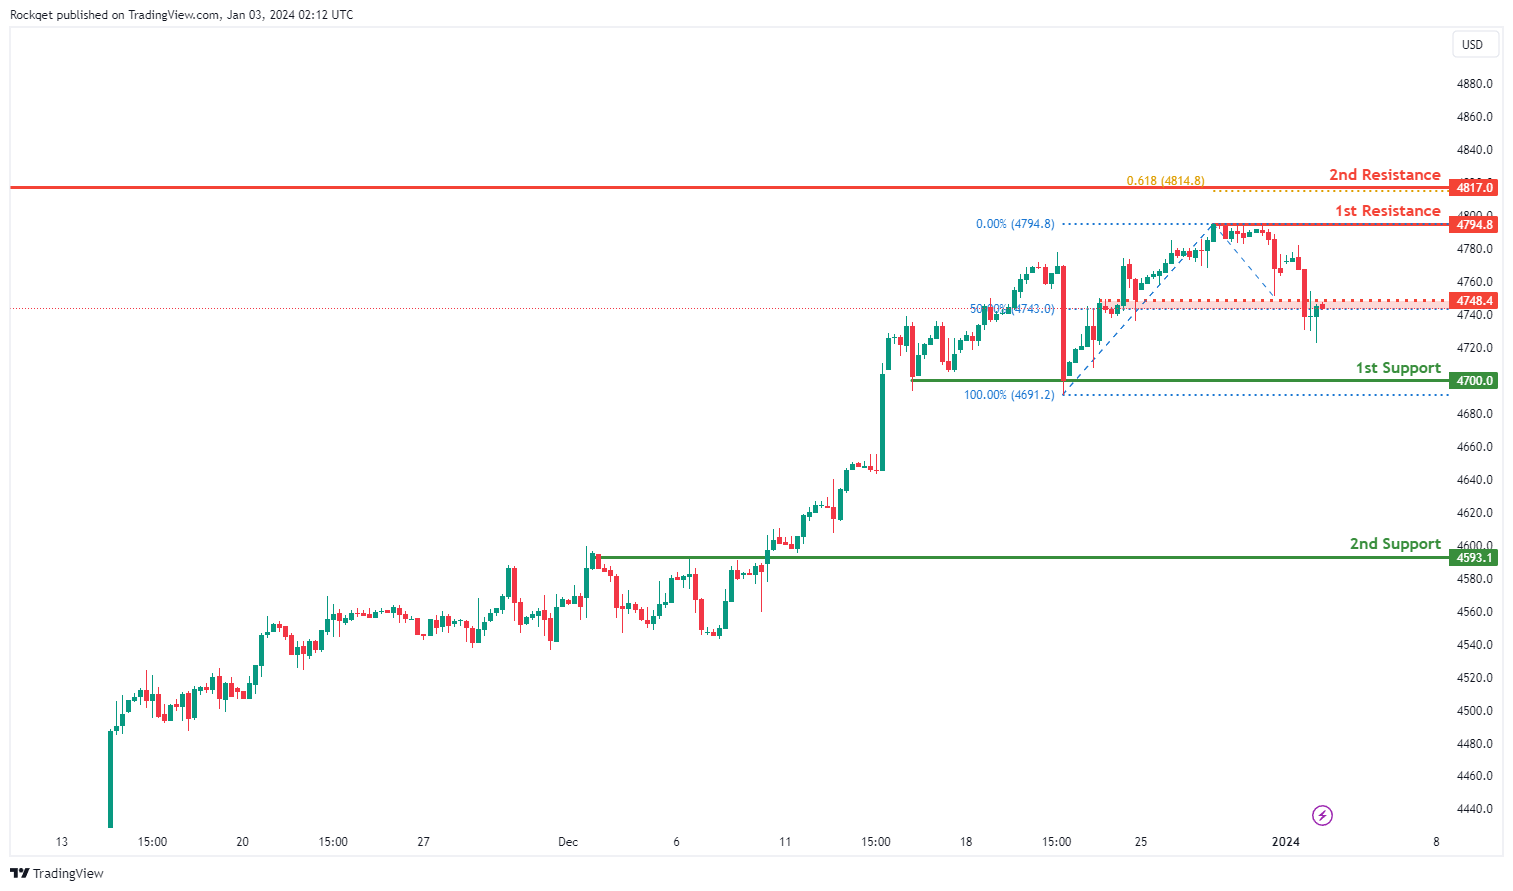
US500:
The US500 chart currently reflects a bullish overall momentum, signaling an upward trajectory. Several factors contribute to this positive momentum.
1st support at 4700.0 as a multi-swing low support, highlighting its historical significance as a level where buying interest has previously emerged.
Additionally, the 2nd support at 4593.1 is recognized as an overlap support, further reinforcing its potential strength as a support level.
In terms of resistance, the intermediate resistance at 4748.4 is marked as a pullback resistance, indicating a level where selling interest may materialize. The 1st resistance at 4794.8 aligns with a swing high resistance, suggesting a potential barrier where selling pressure could be observed.
Furthermore, the 2nd resistance at 4817.0 is notable for the presence of the 61.80% Fibonacci Projection, adding significance to its role as a potential resistance level.
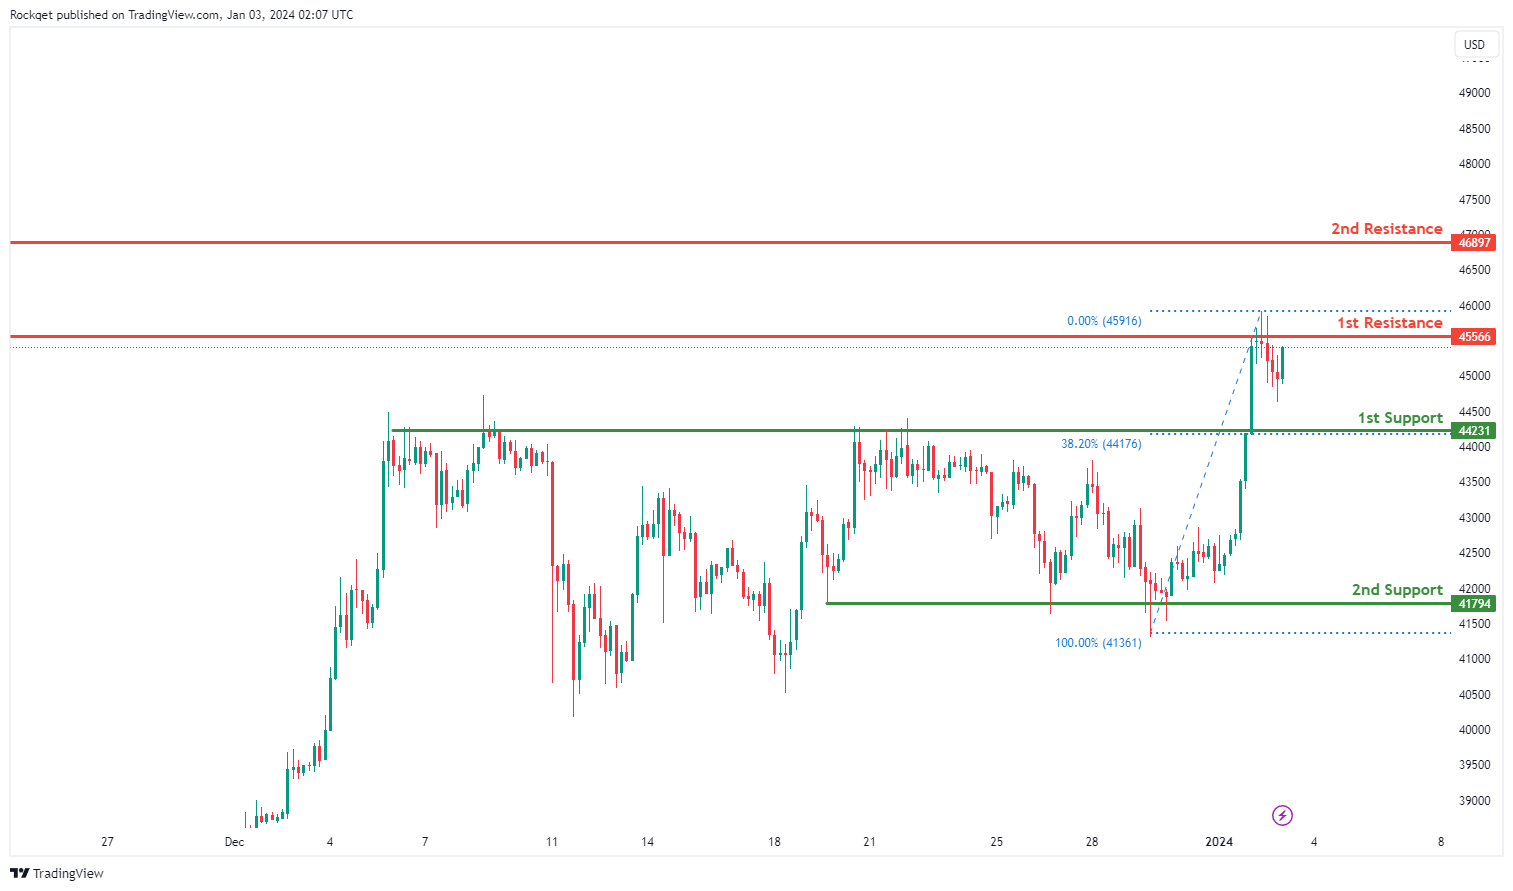
BTC/USD:
The BTC/USD chart currently exhibits a bullish overall momentum, indicating a positive upward trend. There is a potential scenario for a bullish continuation towards the 1st resistance.
The 1st support at 44231 is considered favorable due to its identification as an overlap support, suggesting historical significance as a level where buying interest has previously emerged. The 38.20% Fibonacci Retracement further adds confluence to the strength of this support level.
The 2nd support at 41794 is recognized as a multi-swing low support, reinforcing its potential as a strong support area.
On the resistance side, the 1st resistance at 45566 is identified as a pullback resistance, indicating a level where selling interest may emerge.
The 2nd resistance at 46897 is marked as a swing high resistance, representing a potential barrier where heightened selling pressure could be observed.
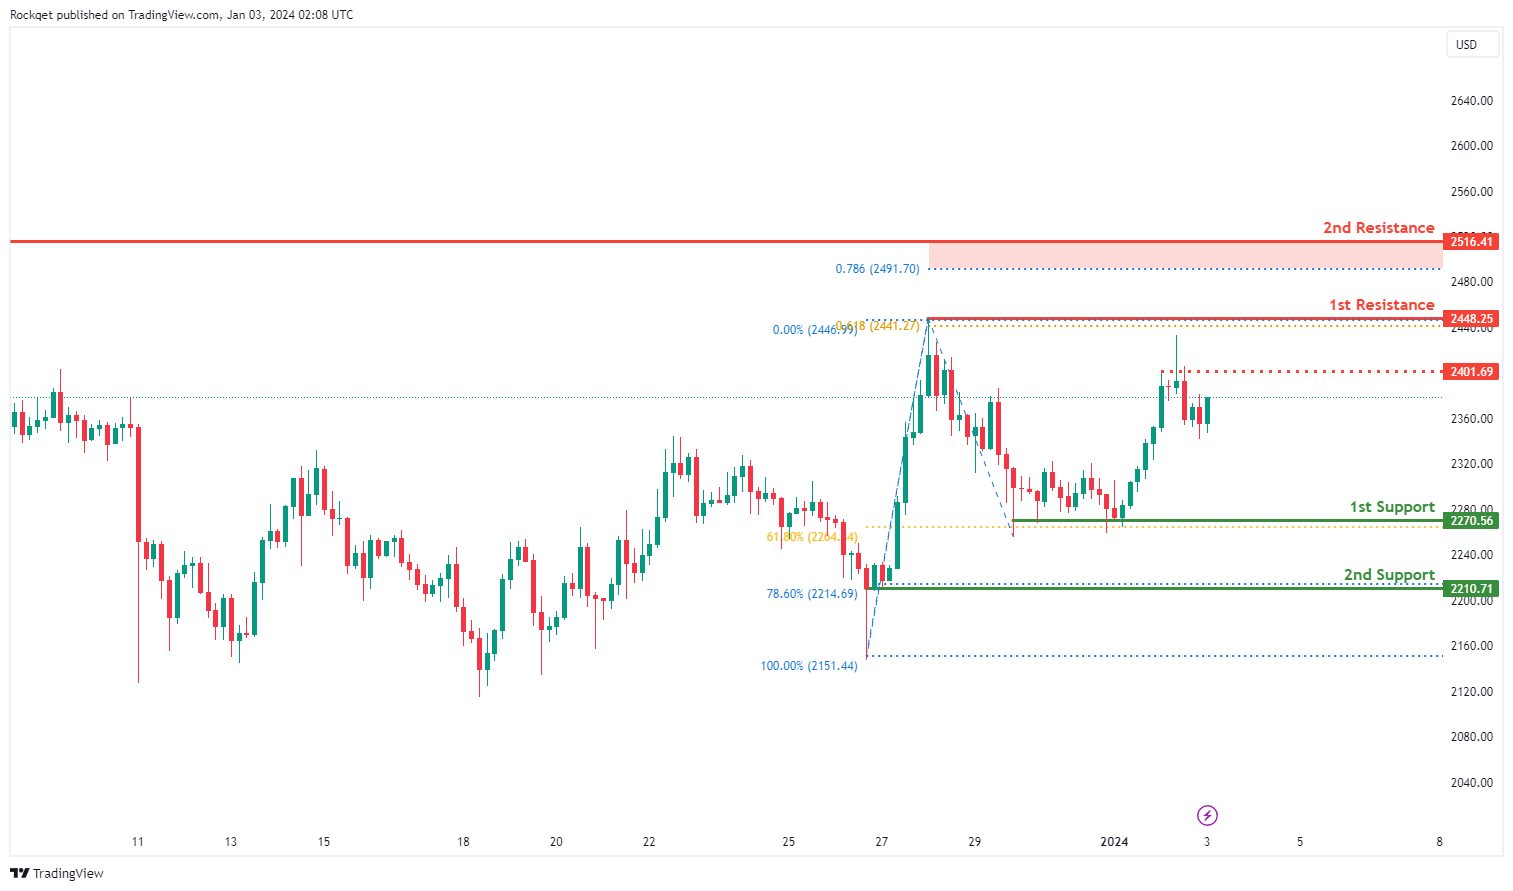
ETH/USD:
The ETH/USD chart currently shows a bullish overall momentum, indicating a positive upward trend. There is a potential scenario for a bullish continuation towards the 1st resistance.
The 1st support at 2270.56 is considered favorable due to its identification as a multi-swing low support, suggesting historical significance as a level where buying interest has previously emerged. The 61.80% Fibonacci Retracement adds confluence to the strength of this support level.
The 2nd support at 2210.71 is recognized as a pullback support, reinforcing its potential as a strong support area with the additional confluence of the 78.60% Fibonacci Retracement.
On the resistance side, the 1st resistance at 2448.25 is identified as a swing high resistance, indicating a level where selling interest may emerge. The 61.80% Fibonacci Projection adds significance to this resistance level.
The 2nd resistance at 2516.41 is marked as a swing high resistance with the added confluence of the 78.60% Fibonacci Projection.
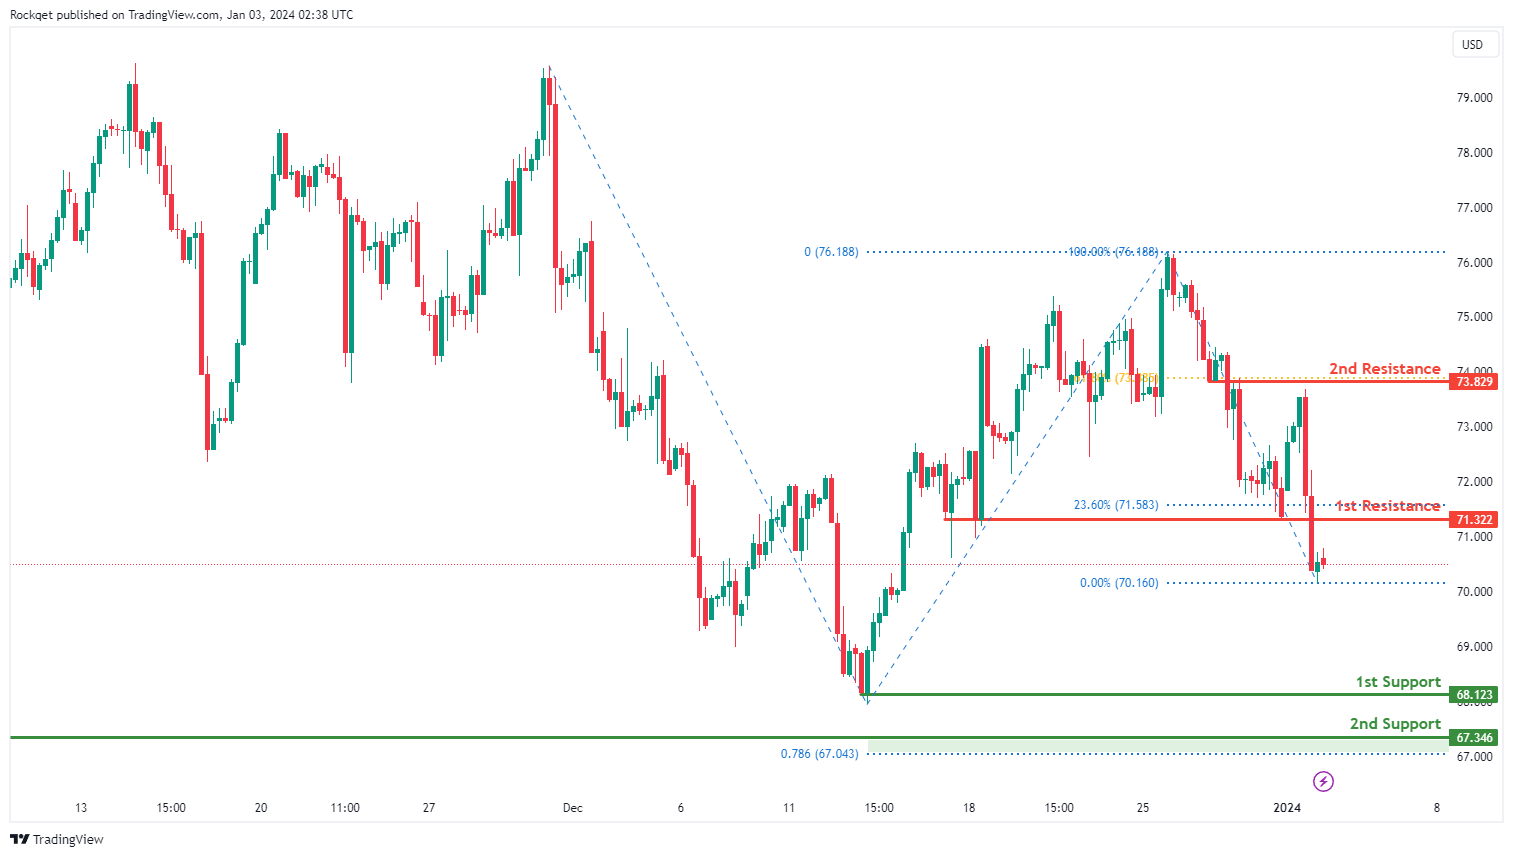
WTI/USD:
The WTI chart currently exhibits an overall bearish momentum. In this context, there is a potential scenario for price to fall towards the 1st support.
The 1st support level at 68.12 is identified as a swing-low support. Further below, the 2nd support level at 67.34 is marked as a multi-swing-low support that aligns close to the 78.60% Fibonacci projection level, reinforcing its importance as a key support level.
To the upside, the 1st resistance level at 71.32 is identified as a pullback resistance that aligns close to the 23.60% Fibonacci retracement level. Higher up, the 2nd resistance level at 73.82 is noted as an overlap resistance that aligns with the 61.80% Fibonacci retracement level, further indicating its potential significance as a barrier for further upward movement.
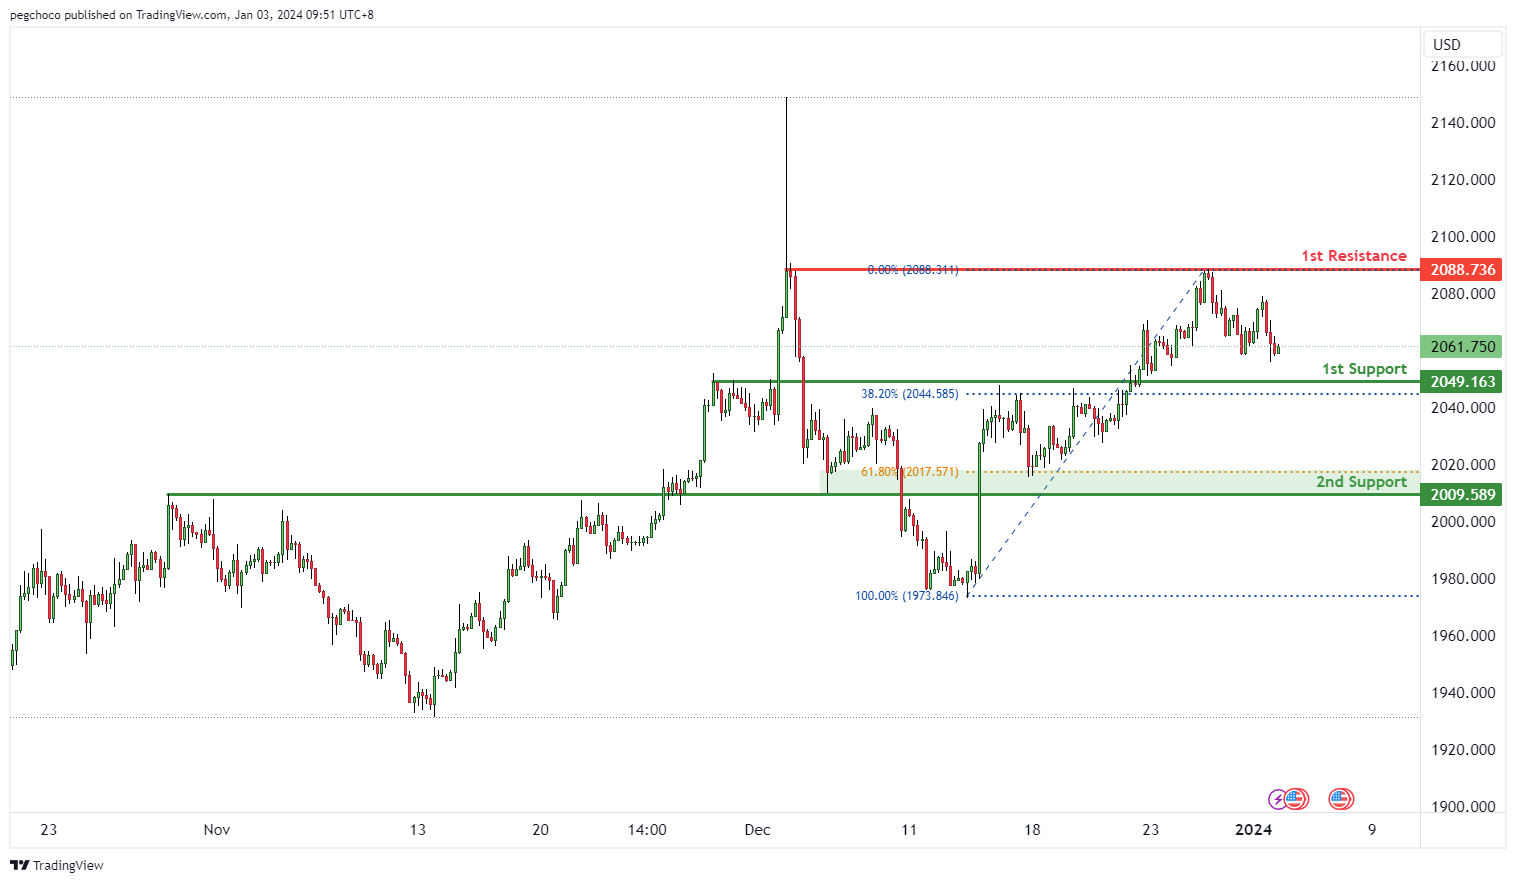
XAU/USD (GOLD):
The XAU/USD chart currently has a bearish overall momentum, indicating that gold (XAU) is weaker compared to the US Dollar (USD). In the short term, there’s potential for a bearish continuation towards the 1st support level.
The 1st support at 2049.16 is categorized as a pullback support and is reinforced by the presence of the 38.20% Fibonacci Retracement level. This level may act as a significant area where buying interest could emerge, providing temporary support for XAU/USD.
The 2nd support at 2009.58 is identified as an overlap support, further emphasizing its significance as a potential support zone. The 61.80% Fibonacci Retracement adds to the confluence of support at this level.
On the resistance side, the 1st resistance at 2088.73 is categorized as a multi-swing high resistance. This level may act as a substantial barrier where selling interest could intensify, potentially impeding any bullish advances in the short term.


