
DXY:
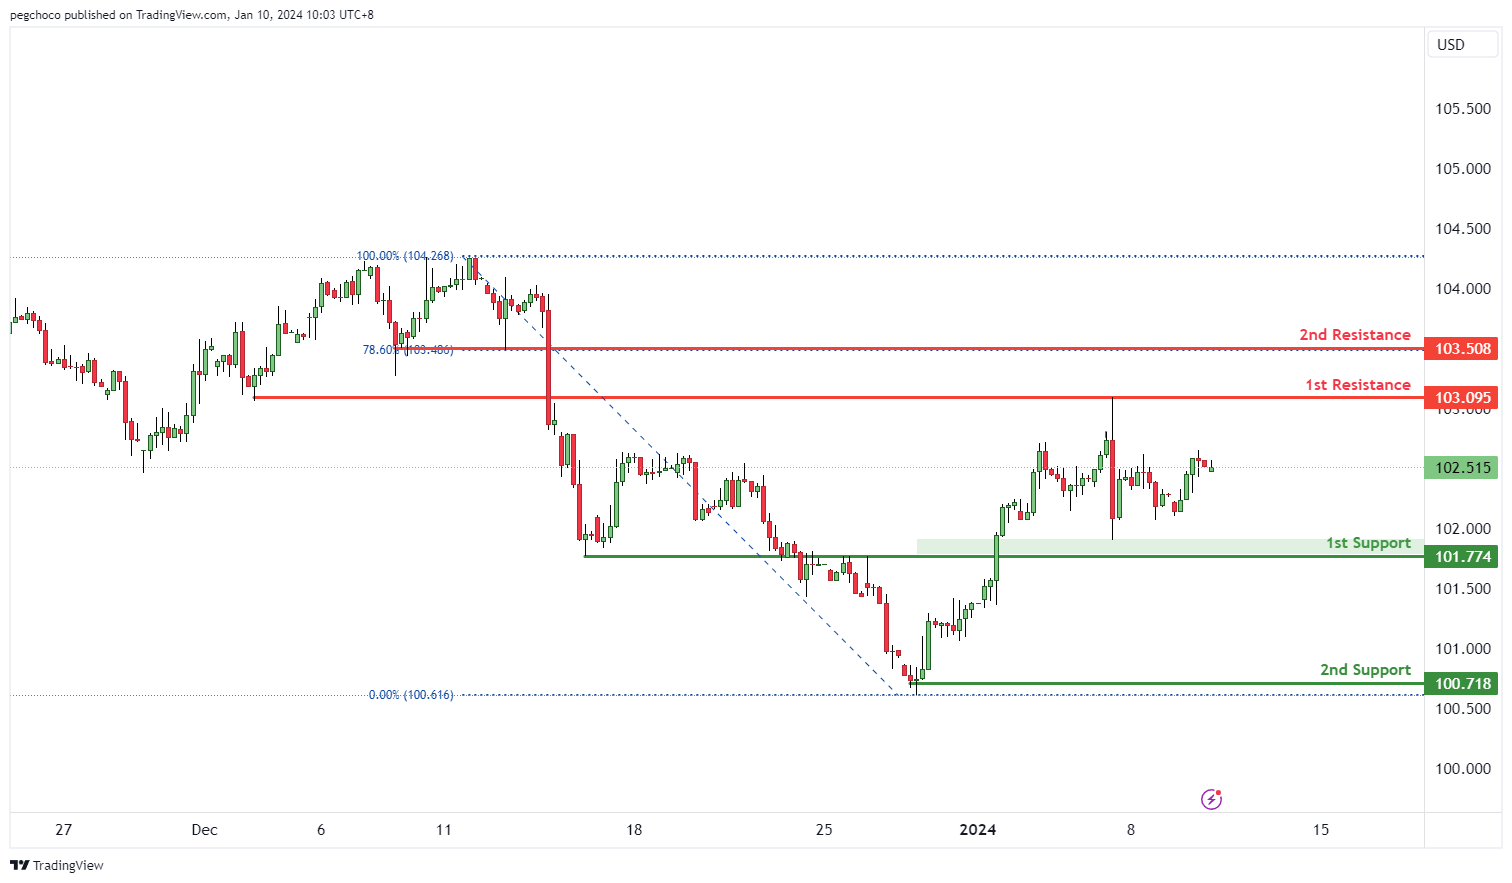
The DXY (US Dollar Index) chart currently shows a neutral overall momentum, suggesting a lack of strong directional bias in the US Dollar. As a result, there is potential for price to fluctuate between the 1st support and 1st resistance levels.
The 1st support at 101.77 is considered significant as it aligns with an overlap support level. This level may act as a potential area where buying interest could emerge, providing temporary support to the DXY.
The 2nd support at 100.71 is identified as a swing low support, further reinforcing its significance as a potential support zone.
On the resistance side, the 1st resistance at 103.09 is categorized as an overlap resistance. This level may act as a substantial barrier where selling interest could intensify.
The 2nd resistance at 103.50 is noted as a pullback resistance and is also associated with the 78.60% Fibonacci Retracement level. This level could potentially serve as a strong resistance point.
EUR/USD:
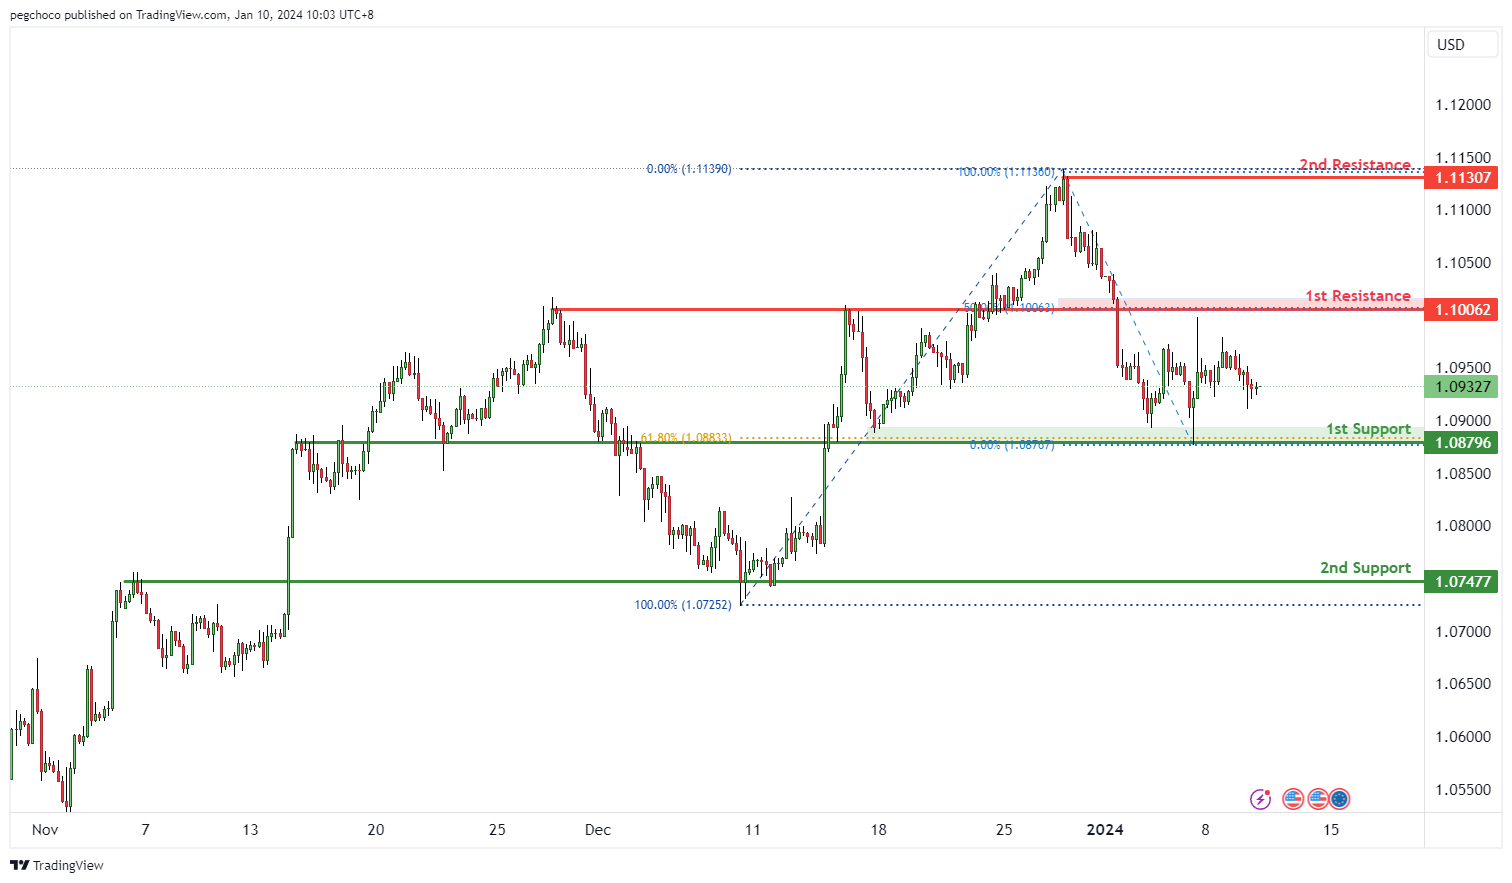
The EUR/USD chart currently exhibits a bullish overall momentum, indicating strength in the Euro relative to the US Dollar. However, the chart suggests a potential scenario where price could fluctuate between the 1st resistance and 1st support levels.
The 1st support at 1.0879 is significant for several reasons. It is identified as an overlap support and also coincides with the 61.80% Fibonacci Retracement level. This confluence of technical factors makes it a strong potential support zone, suggesting that buyers may step in at this level, providing temporary support for the EUR/USD pair.
The 2nd support at 1.0747 is also categorized as an overlap support, reinforcing its significance as a potential support area.
On the resistance side, the 1st resistance at 1.1006 is identified as an overlap resistance and is associated with the 50% Fibonacci Retracement level. This level may act as a substantial barrier where selling interest could intensify.
The 2nd resistance at 1.1130 is noted as a swing high resistance. Swing highs often mark points of reversal or resistance in price movement.
EUR/JPY:
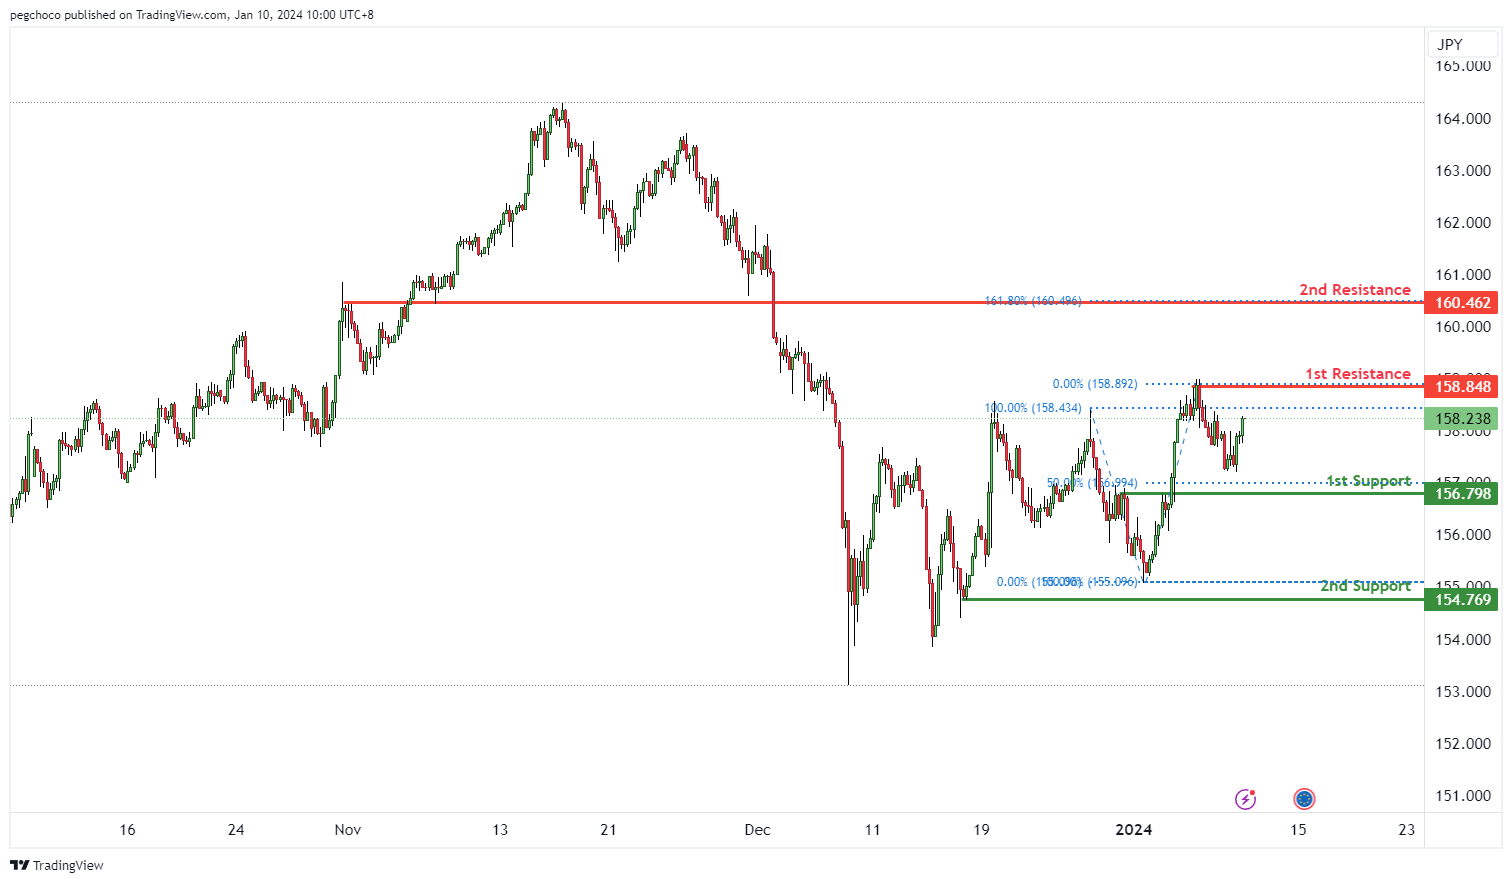
The EUR/JPY chart currently exhibits an overall bullish momentum. In this context, there is a potential scenario for price to make a bullish continuation towards the 1st resistance.
The 1st resistance level at 158.84 is categorized as a pullback resistance, indicating a level where selling interest could intensify. The 2nd resistance level at 160.46 is marked as an overlap resistance that is associated with the 161.80% Fibonacci extension level, further reinforcing its significance as a potential barrier for the price.
On the support side, the 1st support level at 156.79 is considered as a pullback support that aligns with the 50.00% Fibonacci retracement level. The 2nd support level at 154.76 is identified as a swing-low support, adding to its significance as a potential support area.
EUR/GBP:
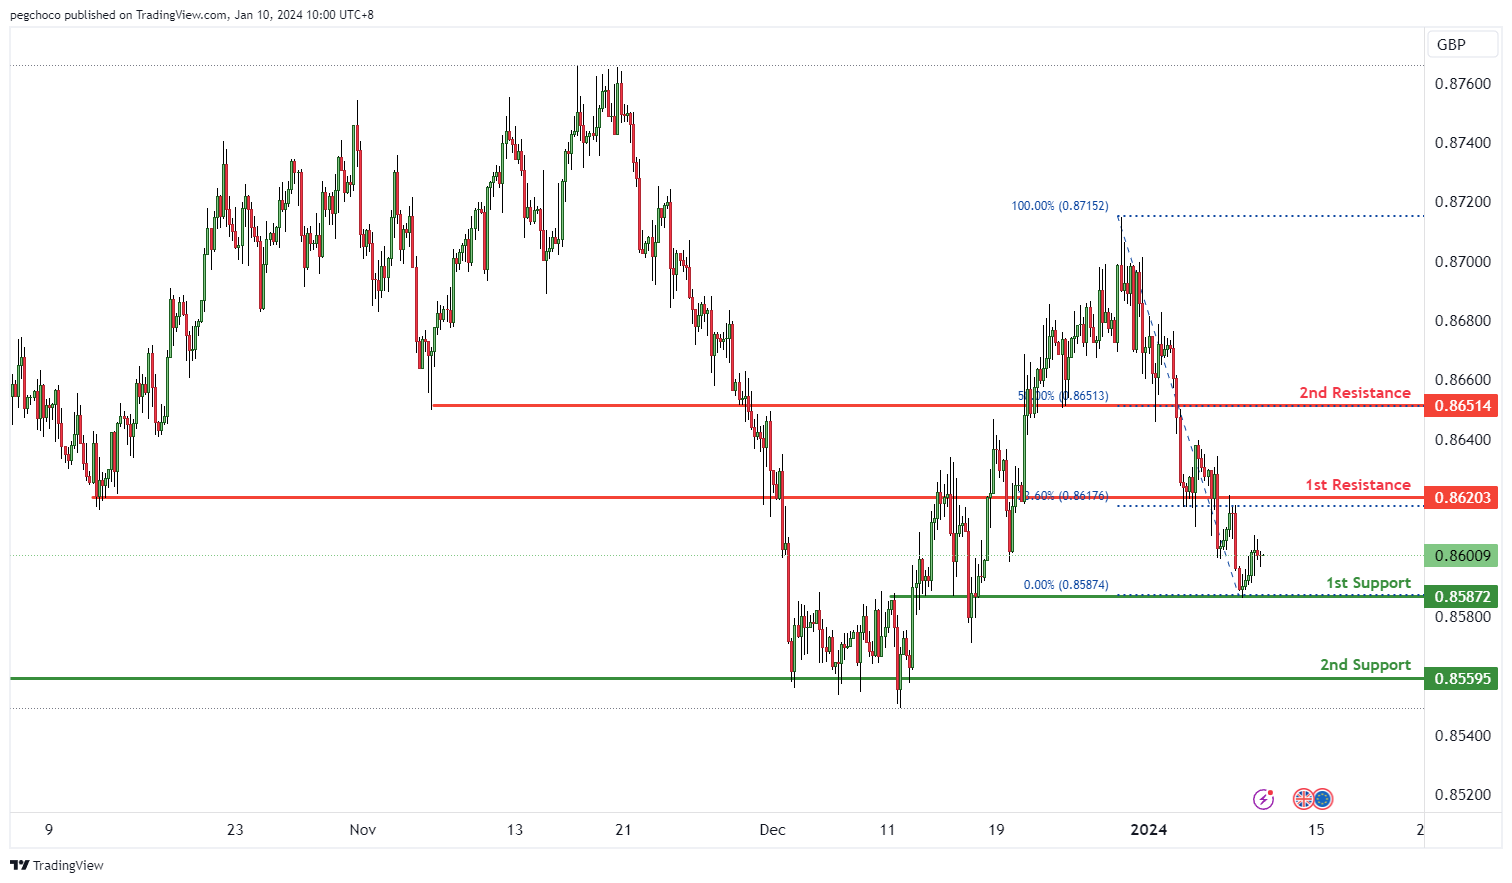
The EUR/GBP chart currently exhibits an overall bearish momentum. In this context, there is a potential scenario for price to make a bearish continuation towards the 1st support.
The 1st support level at 0.8587 is considered significant due to its characteristics as an overlap support. The 2nd support level at 0.8559 is identified as a multi-swing low support, further reinforcing its significance as a potential support zone.
On the resistance side, the 1st resistance level at 0.8620 is categorized as an overlap resistance that aligns with the 23.60% Fibonacci retracement level, making it a notable potential barrier where selling interest could intensify. The 2nd resistance level at 0.8651 is marked as a pullback resistance that is associated with the 50.00% Fibonacci retracement level, further reinforcing its significance as a potential resistance level.
GBP/USD:
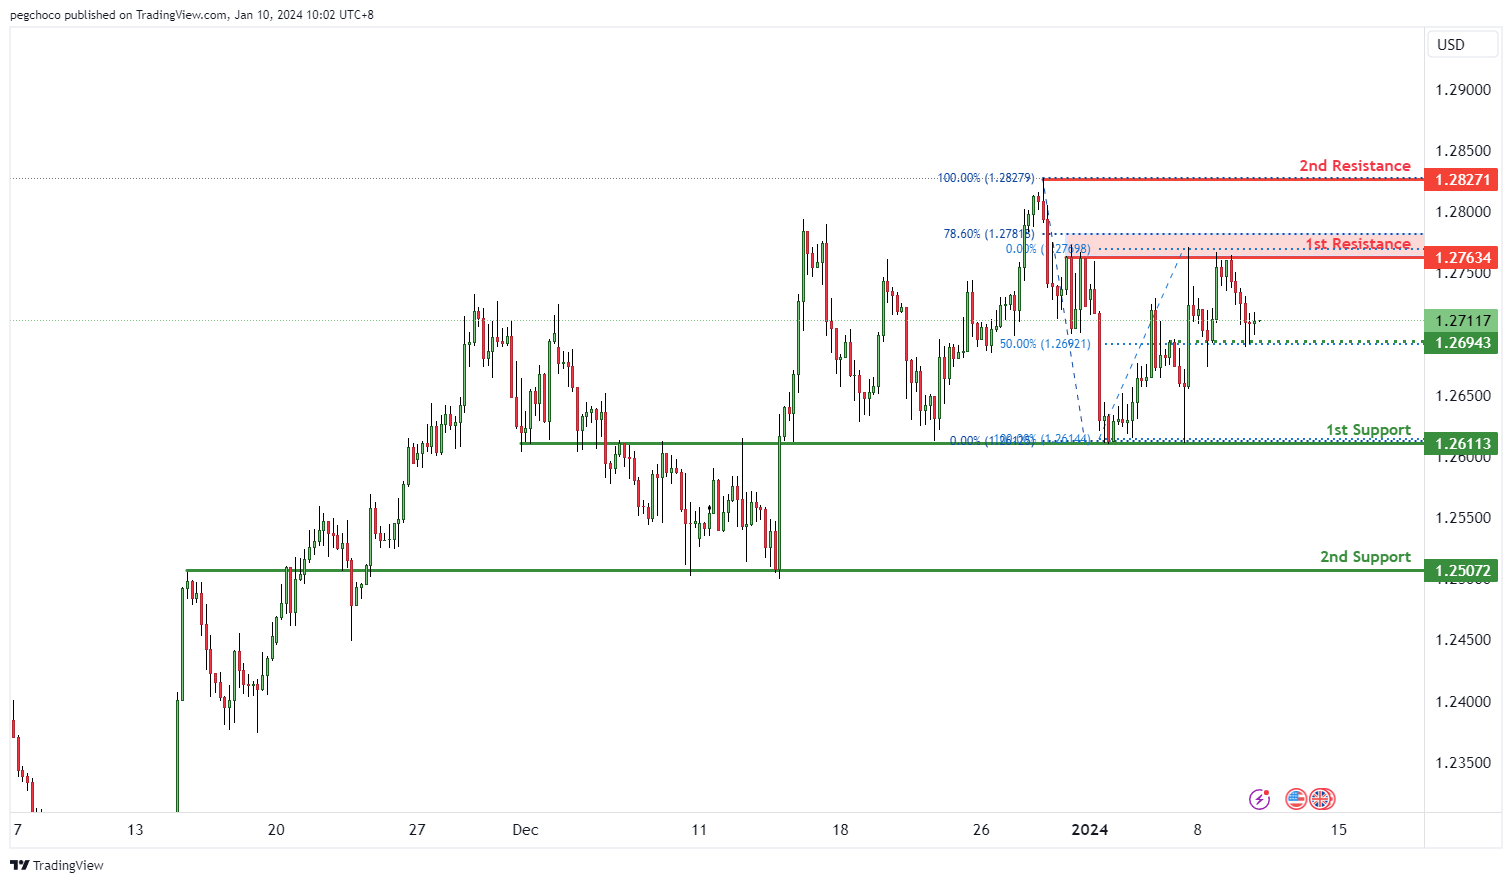
The GBP/USD chart currently demonstrates a bearish overall momentum, suggesting weakness in the British Pound compared to the US Dollar. This momentum indicates a potential scenario where price could continue its bearish movement towards the 1st support level.
The 1st support at 1.2611 is categorized as an overlap support. It is a significant level as it suggests a potential area where buying interest may emerge, providing temporary support for the GBP/USD pair.
The 2nd support at 1.2507 is also identified as an overlap support and reinforces its importance as a potential support zone. This level is further marked by the 50% Fibonacci Retracement, adding to its significance.
On the resistance side, the 1st resistance at 1.2763 is categorized as an overlap resistance, and it is associated with the 78.60% Fibonacci Retracement level. This level may act as a substantial barrier where selling interest could intensify.
The 2nd resistance at 1.2827 is noted as a swing high resistance. Swing highs often serve as points of reversal or resistance in price movement.
An intermediate support at 1.2694 is identified as an overlap support, and it coincides with the 50% Fibonacci Retracement level, further highlighting its importance.
GBP/JPY:
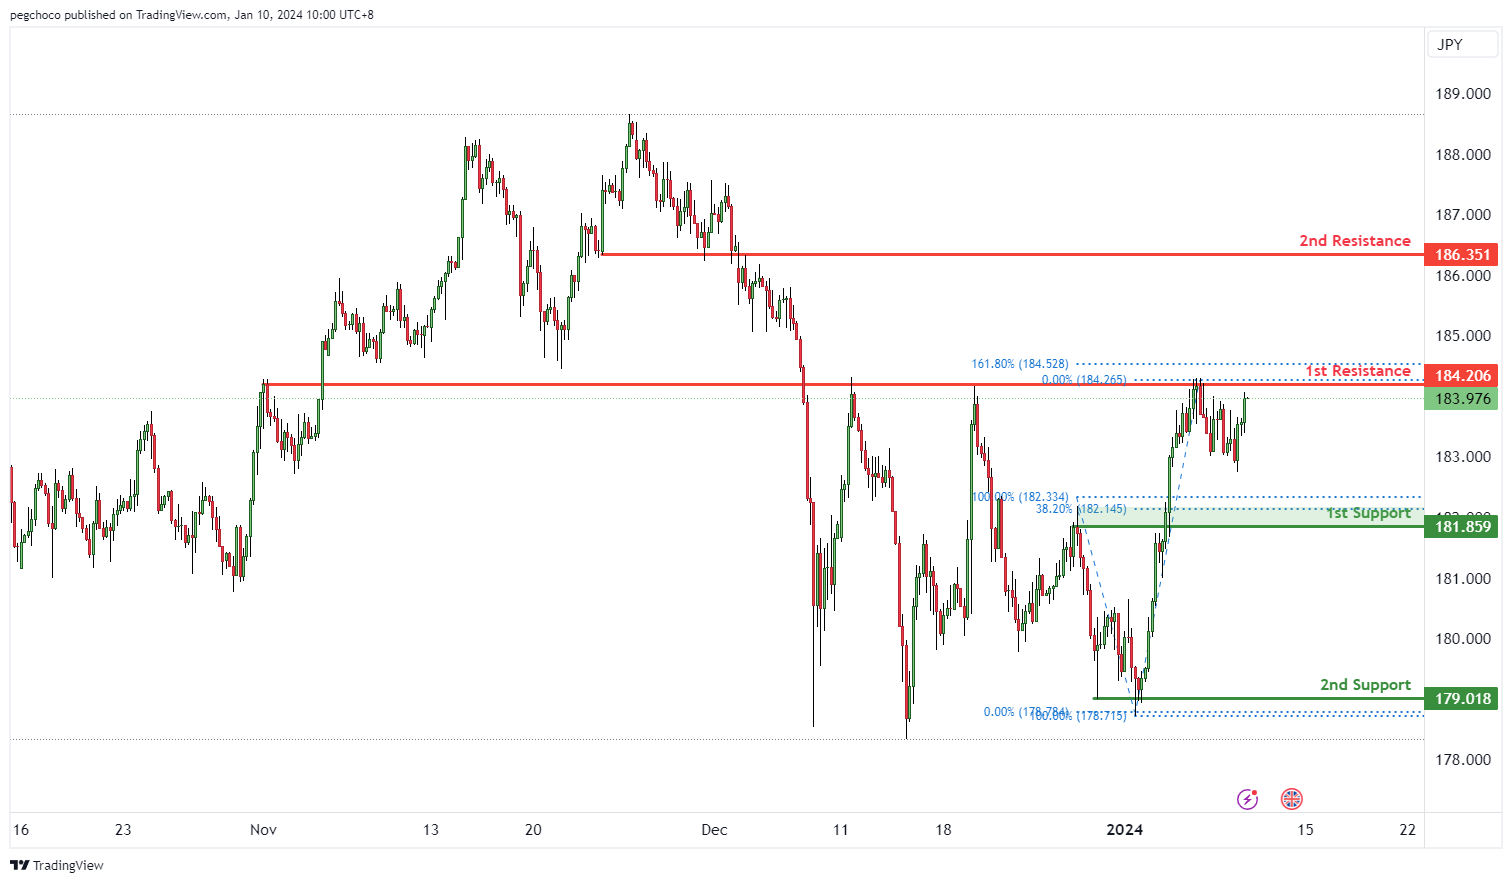
The GBP/JPY chart currently exhibits an overall bullish momentum. In this context, there is a potential scenario for price to make a bullish continuation towards the 1st resistance.
The 1st resistance level at 184.20 is marked as an overlap resistance that aligns close to the 161.80% Fibonacci extension level. The 2nd resistance level at 186.35 is also identified as an overlap resistance, further reinforcing its significance as a potential resistance level.
On the support side, the 1st support level at 181.85 is categorized as a pullback support that aligns close to the 38.20% Fibonacci Retracement level, making it a notable potential support zone. The 2nd support level at 179.01 is identified as a swing-low support, further reinforcing its significance as a potential support area.
USD/CHF:
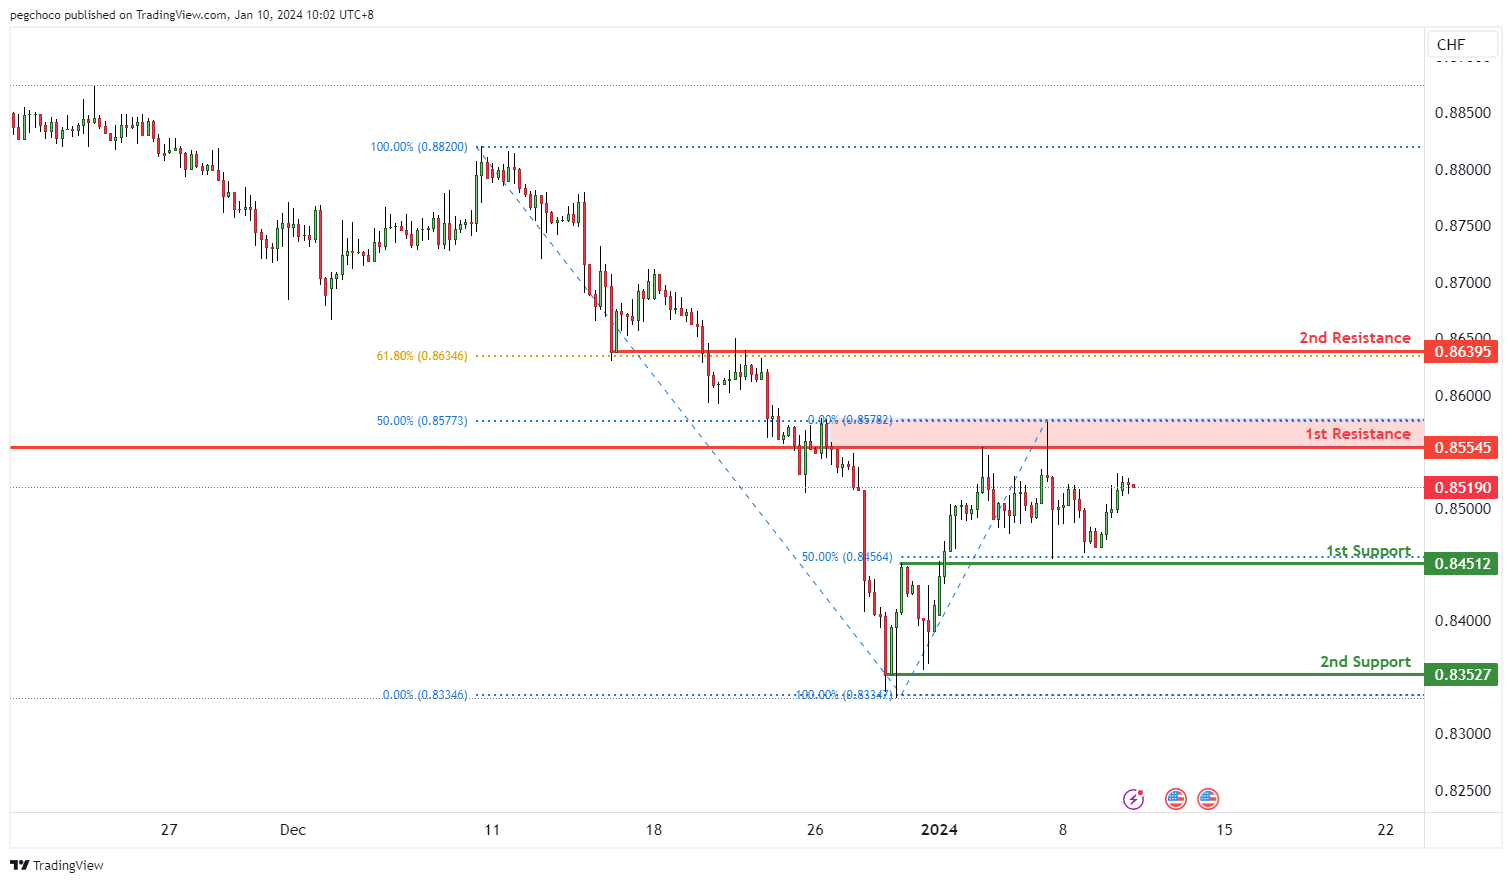
The USD/CHF chart currently exhibits a neutral overall momentum, indicating a lack of strong directional bias. In this scenario, price could potentially move within a range, fluctuating between the 1st resistance and 1st support levels.
The 1st support at 0.8451 is identified as an overlap support, and it aligns with the 50% Fibonacci Retracement level. This level is significant as it suggests a potential area where buying interest may emerge, providing temporary support for USD/CHF.
The 2nd support at 0.8352 is categorized as multi-swing low support, further reinforcing its significance as a potential support zone.
On the resistance side, the 1st resistance at 0.8554 is marked as an overlap resistance, coinciding with the 50% Fibonacci Retracement level. This level may act as a substantial barrier where selling interest could intensify.
The 2nd resistance at 0.8639 is also categorized as an overlap resistance and aligns with the 61.80% Fibonacci Retracement level, adding to its significance.
USD/JPY:
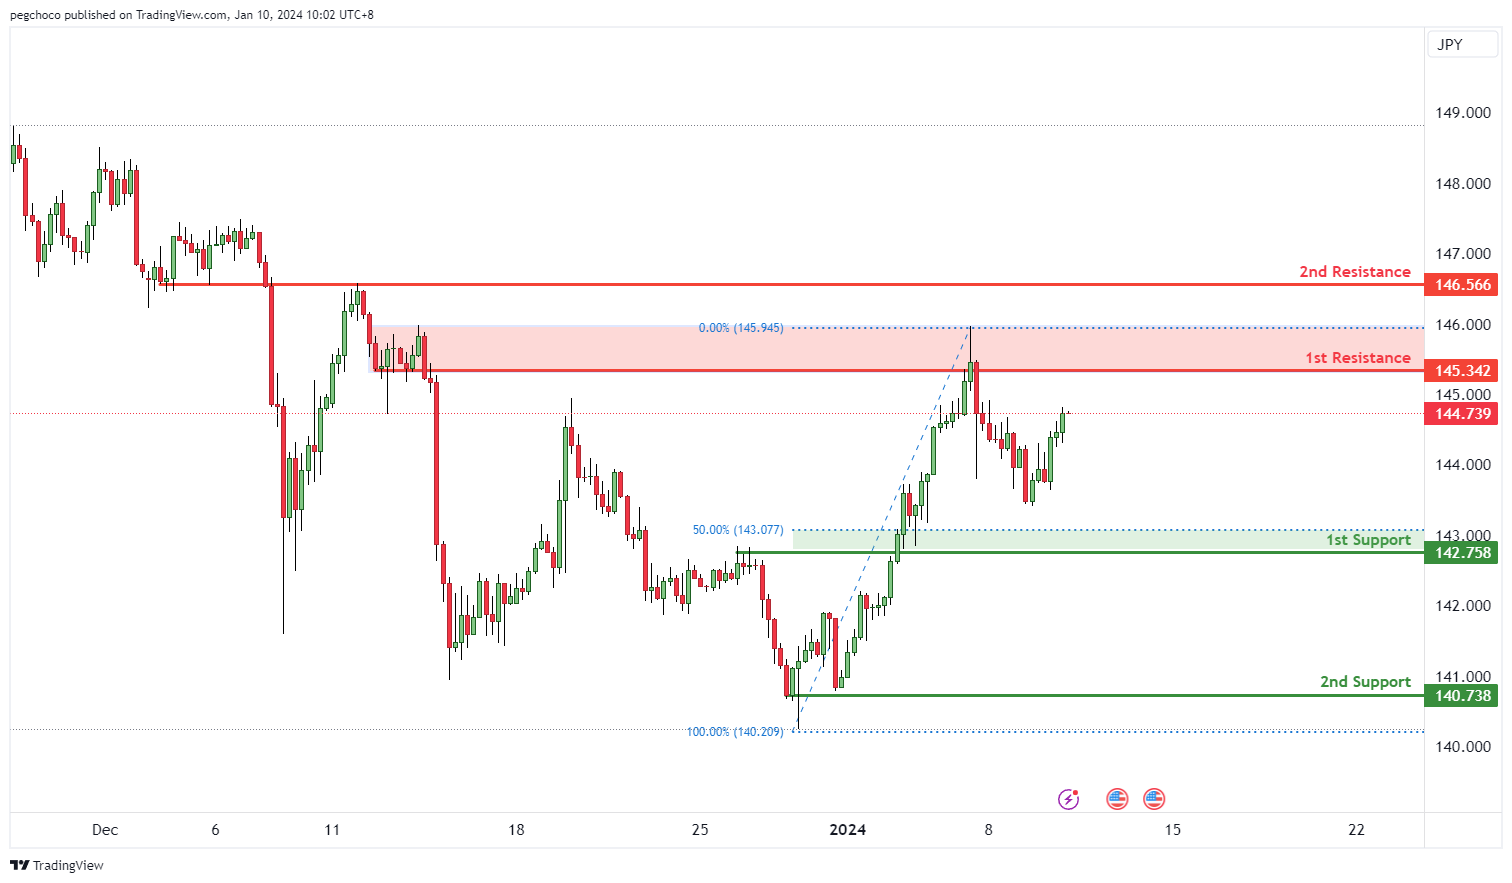
The USD/JPY chart currently exhibits a bullish overall momentum, suggesting strength in the US Dollar relative to the Japanese Yen. This momentum is supported by the potential for a bullish continuation towards the 1st resistance level.
The 1st support at 142.75 is identified as a pullback support and aligns with the 50% Fibonacci Retracement level. This level is significant as it suggests a potential area where buying interest may emerge, providing temporary support for USD/JPY.
The 2nd support at 140.73 is categorized as multi-swing low support, further reinforcing its significance as a potential support zone.
On the resistance side, the 1st resistance at 145.34 is marked as a swing high resistance. Swing highs often act as points of reversal or resistance in price movement.
The 2nd resistance at 146.56 is categorized as an overlap resistance, adding to its significance as a potential barrier for the price.
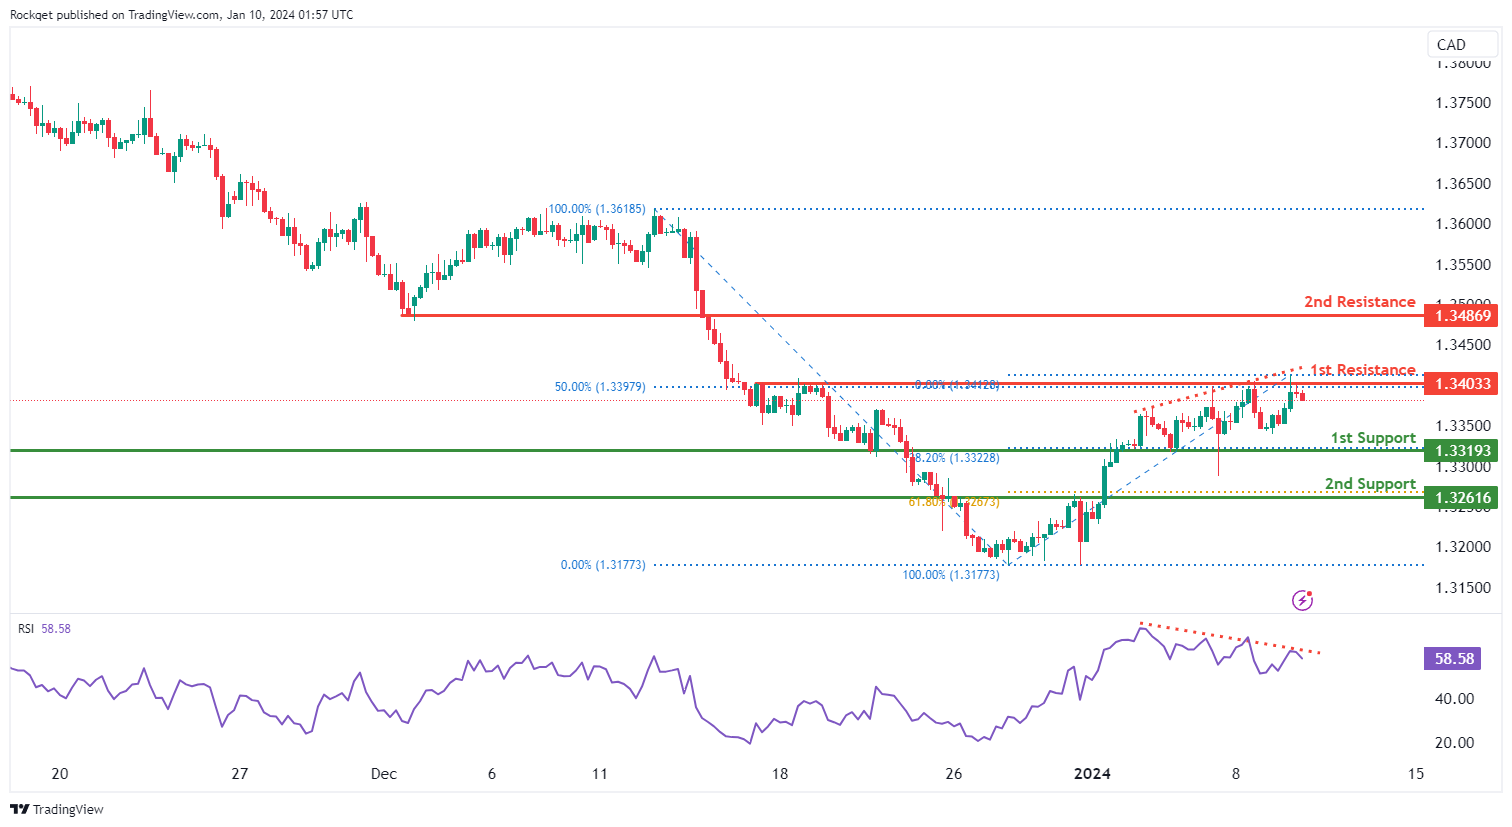
USD/CAD:
The USD/CAD chart currently exhibits an overall bullish momentum. However, the Relative Strength Indicator (RSI) is displaying a bearish divergence versus price, indicating a potential scenario for price to make a bearish reaction off the 1st resistance and drop towards the 1st support.
The 1st resistance level at 1.3403 is identified as a pullback resistance that aligns with the 50.00% Fibonacci retracement level. Higher up, the 2nd resistance level at 1.3486 is noted as a pullback resistance, further reinforcing its significance as a potential resistance zone.
To the downside, the 1st support level at 1.3319 is identified as a pullback support that aligns with the 38.20% Fibonacci retracement level. Further below, the 2nd support level at 1.3261 is marked as an overlap support that aligns with the 61.80% Fibonacci retracement level, further reinforcing its importance as a key support level.
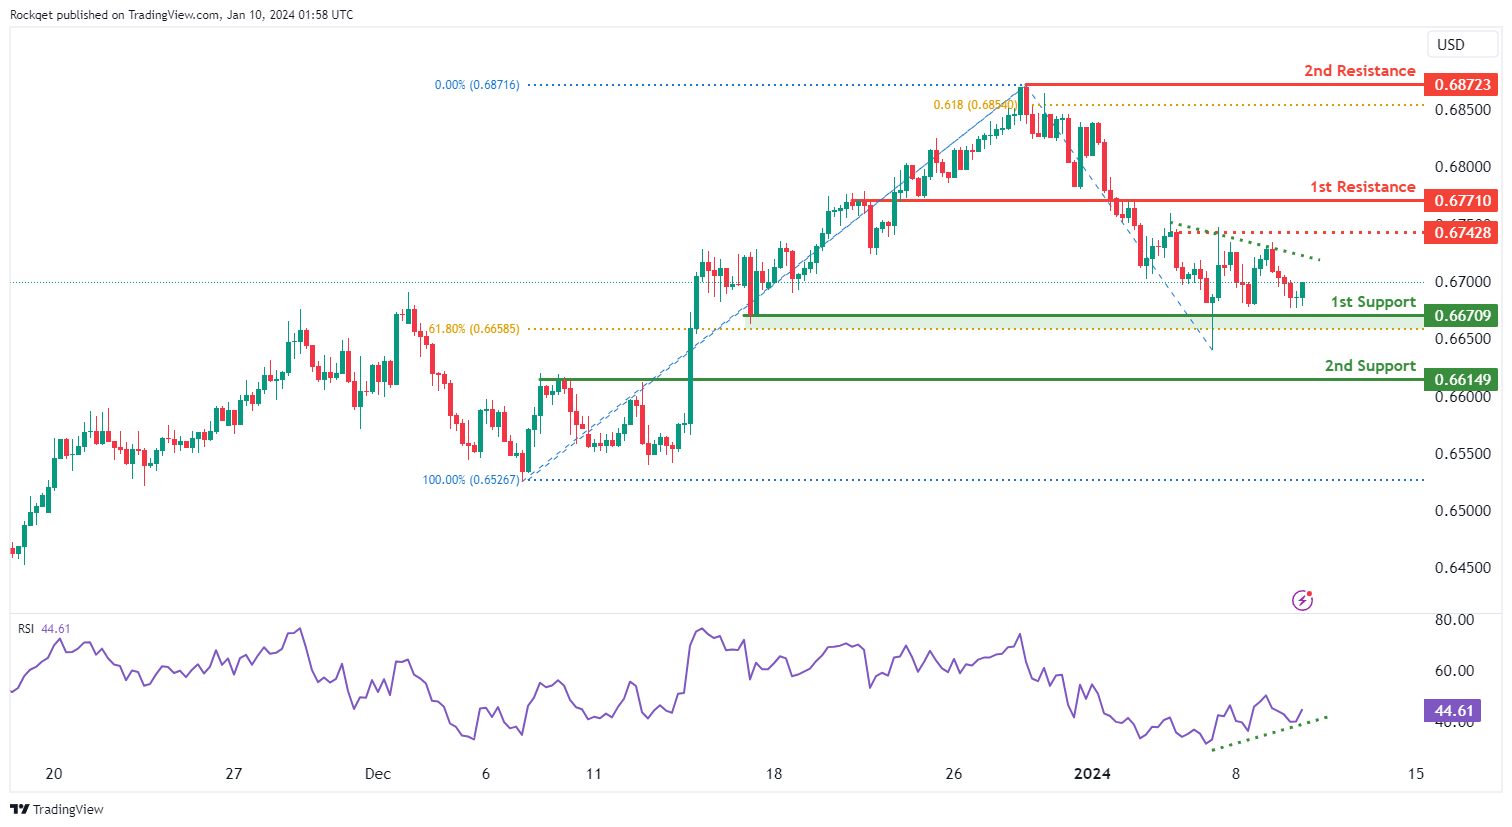
AUD/USD:
The AUD/USD chart currently exhibits an overall bearish momentum. However, the Relative Strength Indicator (RSI) is displaying a bullish divergence versus price, indicating a potential scenario for price to make a bullish rise towards the 1st resistance should it break above the intermediate resistance.
The intermediate resistance level at 0.6742 is identified as a pullback resistance while the 1st resistance level at 0.6771 is identified as an overlap resistance. Higher up, the 2nd resistance level at 0.6872 is noted as a swing-high resistance that aligns close to the 61.80% Fibonacci projection level, suggesting a potential barrier for further upside movement.
To the downside, the 1st support level at 0.6670 is identified as a pullback support that aligns close to the 61.80% Fibonacci retracement level. Further below, the 2nd support level at 0.6614 is also marked as an pullback support, further reinforcing its importance as a key support level.
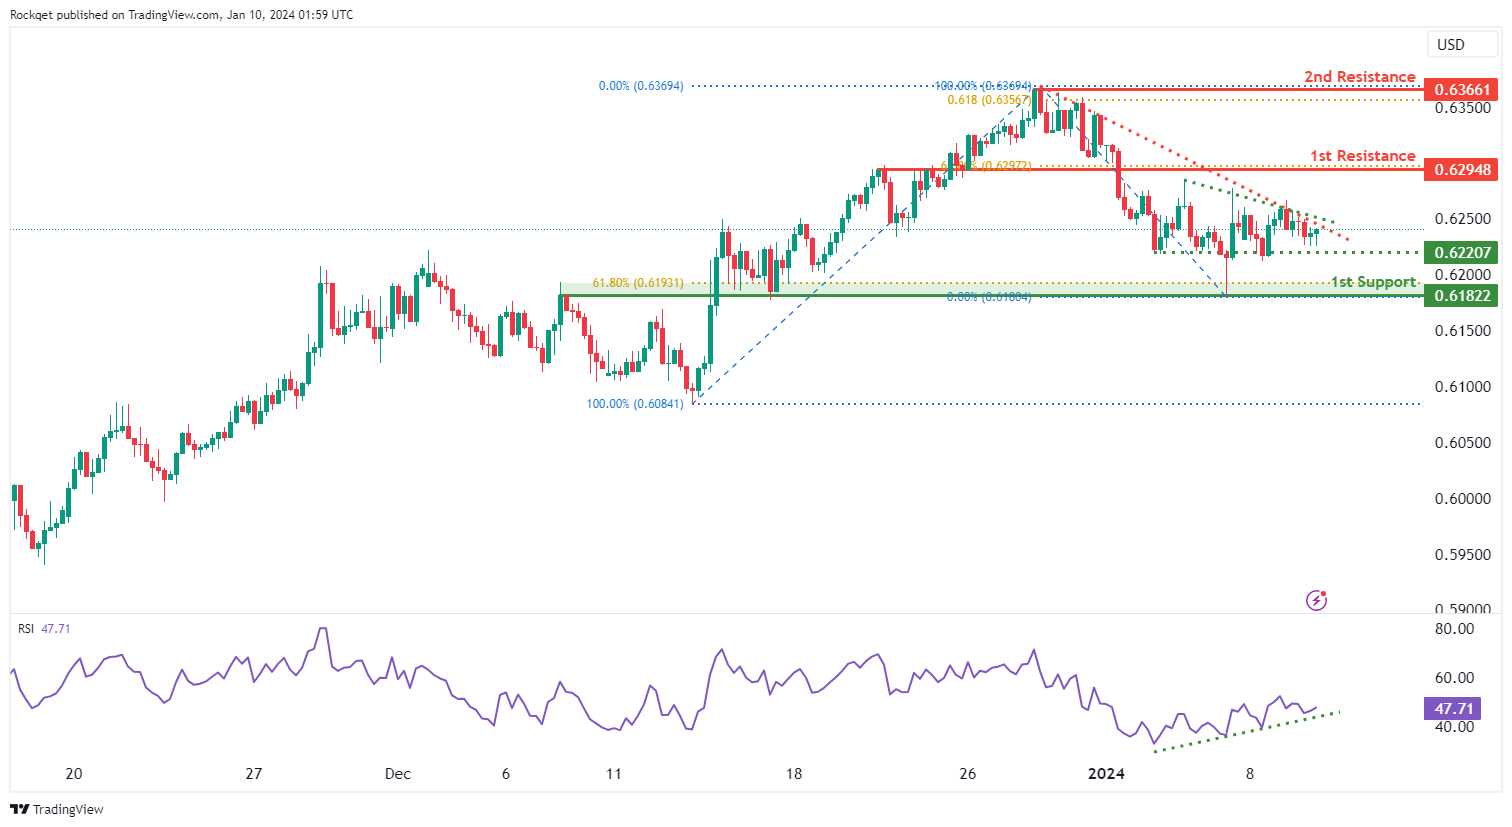
NZD/USD
The NZD/USD chart currently exhibits an overall bearish momentum. However, the Relative Strength Indicator (RSI) is displaying a bullish divergence versus price, indicating a potential scenario for price to make a bullish rise towards the 1st resistance should it break above the descending trendline.
The 1st resistance level at 0.6294 is identified as an overlap resistance that aligns with the 61.80% Fibonacci retracement level. Higher up, the 2nd resistance level at 0.6366 is noted as a swing-high resistance that aligns close to the 61.80% Fibonacci projection level, suggesting a potential barrier for further upside movement.
To the downside, the intermediate support level at 0.6220 is identified as a pullback support. Further below, the 1st support level at 0.6182 is marked as an overlap support that aligns close to the 61.80% Fibonacci retracement level, further reinforcing its importance as a key support level.
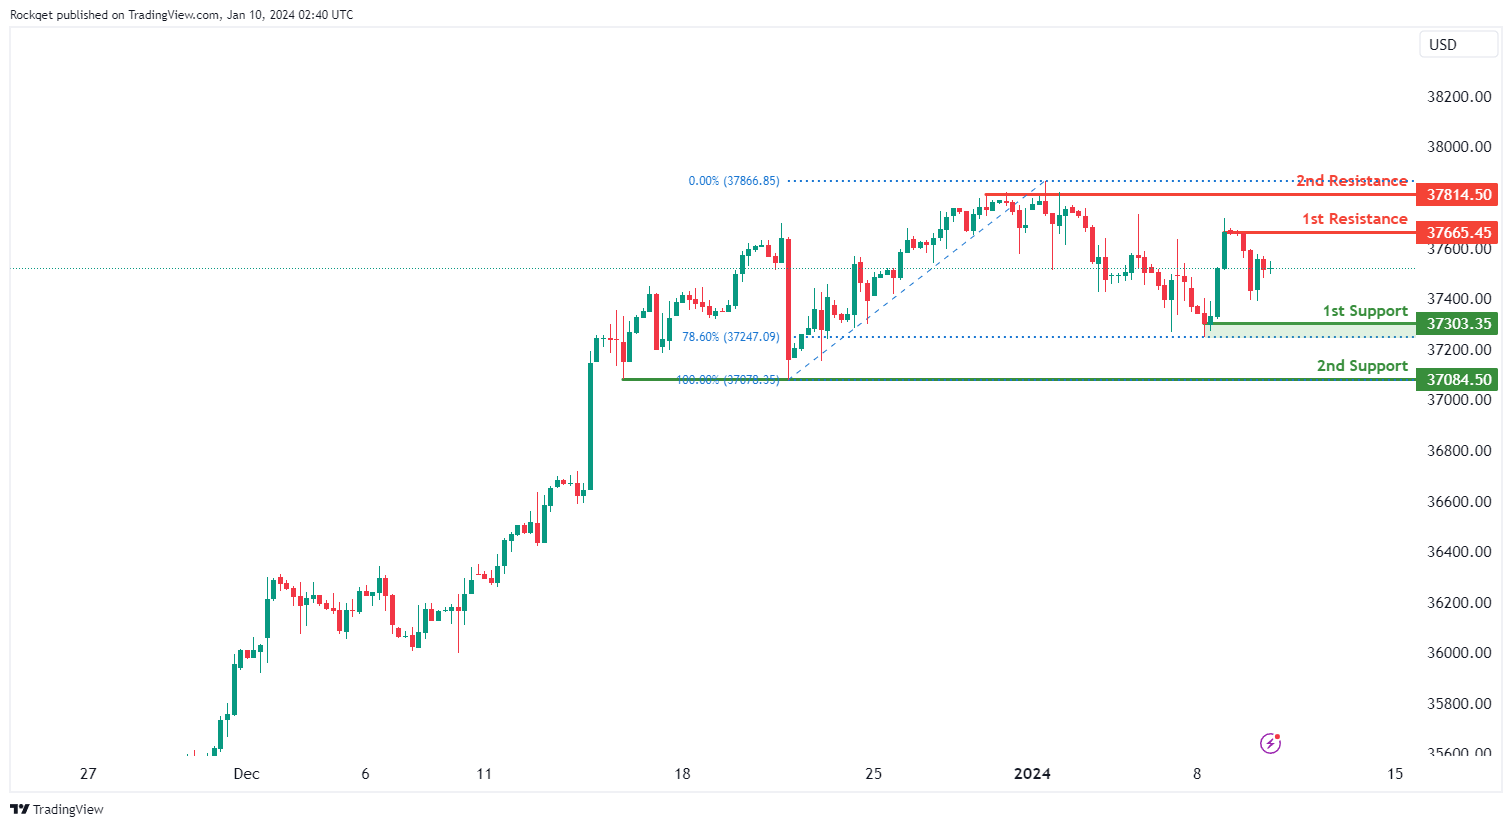
DJ30:
The DJ30 chart currently displays a neutral bias, indicating a potential for price to fluctuate between the 1st resistance and the 1st support.
The 1st support level at 37,303.35 is considered favourable as it is identified as a pullback support that aligns close to the 78.60% Fibonacci retracement level. The 2nd support level at 37,084.50 is also recognized as a pullback support, further adding to its potential as a support level during a price retracement.
On the resistance side, the 1st resistance level at 37,665.45 is identified as a pullback resistance, which may act as a barrier where selling interest could materialize. The 2nd resistance level at 37,814.50 is recognized as a pullback resistance, adding significance to this potential resistance level.
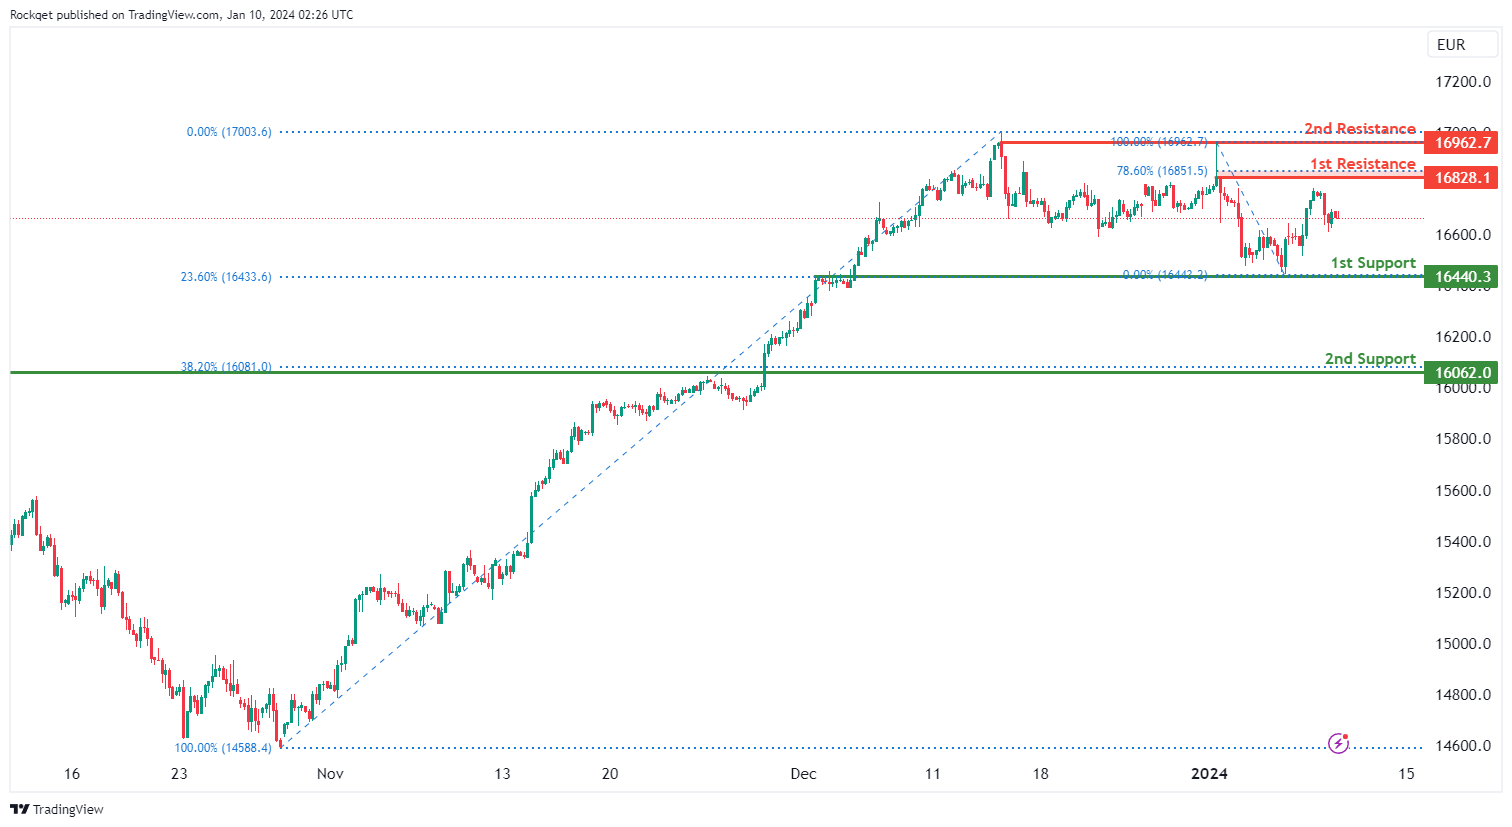
GER40:
The GER40 chart currently displays a neutral bias, indicating a potential for price to fluctuate between the 1st resistance and the 1st support.
The 1st support level at 16,440.30 is considered favourable as it is identified as an overlap support that aligns with the 23.60% Fibonacci retracement level. The 2nd support level at 16,062.00 is recognized as a pullback support that aligns with the 38.20% Fibonacci retracement level, adding to its potential significance as a level of historical importance.
On the resistance side, the 1st resistance level at 16,828.10 is identified as a pullback resistance that coincides with the 78.60% Fibonacci retracement level, suggesting a level where selling interest could materialize. The 2nd resistance level at 16,962.70 is also noteworthy for being a pullback resistance, further reinforcing its potential as a barrier to upward movement.
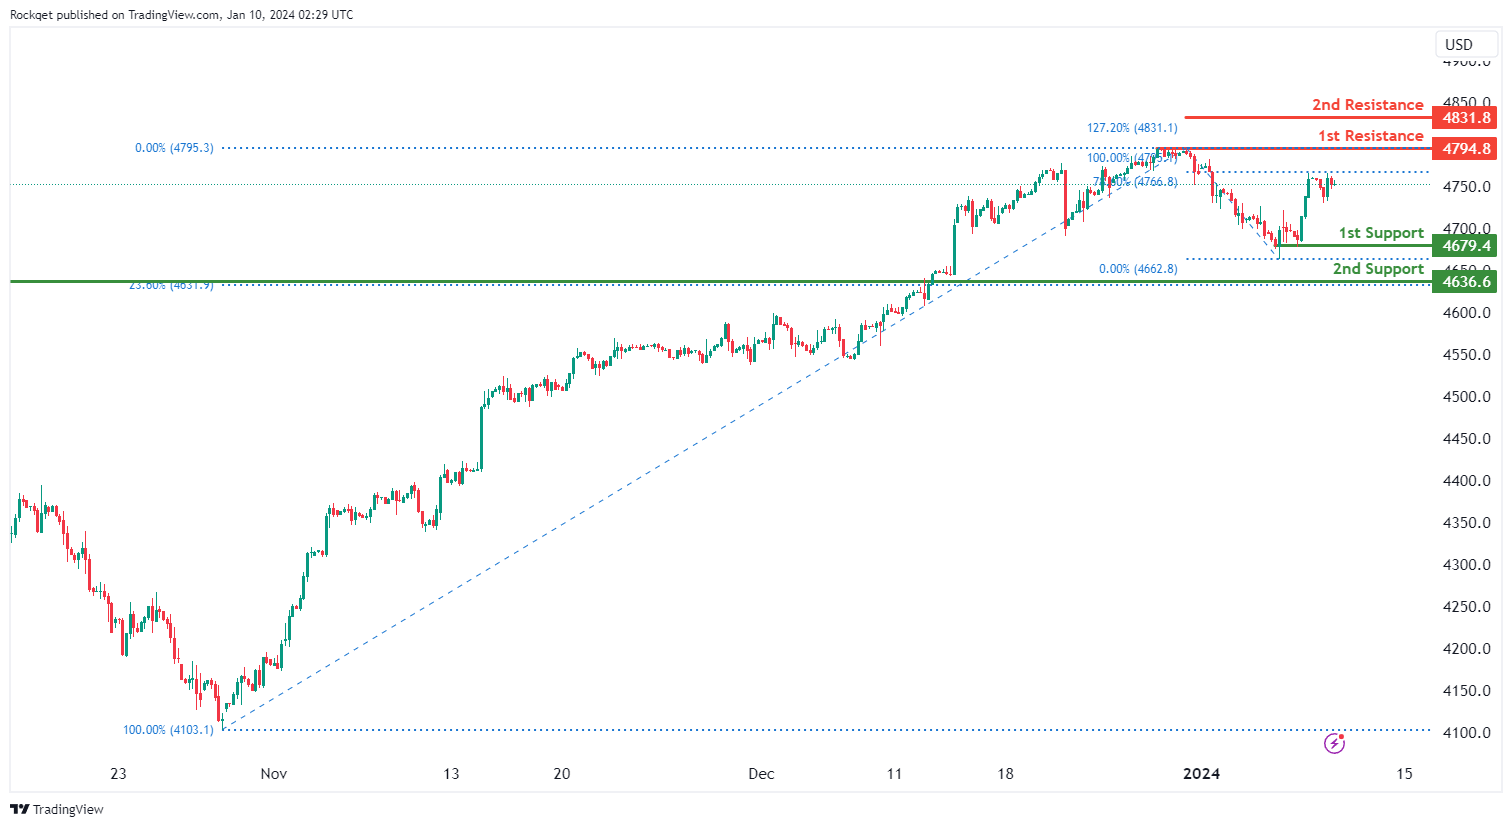
US500:
The US500 chart currently displays an overall bullish momentum. In this context, there is a potential for price to make a bullish continuation towards the 1st resistance.
The 1st resistance level at 4,794.80 is identified as a pullback resistance, suggesting a level where selling interest could materialize. The 2nd resistance level at 4,831.80 is identified as a resistance that aligns with the 127.20% Fibonacci extension level.
On the support side, the 1st support level at 4,679.40 is considered favourable due to its identification as a pullback support. The 2nd support level at 4,636.60 is also recognized as a pullback support that aligns with the 23.60% Fibonacci retracement level, adding to its potential as a support level.
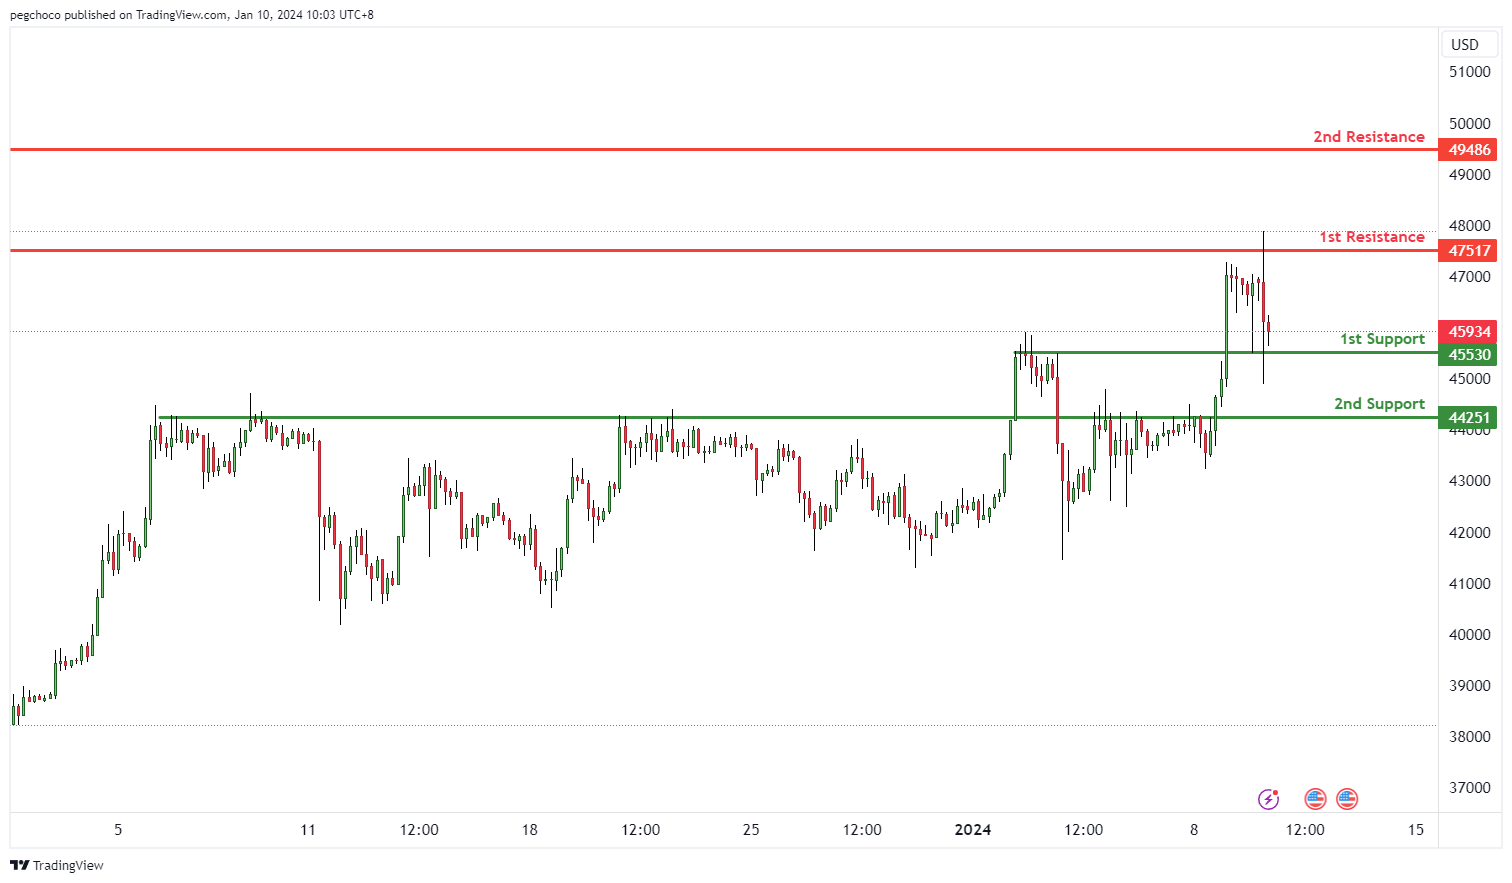
BTC/USD:
The BTC/USD chart currently exhibits a neutral bias, indicating a potential for price to fluctuate between the 1st resistance and the 1st support.
The 1st support level at 45,530 is considered favourable as it is identified as an overlap support, indicating historical significance as a level where buying interest has previously emerged. The 2nd support level at 44,251 is also recognized as an overlap support, adding to its potential as a support level.
On the resistance side, the 1st resistance level at 47,517 is identified as a multi-swing-high resistance while the 2nd resistance level at 49,486 is recognized as a swing-high resistance, suggesting a level where selling interest could materialize.
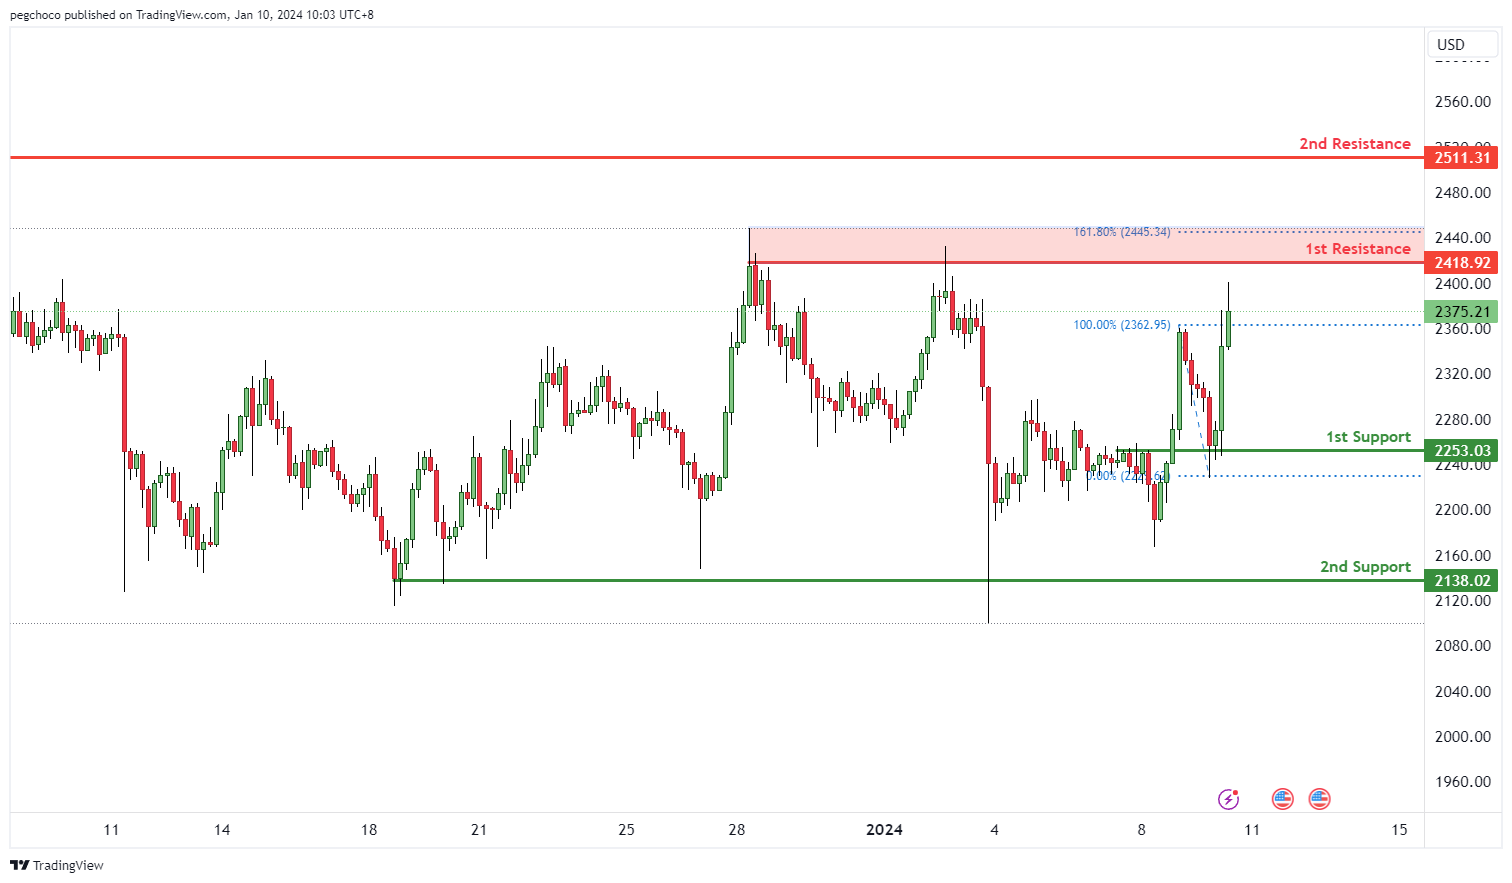
ETH/USD:
The ETH/USD chart currently exhibits a neutral bias, indicating a potential for price to fluctuate between the 1st resistance and the 1st support.
The 1st support level at 2,253.03 is identified as an overlap support, suggesting historical significance as a level where buying interest has previously emerged. The 2nd support level at 2,138.02 is recognized as a multi-swing-low support, adding to its potential as a support level.
On the resistance side, the 1st resistance level at 2,418.92 is identified as a multi-swing-high resistance that aligns close to the 161.80% Fibonacci extension level, suggesting a level where selling interest could materialize. The 2nd resistance level at 2,511.31 is recognized as a pullback resistance, suggesting a potential barrier for further upside movement.
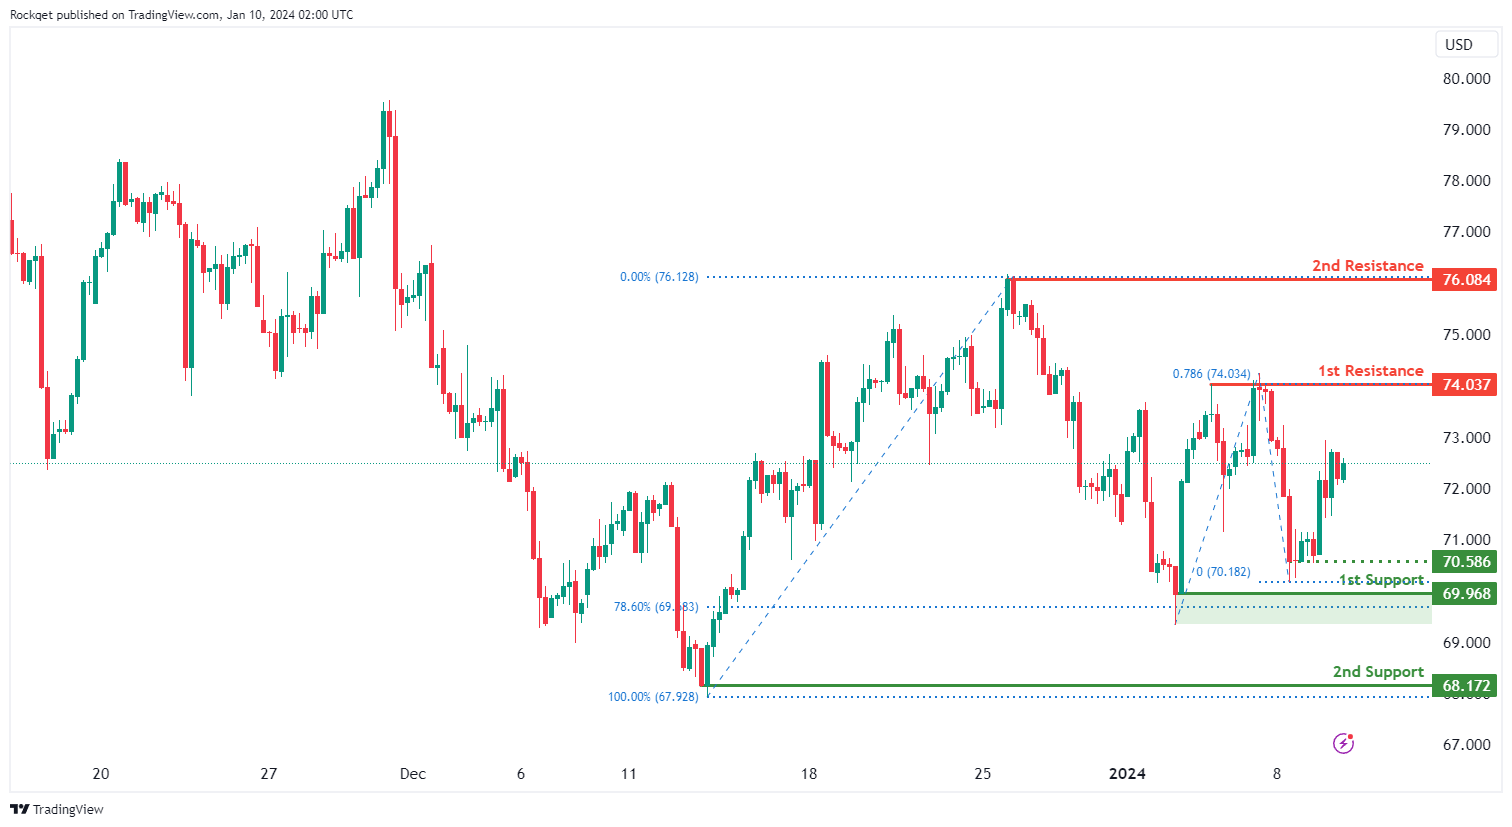
WTI/USD:
The WTI (West Texas Intermediate) chart currently exhibits an overall bullish momentum. In this context, there is a potential scenario for price to make a bullish continuation towards the 1st resistance.
The 1st resistance level at 74.03 is identified as a swing-high resistance that aligns with the 78.60% Fibonacci projection level. Higher up, the 2nd resistance level at 76.08 is also noted as a swing-high resistance, suggesting a potential barrier for further upside movement.
To the downside, the intermediate support level at 70.58 is identified as a pullback support while the 1st support level at 69.96 is noted as a swing-low support that aligns close to the 78.60% Fibonacci retracement level. Further below, the 2nd support level at 68.17 is also marked as a swing-low support, further reinforcing its importance as a key support level.
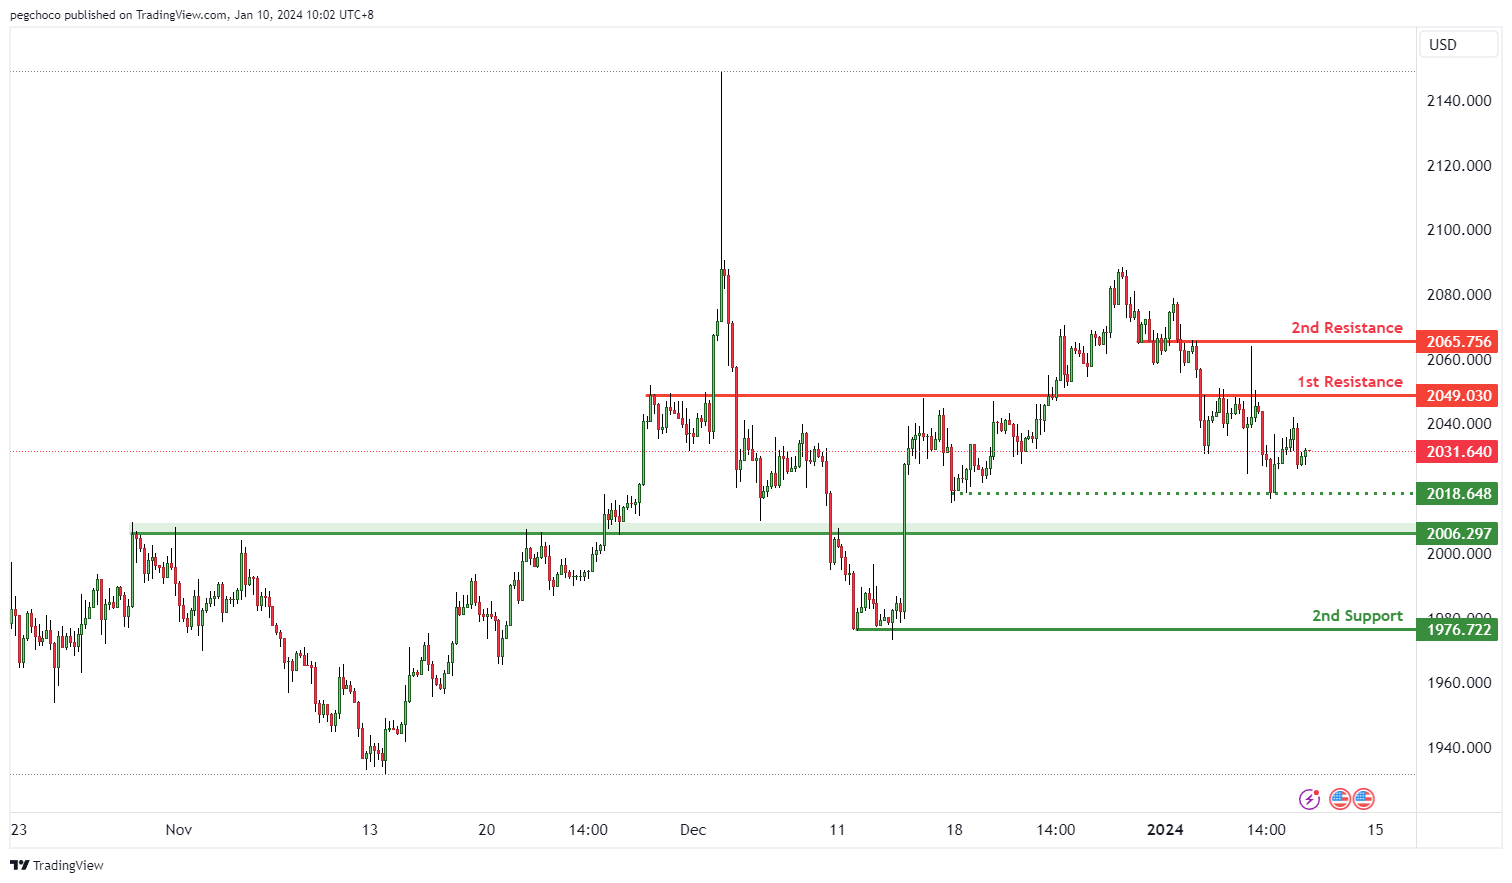
XAU/USD (GOLD):
The XAU/USD (Gold/US Dollar) chart currently exhibits a bearish overall momentum, indicating weakness in the price of gold relative to the US Dollar. This momentum suggests the potential for a bearish continuation towards the 1st support level.
The 1st support at 2006.29 is categorized as a pullback support. This level is significant as it implies a potential area where buying interest may emerge, providing temporary support for XAU/USD.
The 2nd support at 1976.72 is identified as multi-swing low support, further reinforcing its significance as a potential support zone.
On the resistance side, the 1st resistance at 2049.03 is marked as an overlap resistance, indicating a level where selling interest could intensify, potentially triggering a bearish reversal or resistance.
The 2nd resistance at 2065.75 is also categorized as an overlap resistance, further adding to its significance as a potential barrier for the price.
Additionally, there is an intermediate support level at 2018.64, identified as multi-swing low support. This level may also play a role in providing support to the XAU/USD pair.


