
DXY:
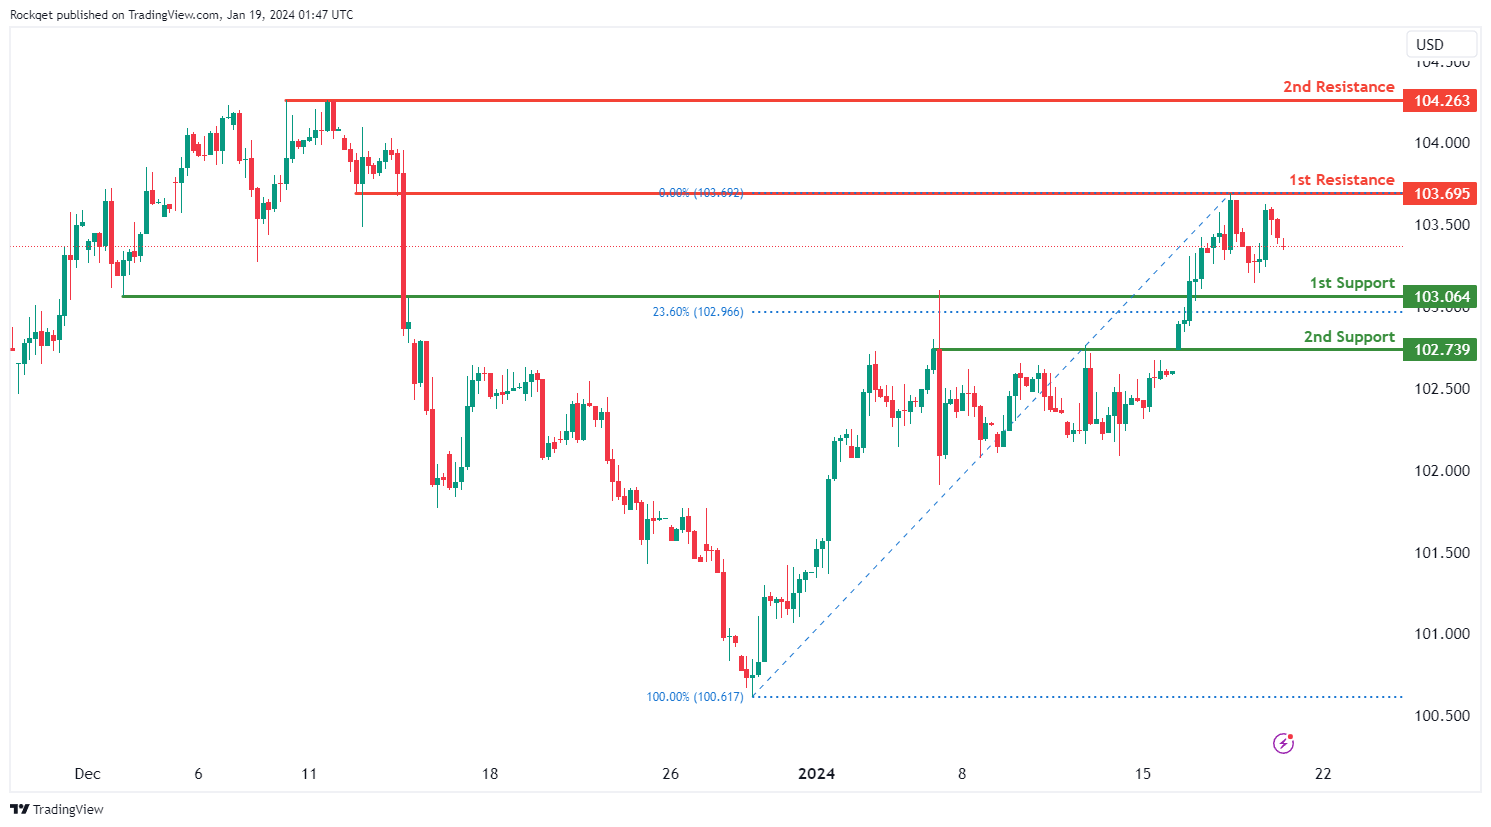
The DXY (US Dollar Index) chart currently exhibits an overall bullish momentum. However, there is a potential scenario for price to drop towards the 1st support before resuming the uptrend.
The 1st support level at 103.06 is identified as an overlap support that aligns close to the 23.60% Fibonacci retracement level. Further below, the 2nd support level at 102.73 is also marked as an overlap support, further reinforcing its importance as a key support level.
To the upside, the 1st resistance level at 103.69 is identified as an overlap resistance. Higher up, the 2nd resistance level at 104.26 is noted as a pullback resistance, further reinforcing its significance as a potential resistance zone.
EUR/USD:
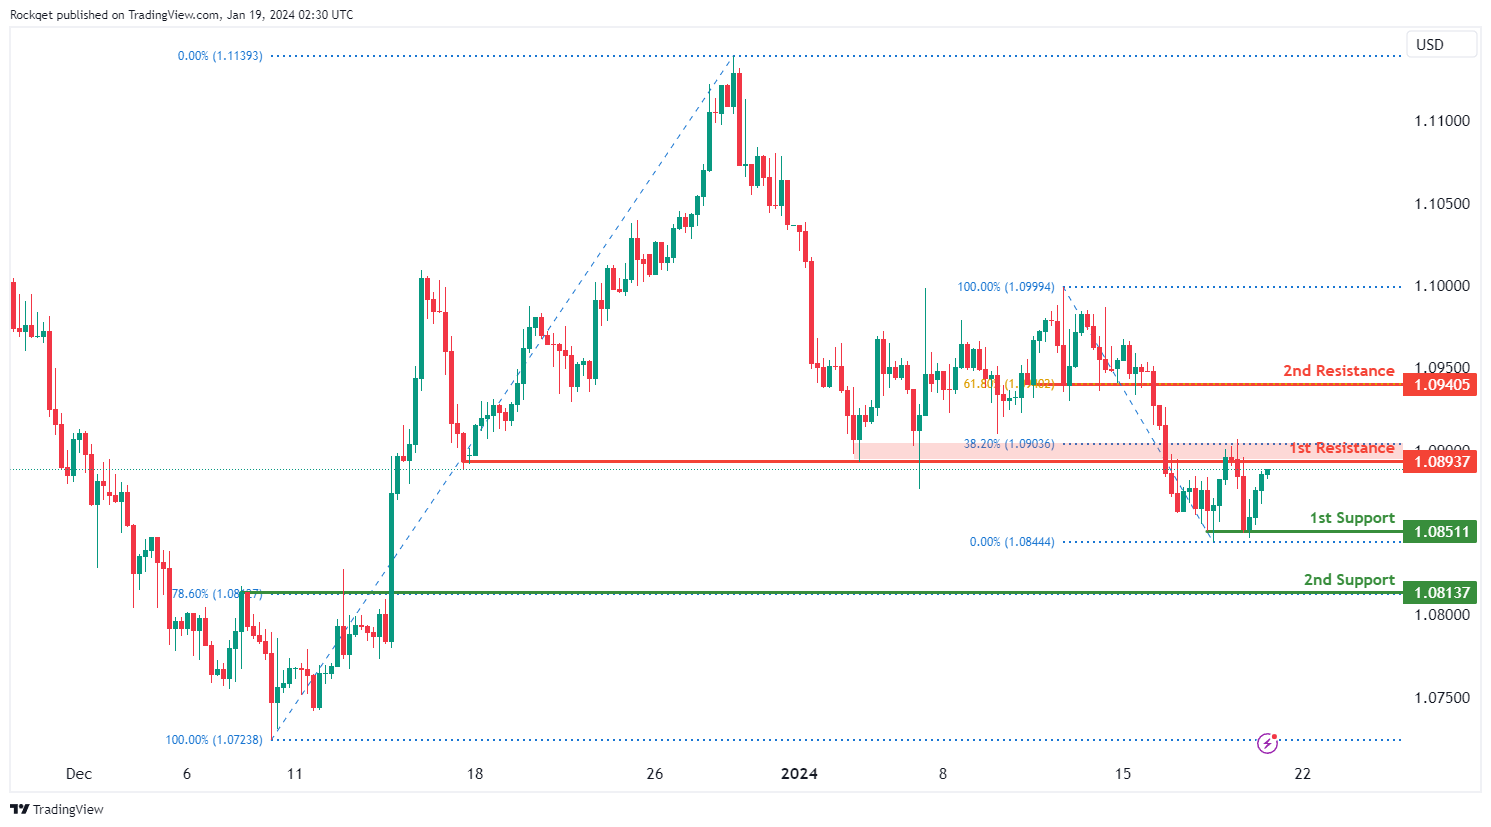
The EUR/USD chart currently exhibits an overall bearish momentum. However, there is a potential scenario for price to rise towards the 1st resistance before resuming the downtrend.
The 1st resistance level at 1.0893 is identified as a pullback resistance that aligns close to the 38.20% Fibonacci retracement level. Higher up, the 2nd resistance level at 1.0940 is also noted as a pullback resistance that aligns with the 61.80% Fibonacci retracement level, suggesting a potential barrier for further upside movement.
To the downside, the 1st support level at 1.0851 is also noted as a pullback support. Further below, the 2nd support level at 1.0813 is also marked as a pullback support that aligns with the 78.60% Fibonacci retracement level, further reinforcing its importance as a key support level.
EUR/JPY:
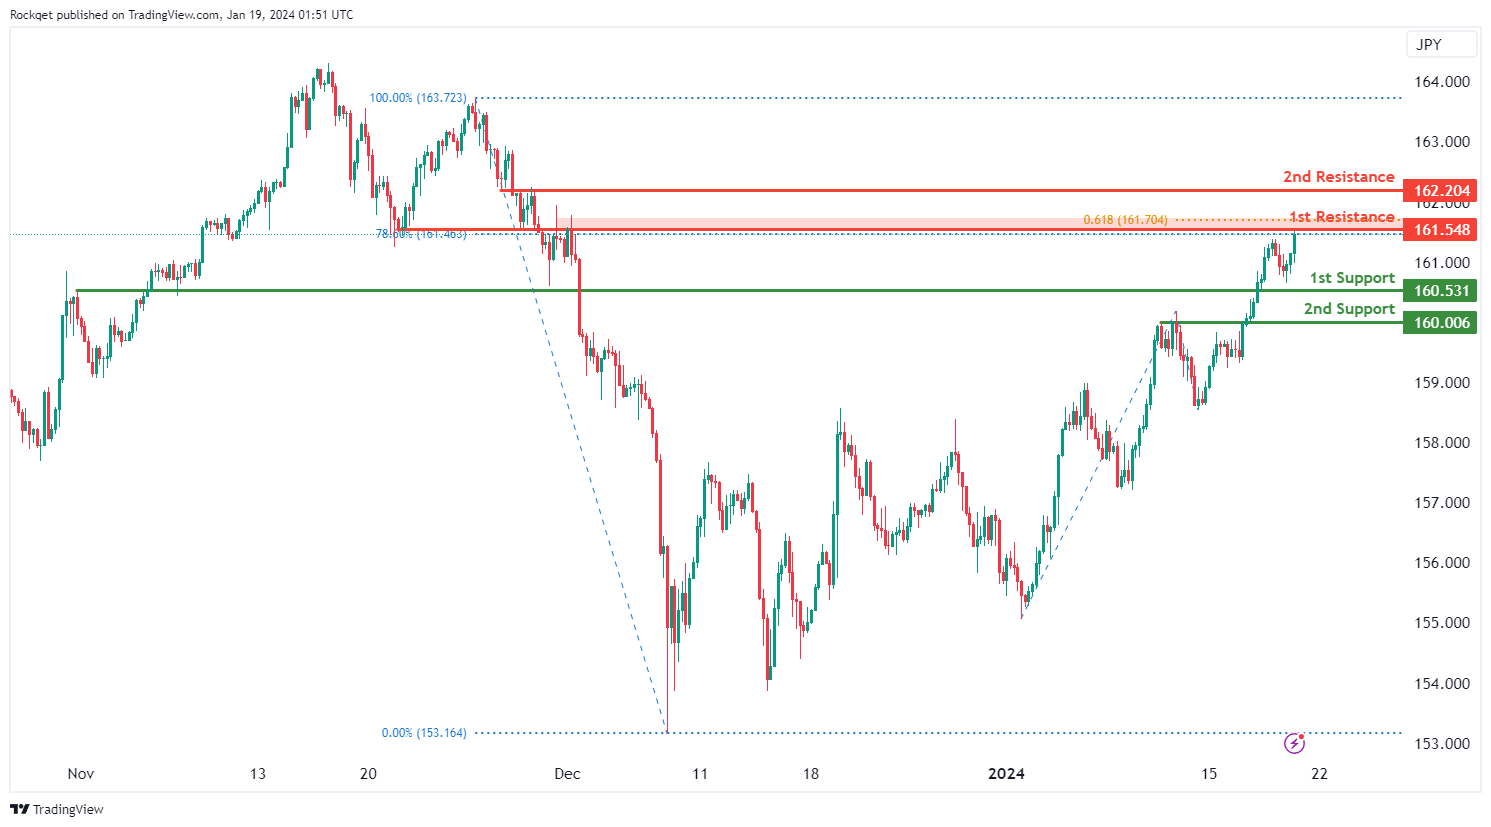
The EUR/JPY chart currently exhibits an overall bullish momentum. In this context, there is a potential scenario for price to break above the 1st resistance and rise towards the 2nd resistance.
The 1st resistance level at 161.54 is identified as an overlap resistance that aligns with a confluence of Fibonacci levels i.e. the 78.60% retracement and the 61.80% projection. Higher up, the 2nd resistance level at 162.20 is also noted as an overlap resistance, further reinforcing its significance as a potential resistance zone.
To the downside, the 1st support level at 160.53 is identified as an overlap support. Further below, the 2nd support level at 160.00 is marked as a pullback support, further reinforcing its importance as a key support level.
EUR/GBP:
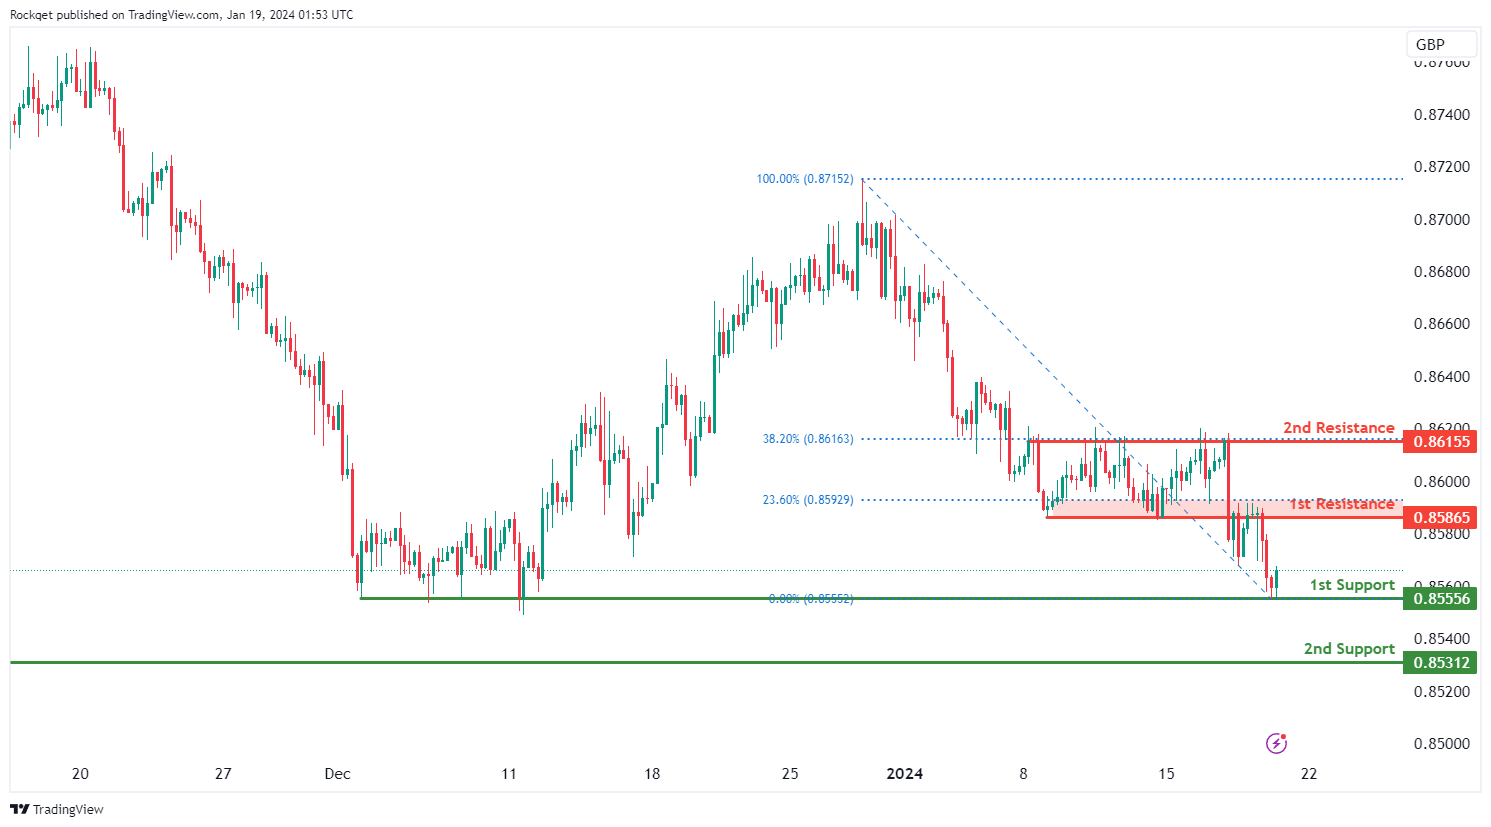
The EUR/GBP chart currently exhibits an overall bearish momentum. However, there is a potential scenario for price to rise towards the 1st resistance before resuming the downtrend.
The 1st resistance level at 0.8586 is identified as an overlap resistance that aligns close to the 23.60% Fibonacci retracement level. Higher up, the 2nd resistance level at 0.8615 is noted as a pullback resistance that aligns with the 38.20% Fibonacci retracement level, suggesting a potential barrier for further upside movement.
To the downside, the 1st support level at 0.8555 is identified as a pullback support. Further below, the 2nd support level at 0.8531 is marked as a swing-low support, further reinforcing its importance as a key support level.
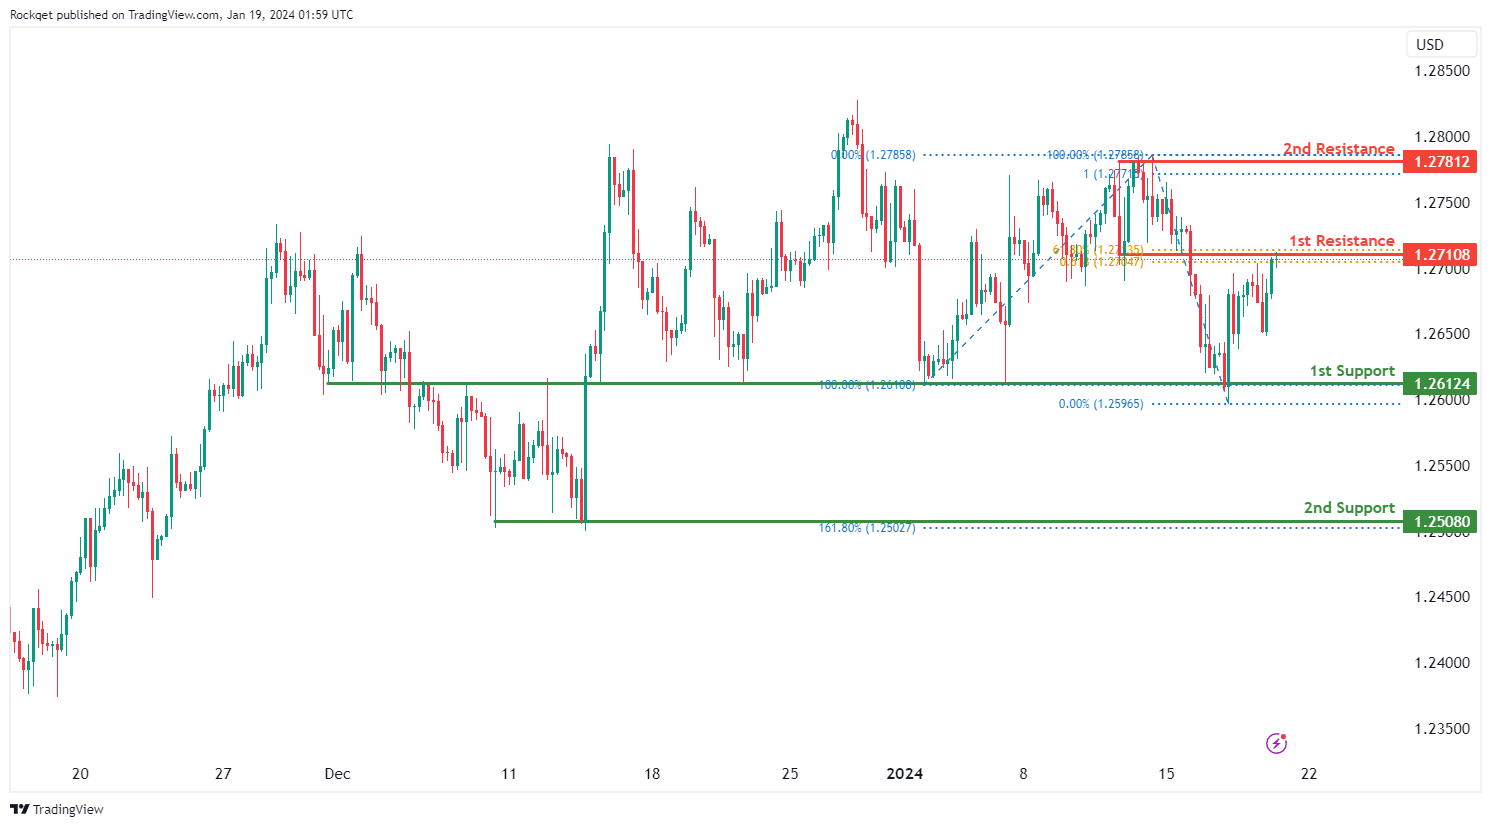
GBP/USD:
The GBP/USD chart currently exhibits a neutral bias. In this context, there is a potential scenario for price to fluctuate between the 1st resistance and 1st support.
The 1st resistance level at 1.2710 is identified as an overlap resistance that aligns with a confluence of Fibonacci levels i.e. the 61.80% retracement and the 61.80% projection. Higher up, the 2nd resistance level at 1.2781 is noted as a swing-high resistance, suggesting a potential barrier for further upside movement.
To the downside, the 1st support level at 1.2612 is identified as an overlap support. Further below, the 2nd support level at 1.2508 is marked as a swing-low support that aligns with the 161.80% Fibonacci extension level, further reinforcing its importance as a key support level.
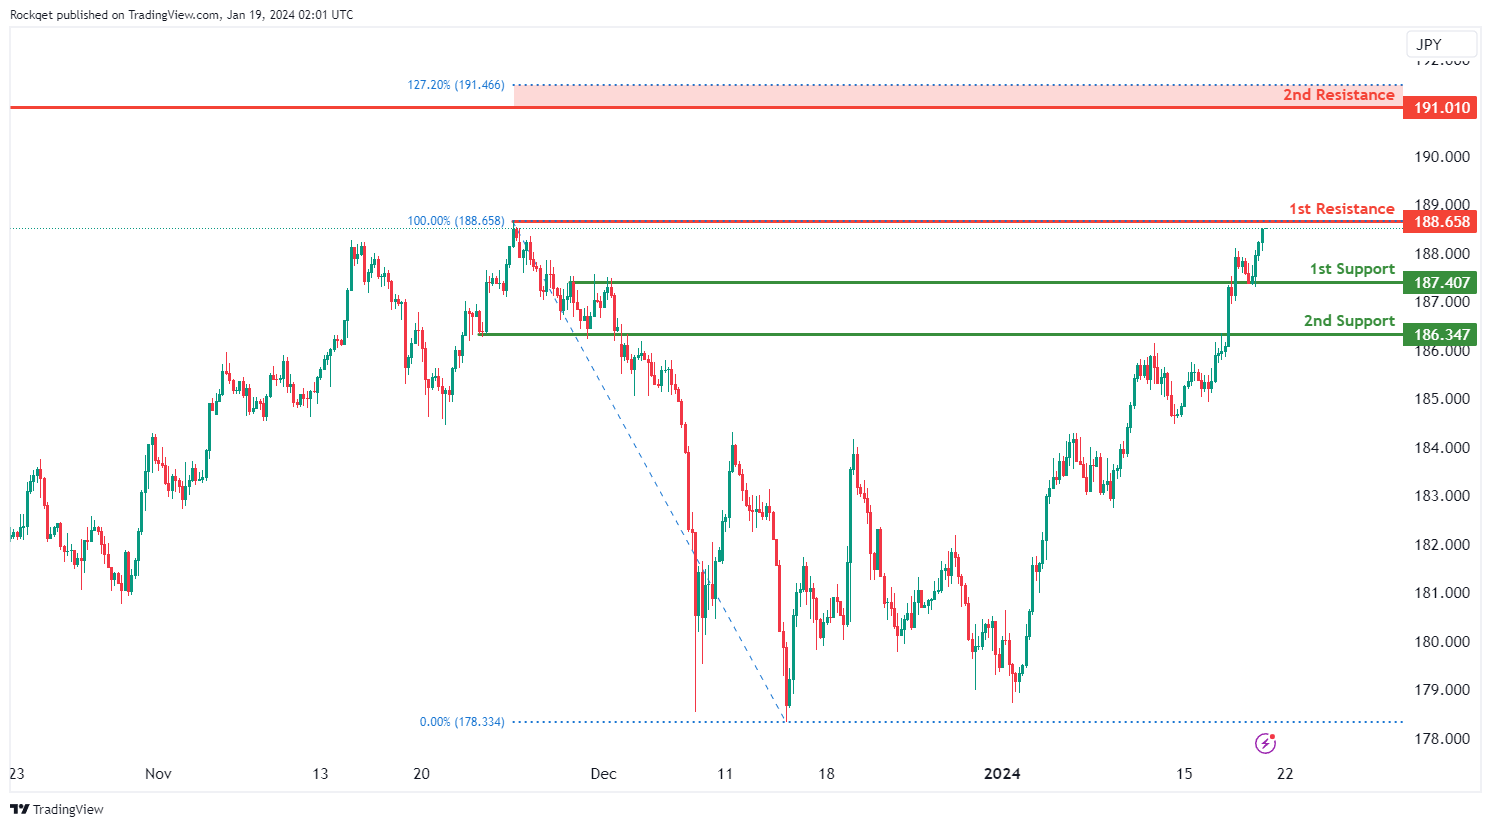
GBP/JPY:
The GBP/JPY chart currently exhibits an overall bullish momentum. In this context, there is a potential scenario for price to rise towards the 1st resistance.
The 1st resistance level at 188.65 is identified as a swing-high resistance. Higher up, the 2nd resistance level at 191.01 is noted as a pullback resistance that aligns close to the 127.20% Fibonacci extension level, further reinforcing its significance as a potential resistance zone.
To the downside, the 1st support level at 187.40 is identified as an overlap support. Further below, the 2nd support level at 186.34 is also marked as an overlap support, further reinforcing its importance as a key support level.
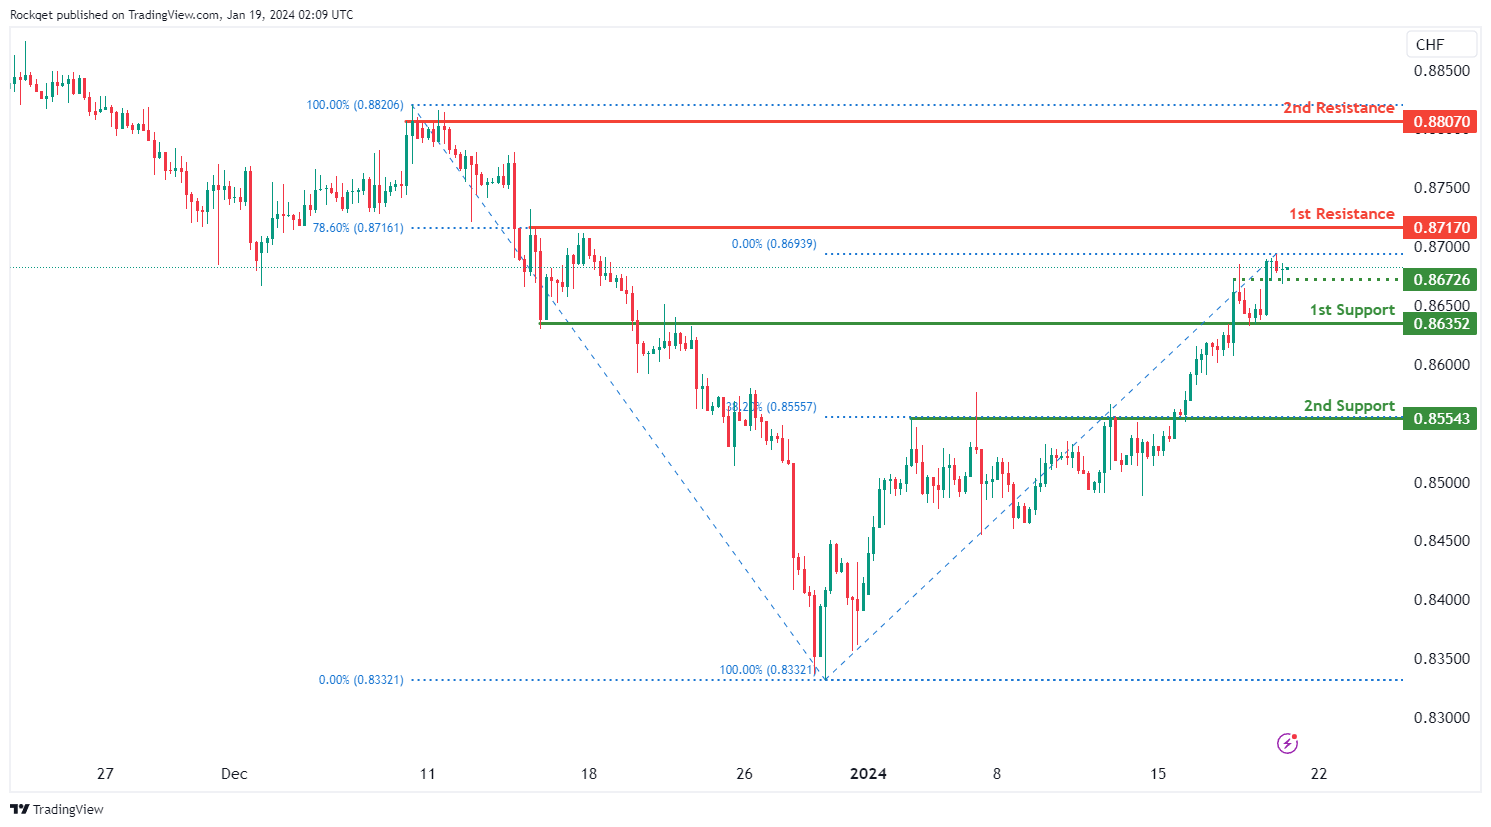
USD/CHF:
The USD/CHF chart currently exhibits an overall bullish momentum. However, there is a potential scenario for price to rise towards the 1st resistance.
The 1st resistance level at 0.8717 is identified as a pullback resistance that aligns with the 78.60% Fibonacci retracement level. Higher up, the 2nd resistance level at 0.8807 is also noted as a pullback resistance, further reinforcing its significance as a potential resistance zone.
To the downside, the intermediate support level at 0.8672 is identified as an overlap support while the 1st support level at 0.8635 is also noted as an overlap support. Further below, the 2nd support level at 0.8554 is marked as a pullback support that aligns with the 38.20% Fibonacci retracement level, further reinforcing its importance as a key support level.
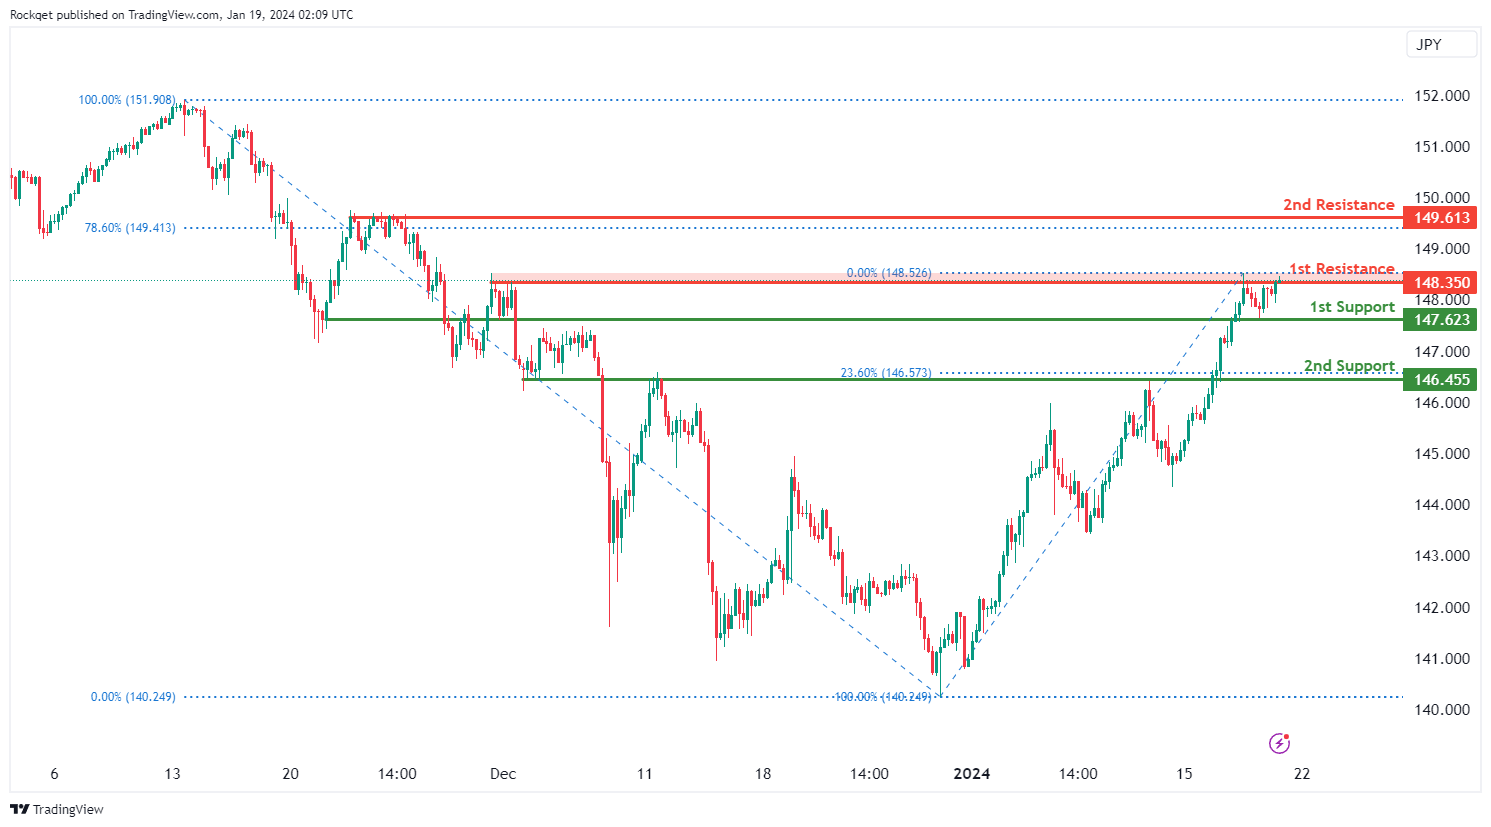
USD/JPY:
The USD/JPY chart currently exhibits an overall bullish momentum. However, there is a potential scenario for price to break above the 1st resistance and rise towards the 2nd resistance.
The 1st resistance level at 148.35 is identified as a pullback resistance. Higher up, the 2nd resistance level at 149.61 is also noted as a pullback resistance that aligns close to the 78.60% Fibonacci retracement level, further reinforcing its significance as a potential resistance zone.
To the downside, the 1st support level at 147.62 is identified as an overlap support. Further below, the 2nd support level at 146.45 is also marked as an overlap support that aligns with the 23.60% Fibonacci retracement level, further reinforcing its importance as a key support level.
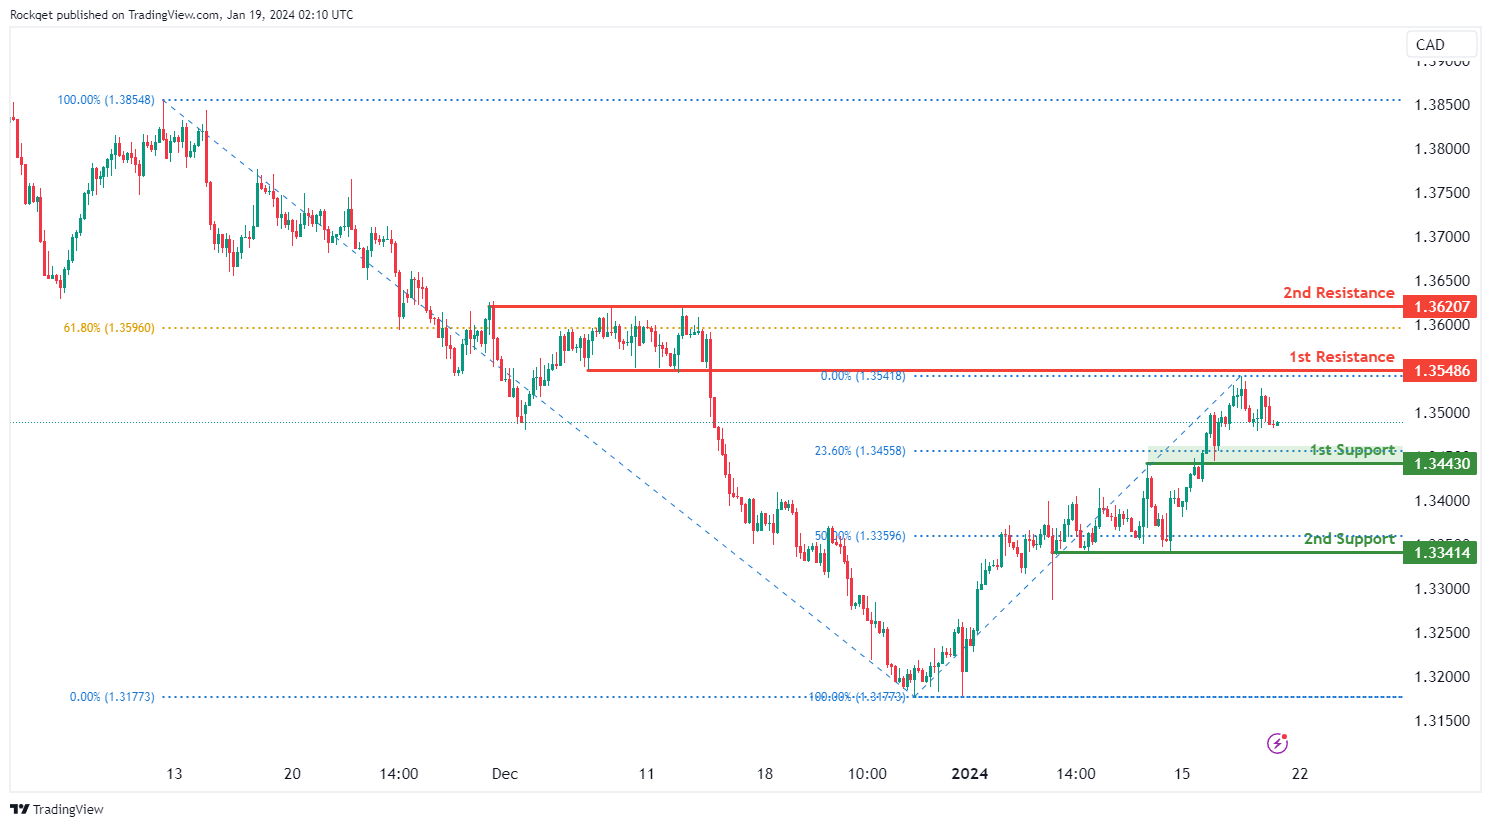
USD/CAD:
The USD/CAD chart currently exhibits an overall bullish momentum. However, there is a potential scenario for price to drop towards the 1st support before resuming the uptrend.
The 1st support level at 1.3443 is identified as an overlap support that aligns close to the 23.60% Fibonacci retracement level. Further below, the 2nd support level at 1.3341 is marked as a pullback support that aligns close to the 50.00% Fibonacci retracement level, further reinforcing its importance as a key support level.
To the upside, the 1st resistance level at 1.3548 is identified as a pullback resistance. Higher up, the 2nd resistance level at 1.3620 is also noted as a pullback resistance that aligns close to the 61.80% Fibonacci retracement level, further reinforcing its significance as a potential resistance zone.
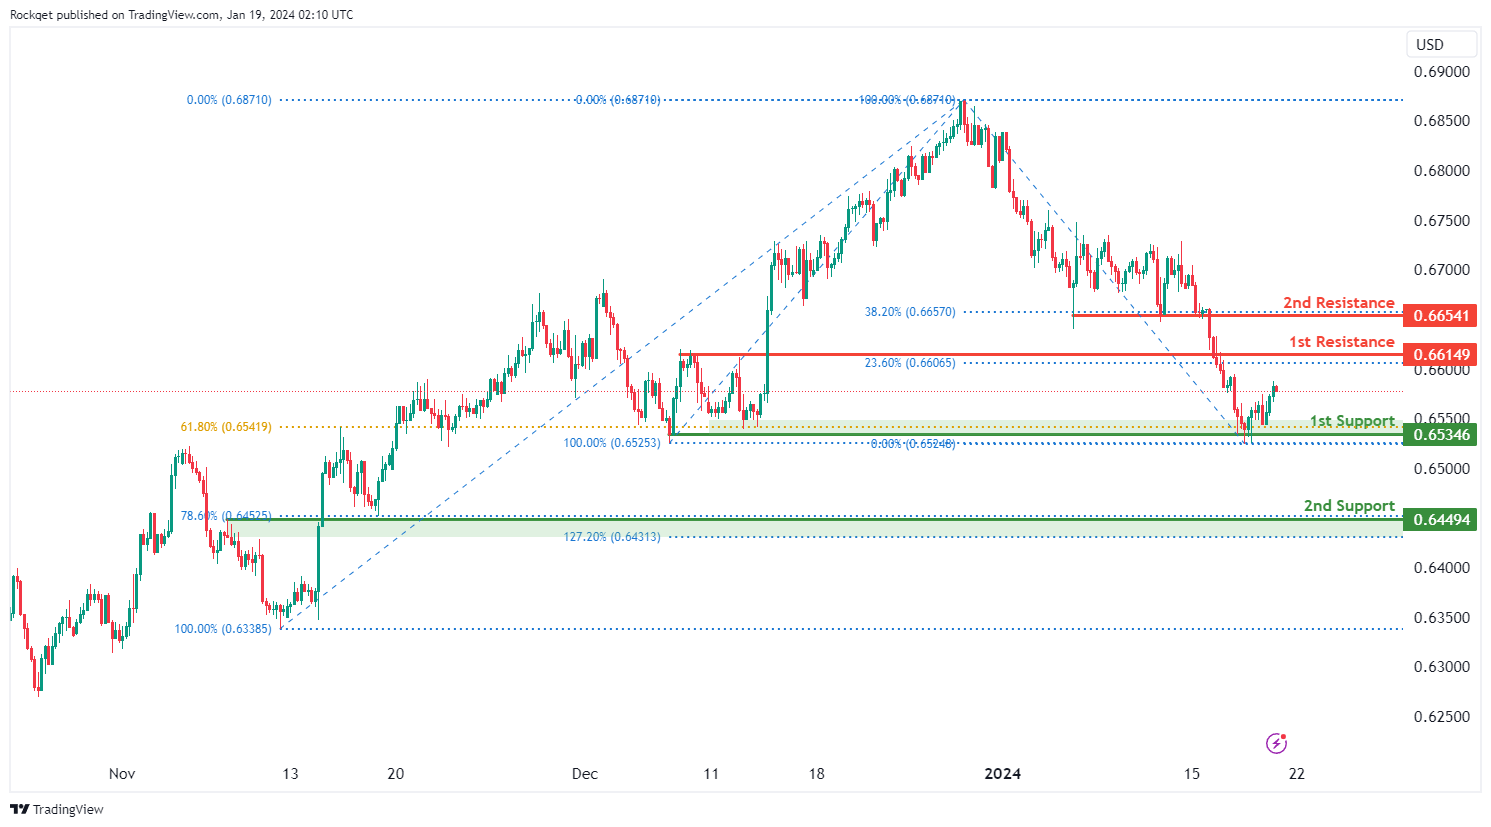
AUD/USD:
The AUD/USD chart currently exhibits an overall bearish momentum. However, there is a potential scenario for price to rise towards the 1st resistance before resuming the downtrend.
The 1st resistance level at 0.6614 is identified as a pullback resistance that aligns with the 23.60% Fibonacci retracement level. Higher up, the 2nd resistance level at 0.6654 is also noted as a pullback resistance that aligns with the 38.20% Fibonacci retracement level, suggesting a potential barrier for further upside movement.
To the downside, the 1st support level at 0.6534 is identified as a pullback support that aligns with the 61.80% Fibonacci retracement level. Further below, the 2nd support level at 0.6449 is marked as an overlap support that aligns with a confluence of Fibonacci levels i.e. the 78.60% retracement and the 127.20% extension, further reinforcing its importance as a key support level.
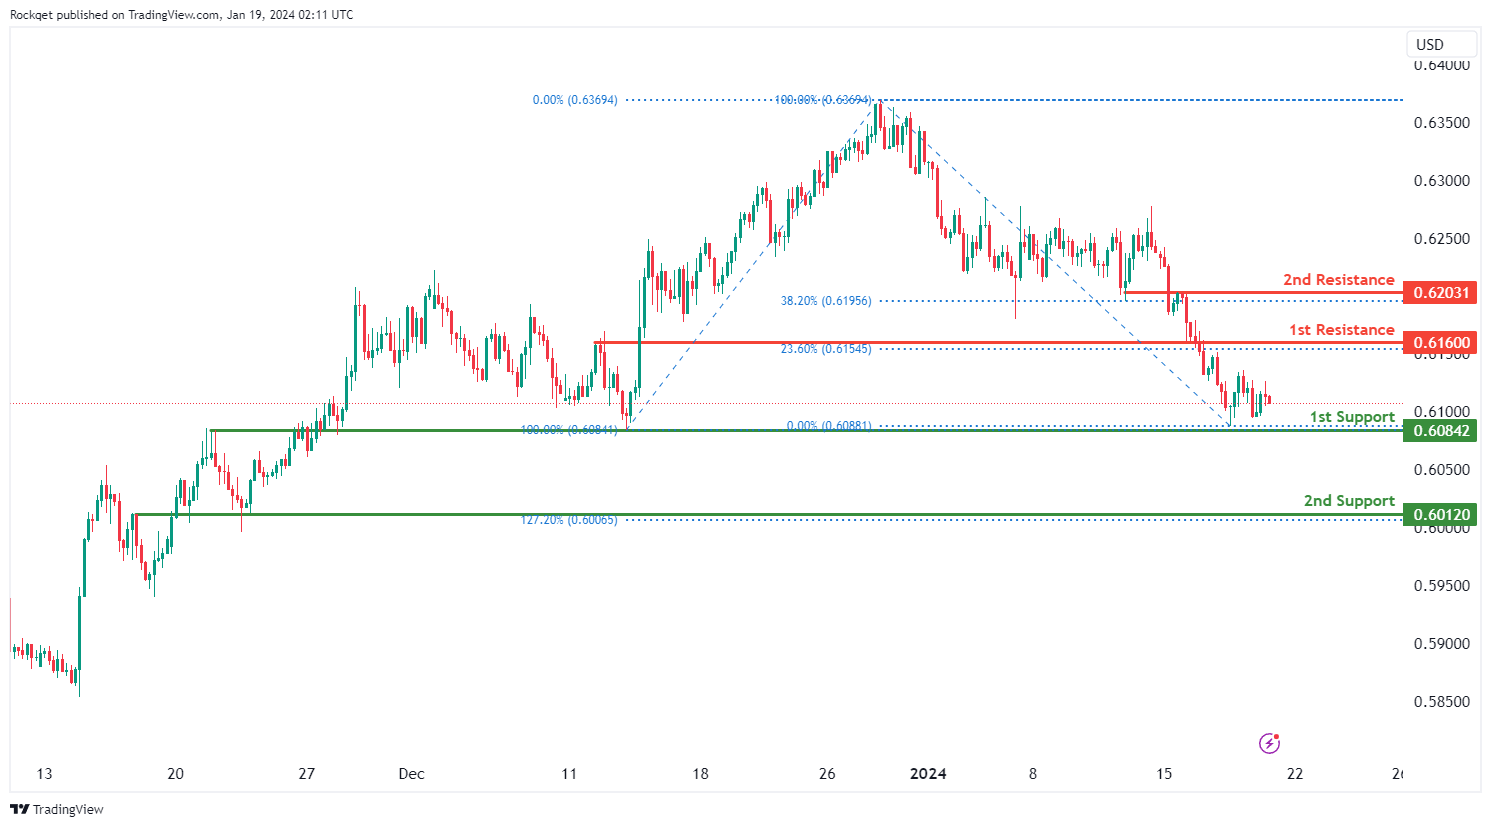
NZD/USD
The NZD/USD chart currently exhibits an overall bearish momentum. However, there is a potential scenario for price to rise towards the 1st resistance before resuming the downtrend.
The 1st resistance level at 0.6160 is identified as a pullback resistance that aligns with the 23.60% Fibonacci retracement level. Higher up, the 2nd resistance level at 0.6203 is noted as an overlap resistance that aligns with the 38.20% Fibonacci retracement level, suggesting a potential barrier for further upside movement.
To the downside, the 1st support level at 0.6084 is identified as an overlap support. Further below, the 2nd support level at 0.6012 is also marked as an overlap support that aligns with the 127.20% Fibonacci extension level, further reinforcing its importance as a key support level.
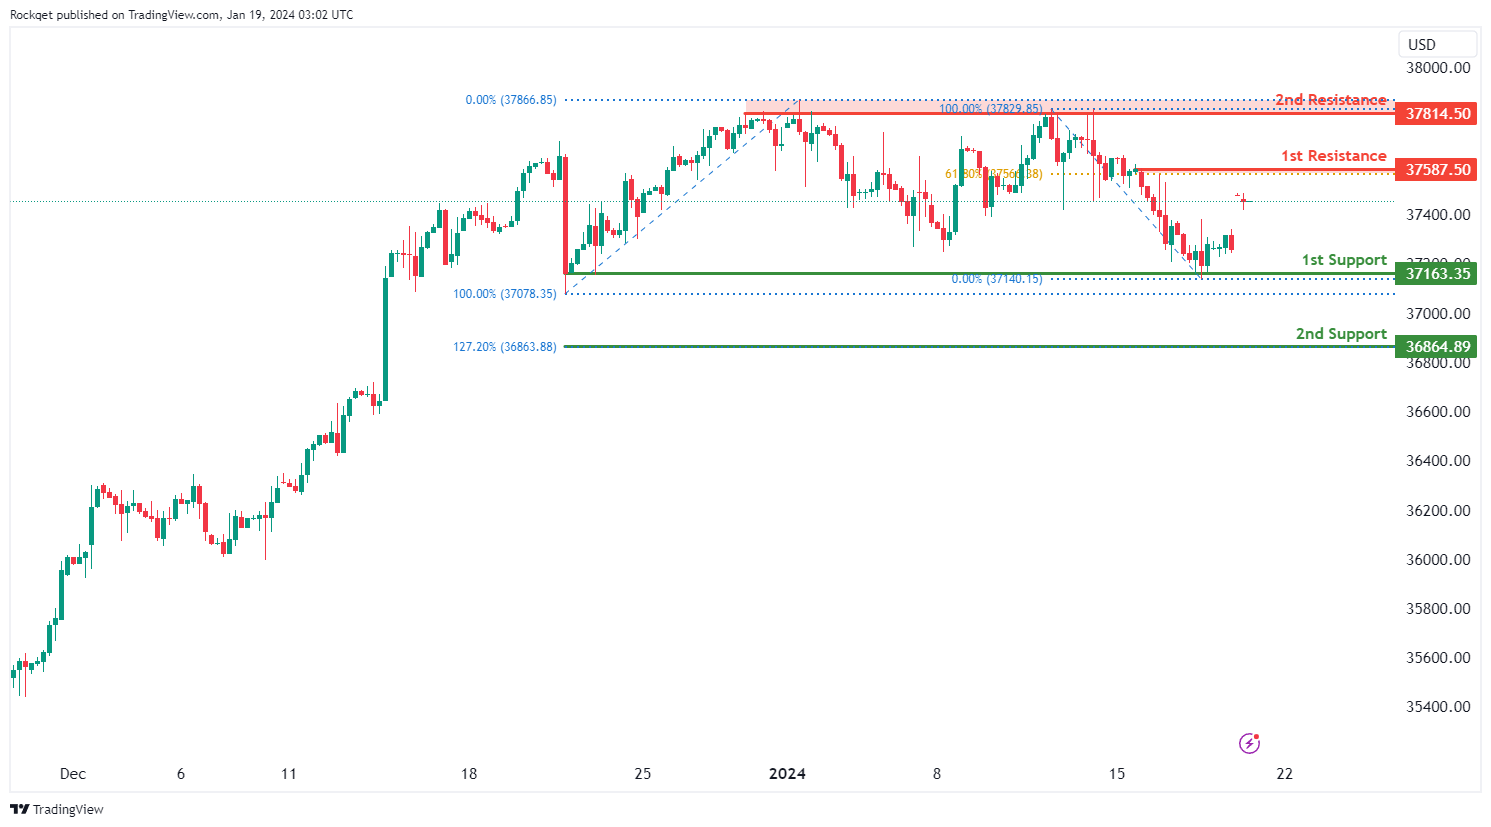
DJ30:
The DJ30 (Dow Jones) chart currently exhibits a neutral bias. In this context, there is a potential scenario for price to fluctuate between the 1st resistance and 1st support.
The 1st resistance level at 37,587.50 is identified as a pullback resistance that aligns with the 61.80% Fibonacci retracement level. Higher up, the 2nd resistance level at 37,814.50 is noted as a multi-swing-high resistance, suggesting a potential barrier for further upside movement.
To the downside, the 1st support level at 37,163.35 is identified as pullback support. Further below, the 2nd support level at 36,864.89 is marked as a support level that aligns with the 127.20% Fibonacci extension level, further reinforcing its importance as a key support level.
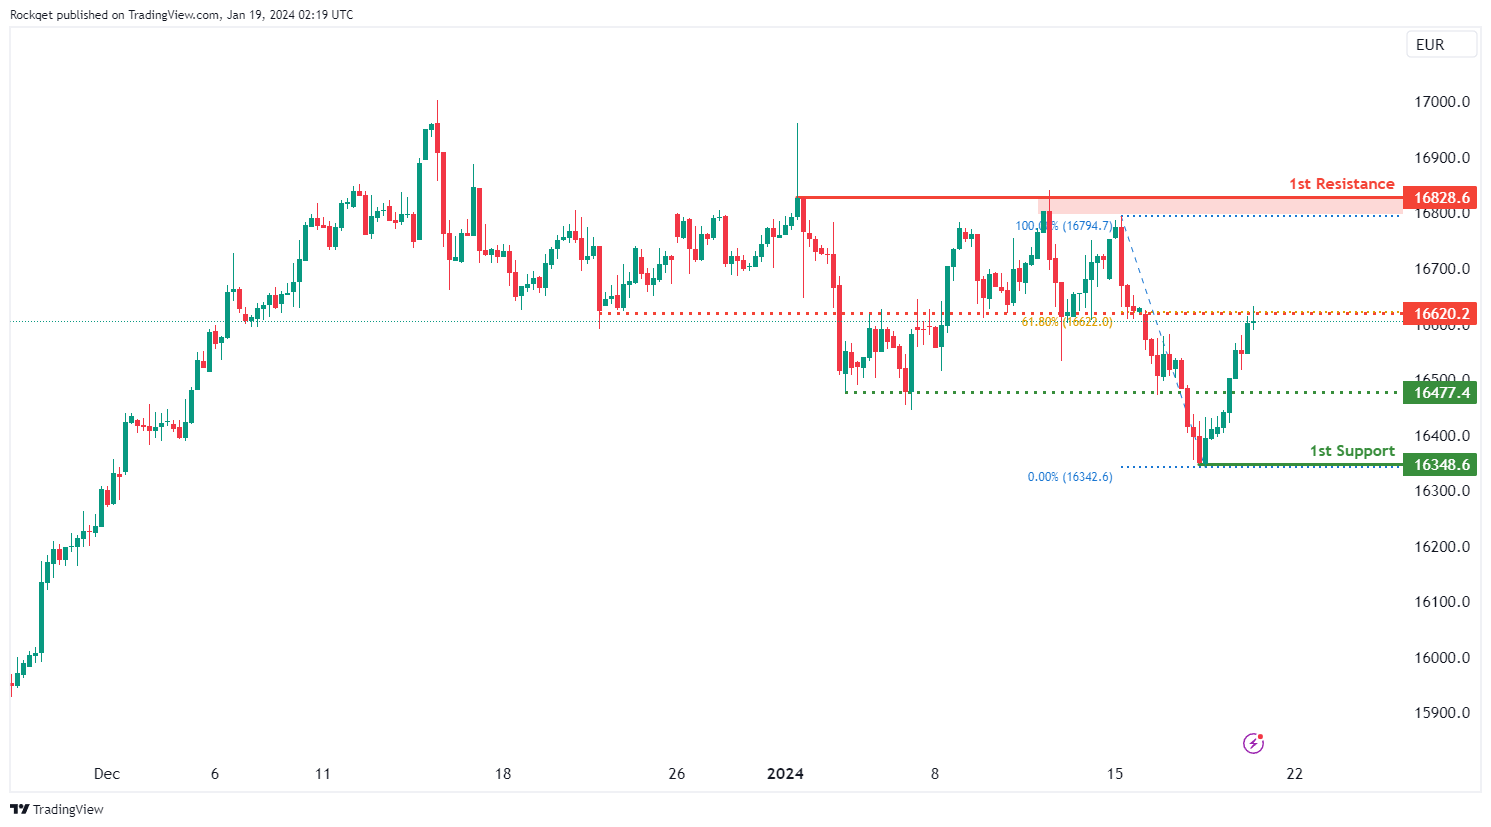
GER40:
The GER40 (DAX) chart currently exhibits an overall bullish momentum. In this context, there is a potential scenario for price to rise towards the 1st resistance should it break above the intermediate resistance.
The intermediate resistance level at 16,620.20 is identified as an overlap resistance that aligns with the 61.80% Fibonacci retracement level. Higher up, the 2nd resistance level at 16,828.60 is noted as a pullback resistance, further reinforcing its significance as a potential resistance zone.
To the downside, the intermediate support level at 16,477.40 is identified as a pullback support. Further below, the 1st support level at 16,348.60 is noted as a swing-low support, further reinforcing its importance as a key support level.
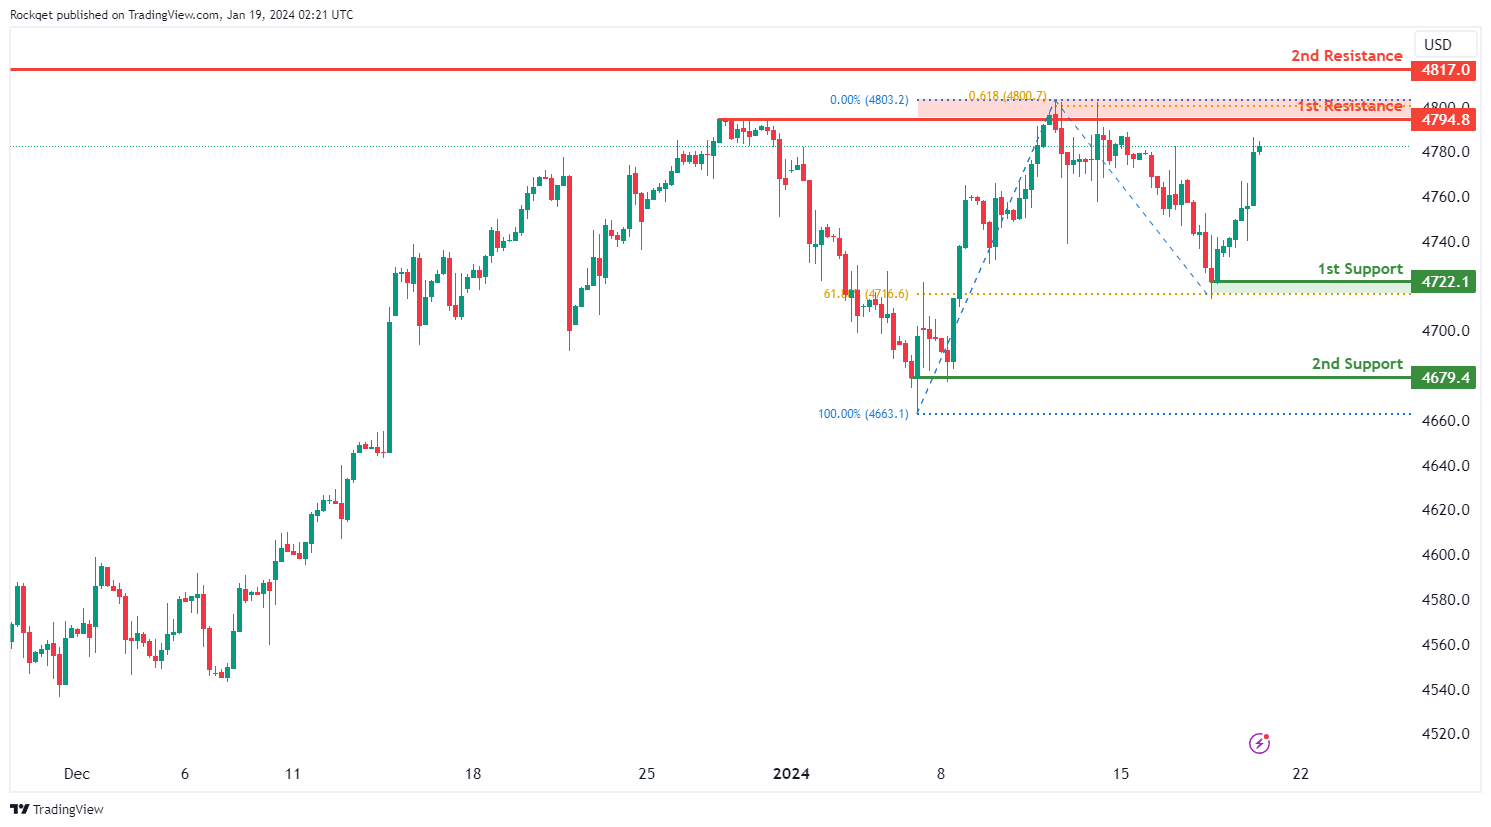
US500:
The US500 (S&P 500) chart currently exhibits an overall bullish momentum. In this context, there is a potential scenario for price to rise towards the 1st resistance.
The 1st resistance level at 4,794.80 is identified as a multi-swing-high resistance that aligns close to the 61.80% Fibonacci projection level. Higher up, the 2nd resistance level at 4,817.00 is noted as a swing-high resistance at the all-time high, further reinforcing its significance as a potential resistance zone.
To the downside, the 1st support level at 4,722.10 is identified as a swing-low support that aligns with the 61.80% Fibonacci retracement level. Further below, the 2nd support level at 4,679.40 is also noted as a swing-low support, further reinforcing its importance as a key support level.
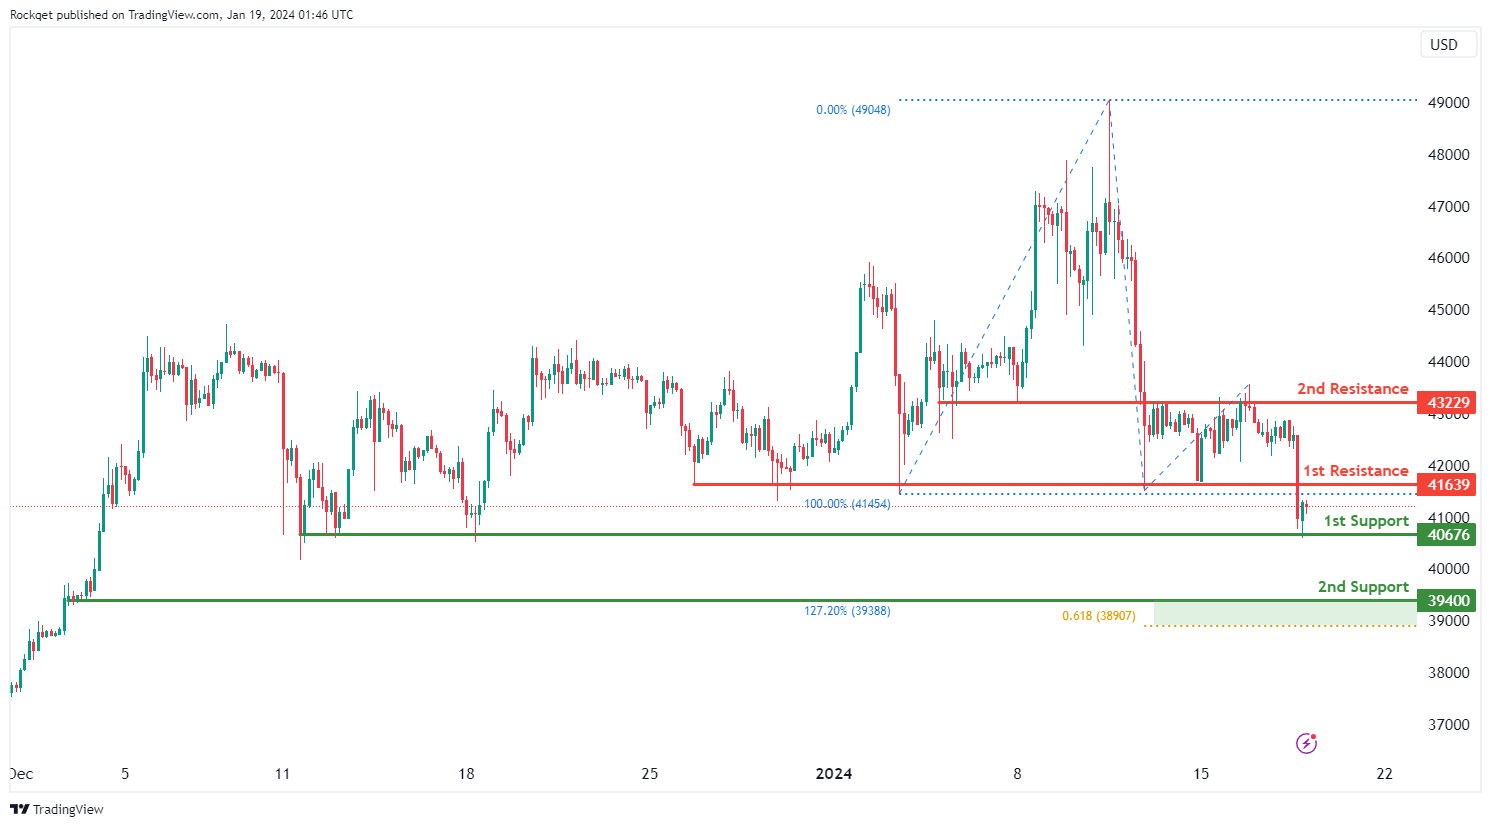
BTC/USD:
The BTC/USD (Bitcoin) chart currently exhibits a neutral bias. In this context, there is a potential scenario for price to fluctuate between the 1st resistance and 1st support.
The 1st resistance level at 41,639.00 is identified as a pullback resistance. Higher up, the 2nd resistance level at 43,229.00 is noted as an overlap resistance, suggesting a potential barrier for further upside movement.
To the downside, the 1st support level at 40,676.00 is identified as a pullback support. Further below, the 2nd support level at 39,400.00 is marked as a pullback support that aligns with a confluence of Fibonacci levels i.e. the 127.20% extension and the 61.80% projection, further reinforcing its importance as a key support level.
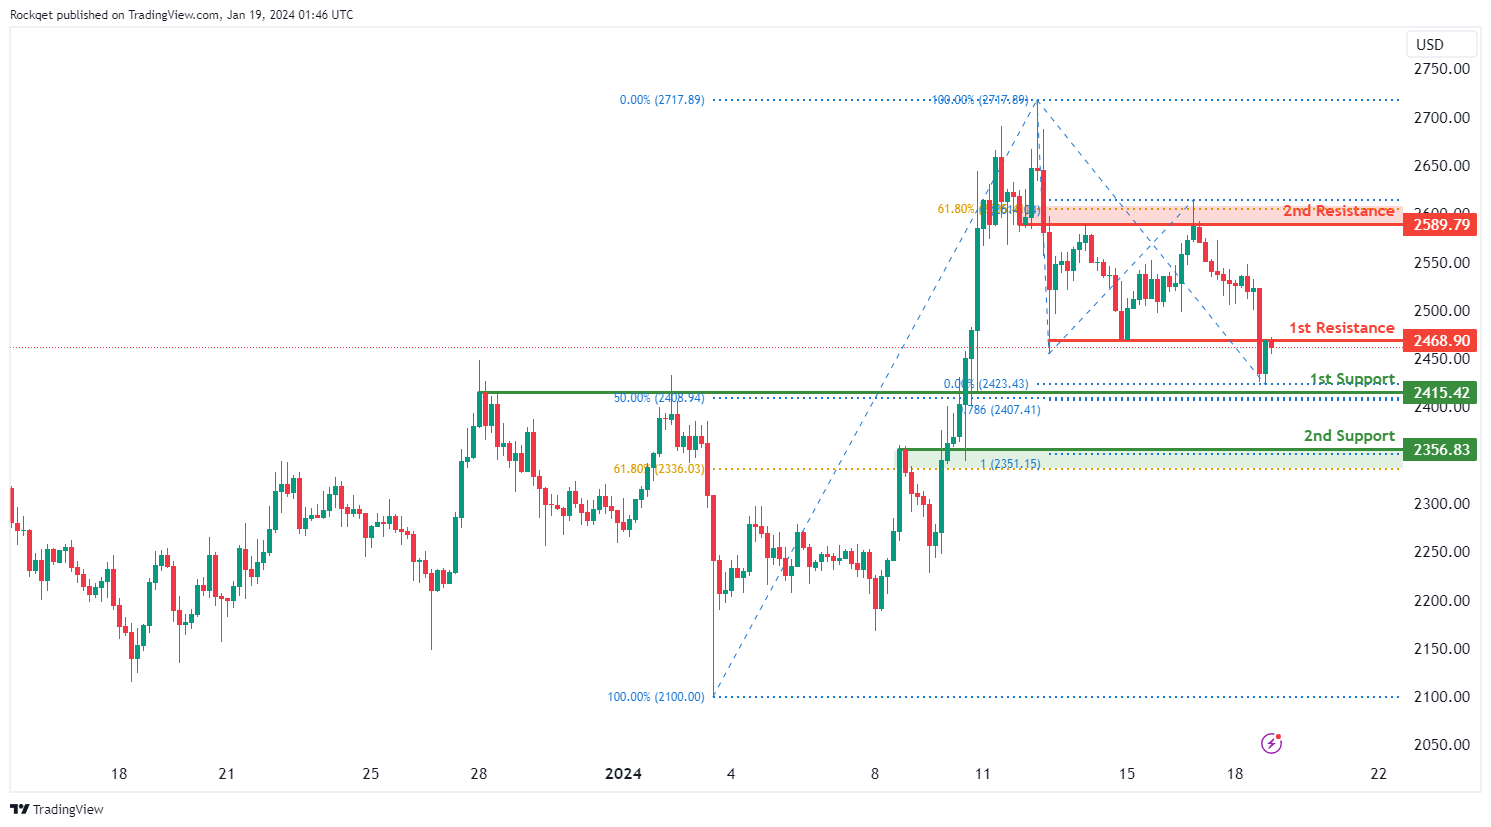
ETH/USD:
The ETH/USD (Ethereum) chart currently exhibits an overall bearish momentum. However, there is a potential scenario for price to rise towards the 1st resistance before resuming the downtrend.
The 1st resistance level at 2,468.90 is identified as an overlap resistance. Higher up, the 2nd resistance level at 2,589.79 is also noted as an overlap resistance that aligns close to the 61.80% Fibonacci retracement level, suggesting a potential barrier for further upside movement.
To the downside, the 1st support level at 2,415.42 is identified as a pullback support that aligns with a confluence of Fibonacci levels i.e. the 50.00% retracement and the 78.60% projection. Further below, the 2nd support level at 2,356.83 is also marked as a pullback support that aligns with a confluence of Fibonacci levels i.e. the 61.80% retracement and the 100.00% projection, further reinforcing its importance as a key support level.
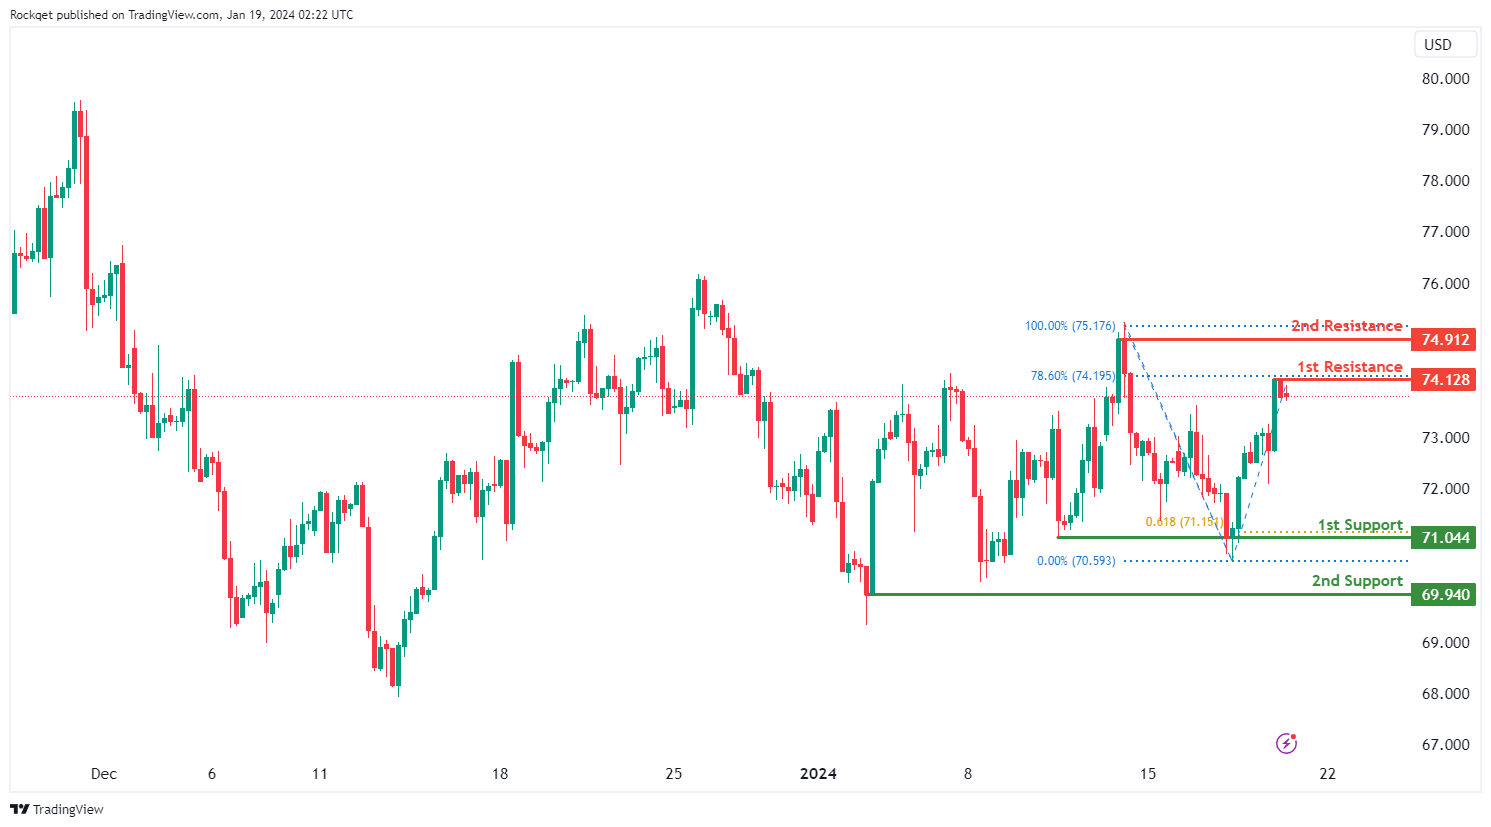
WTI/USD:
The WTI (West Texas Intermediate) chart currently exhibits a neutral bias, indicating a potential for price to fluctuate between the 1st resistance and the 1st support.
The 1st resistance level at 74.12 is identified as a pullback resistance that aligns with the 78.60% Fibonacci retracement level. Higher up, the 2nd resistance level at 74.91 is noted as a swing-high resistance, suggesting a potential barrier for further upside movement.
To the downside, the 1st support level at 71.04 is identified as a multi-swing-low support that aligns with the 61.80% Fibonacci projection level. Further below, the 2nd support level at 69.94 is marked as a swing-low support, further reinforcing its importance as a key support level.
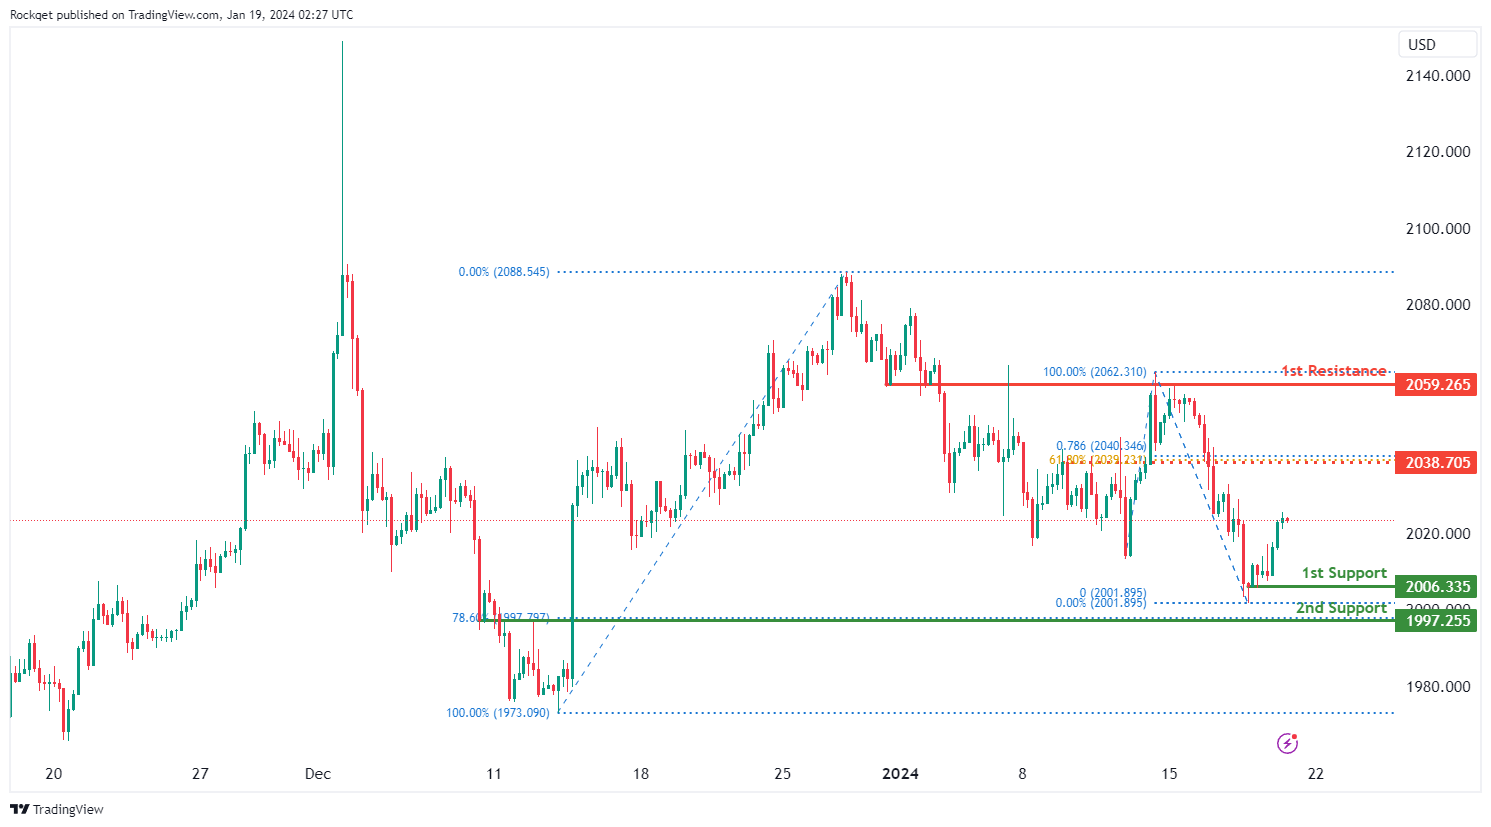
XAU/USD (GOLD):
The XAU/USD (Gold) chart currently exhibits an overall bearish momentum. However, there is a potential scenario for price to rise towards the intermediate resistance before resuming the downtrend.
The intermediate resistance level at 2,038.70 is identified as a pullback resistance that aligns with a confluence of Fibonacci levels i.e. the 61.80% retracement and the 78.60% projection. Higher up, the 1st resistance level at 2,059.26 is marked as an overlap resistance, indicating a significant potential resistance point.
On the support side, the 1st support level at 2,006.33 is identified as a pullback support. Further below, the 2nd support level at 1,997.25 is categorized as an overlap support that aligns with the 78.60% Fibonacci retracement level, further reinforcing its significance as a potential support zone.


