
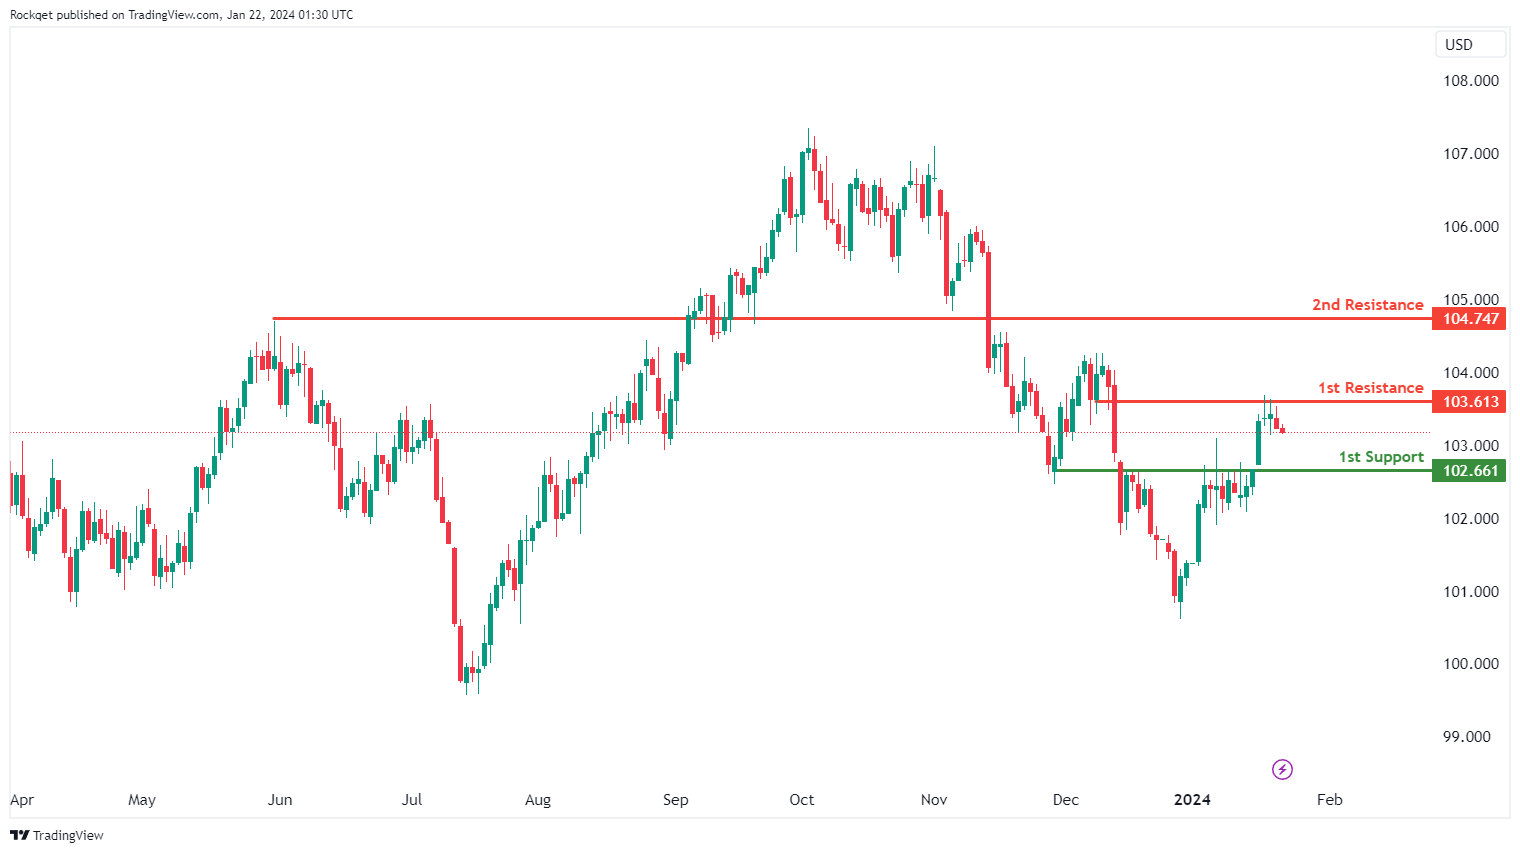
DXY:
The DXY (US Dollar Currency Index) chart is currently experiencing a bearish overall momentum, indicating weakness in the US Dollar. According to your analysis, there is potential for a bearish continuation towards the 1st support level.
The 1st support at 102.66 is considered a significant level of support due to its categorization as a pullback support. This implies that it may serve as an important area where the price could potentially find support during a bearish move.
On the resistance side, the 1st resistance at 103.61 is recognized as an overlap resistance, indicating that this price level has previously acted as both support and resistance. This historical significance makes it a potential barrier where selling pressure could emerge.
The 2nd resistance at 104.74 is identified as a pullback resistance, suggesting that it may serve as a significant resistance point during price pullbacks.
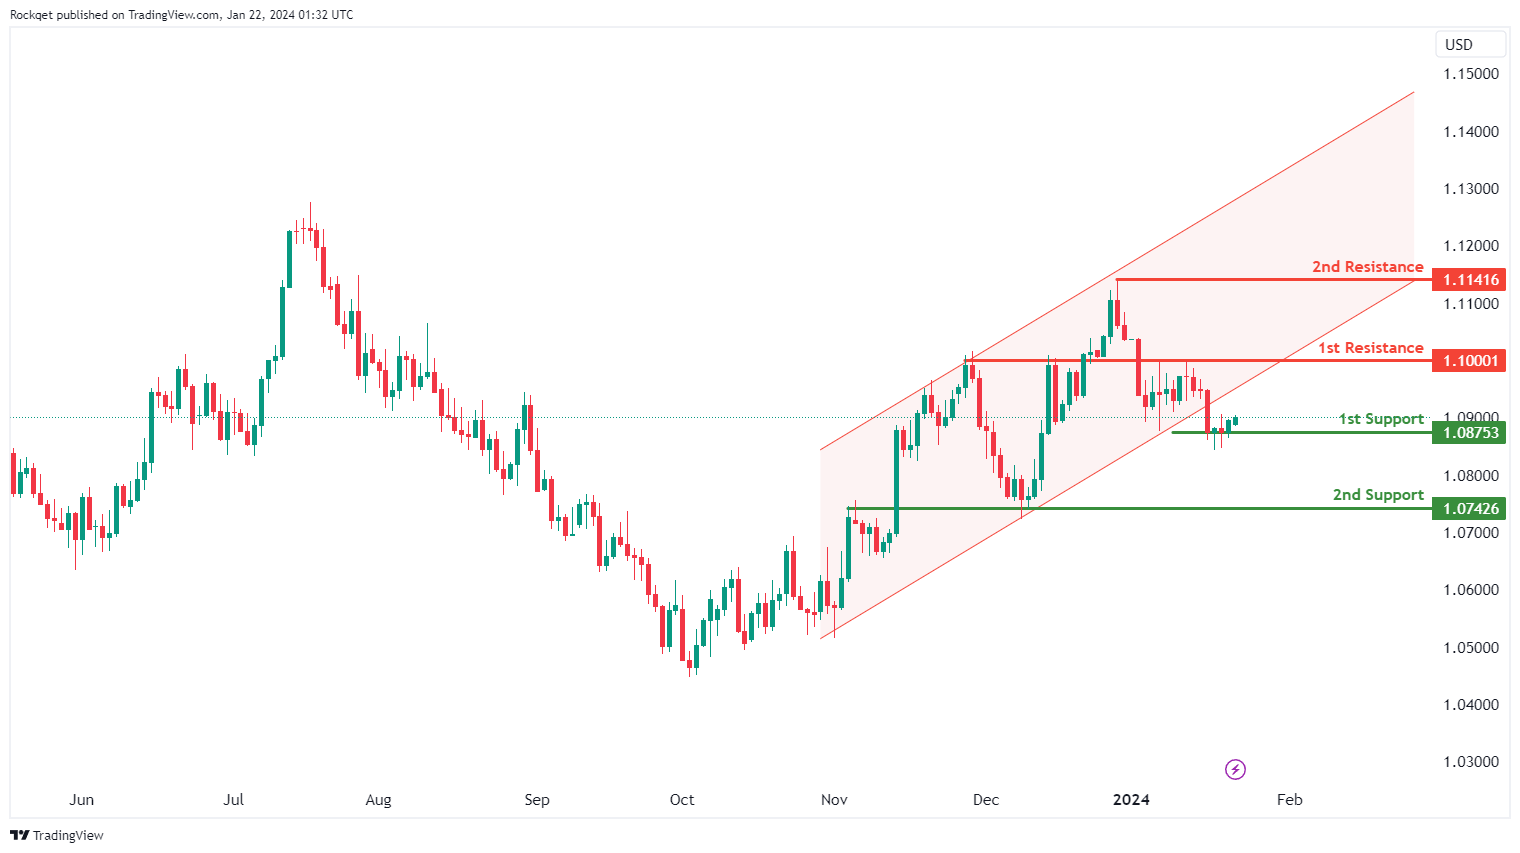
EUR/USD:
The EUR/USD trading pair is currently exhibiting a bearish overall momentum, with the momentum being driven by the observation that the price has broken below the lower channel line, which typically signifies a continuation of the prior bearish trend.
There is potential for a short-term rise in price towards the 1st resistance level before a reversal and a subsequent drop towards the 1st support level.
The 1st support level at 1.0875 is considered significant as it represents a multi-swing low support. This suggests that it has historically been a level where the price has found support during previous downtrends, making it a potential area of interest for buyers.
The 2nd support level at 1.0742 is identified as an overlap support, indicating that it has previously acted as both support and resistance. This historical significance reinforces its potential as a support level during price declines.
On the resistance side, the 1st resistance level at 1.1000 is recognized as an overlap resistance, implying that it has previously served as both support and resistance. This makes it a potential barrier where selling pressure may emerge.
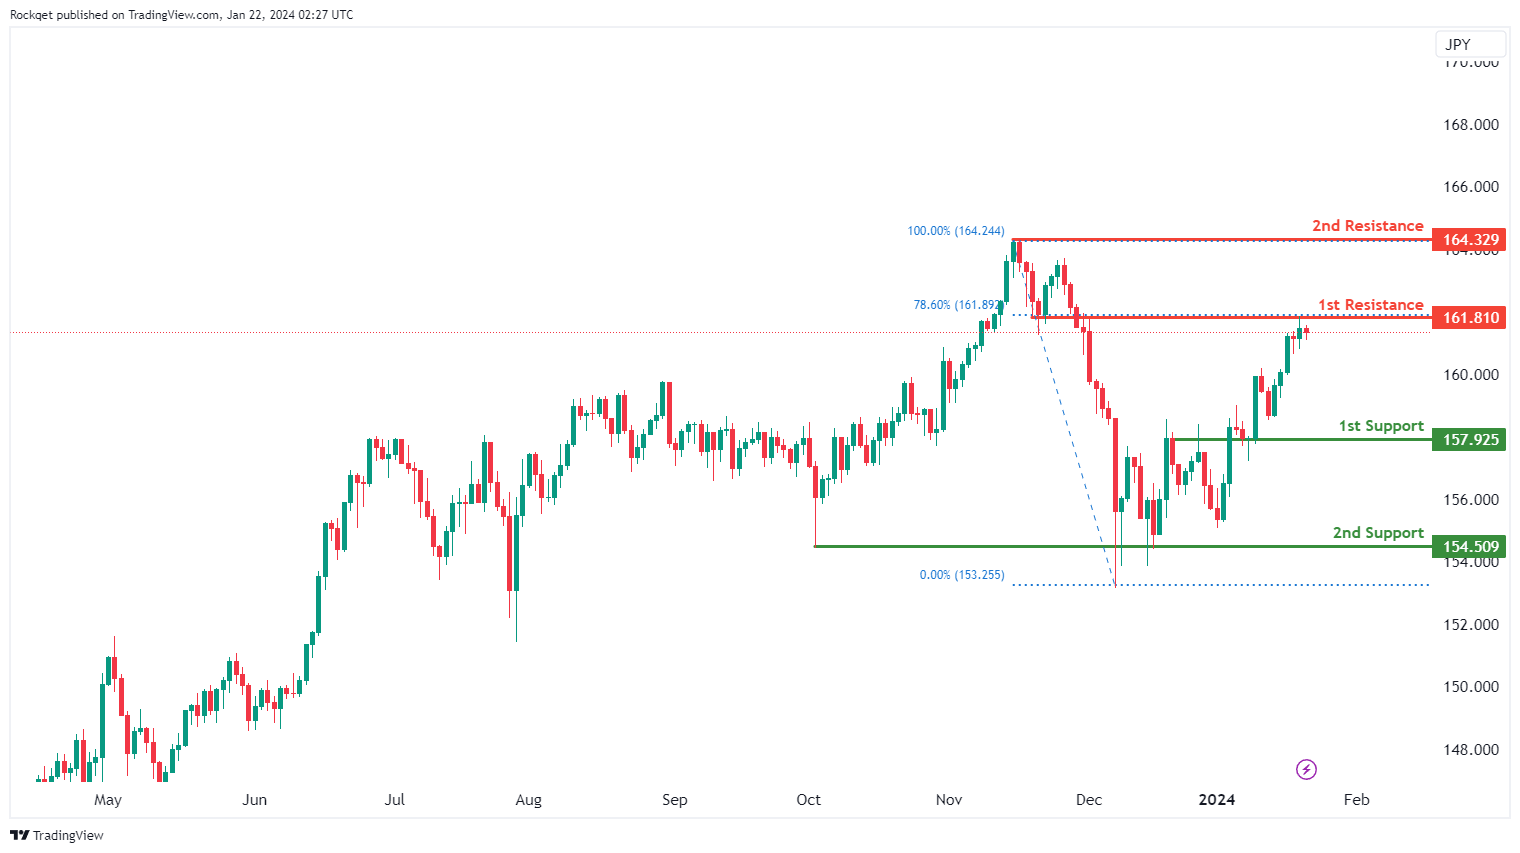
EUR/JPY:
The EUR/JPY trading pair is currently exhibiting a bearish overall momentum, indicating weakness in the Euro relative to the Japanese Yen. Your analysis suggests that there is potential for a bearish reaction off the 1st resistance level, leading to a drop towards the 1st support level.
The 1st support at 157.50 is considered a strong level of support due to its history as an overlap support, indicating that this price level has previously acted as both support and resistance. This suggests that it may be a significant area where price could find support during a bearish move.
The 2nd support at 152.50 is identified as a multi-swing low support, implying that this level corresponds to multiple previous significant low points on the chart. This reinforces its importance as a potential support level during price declines.
On the resistance side, the 1st resistance at 161.81 is recognized as an overlap resistance, and it also aligns with the 78.60% Fibonacci Retracement level. This confluence of factors suggests that it may serve as a strong resistance level, where selling pressure could potentially emerge.
The 2nd resistance at 164.32 is characterized as a swing high resistance, indicating its historical significance as a point where the price has encountered resistance and potential selling interest.
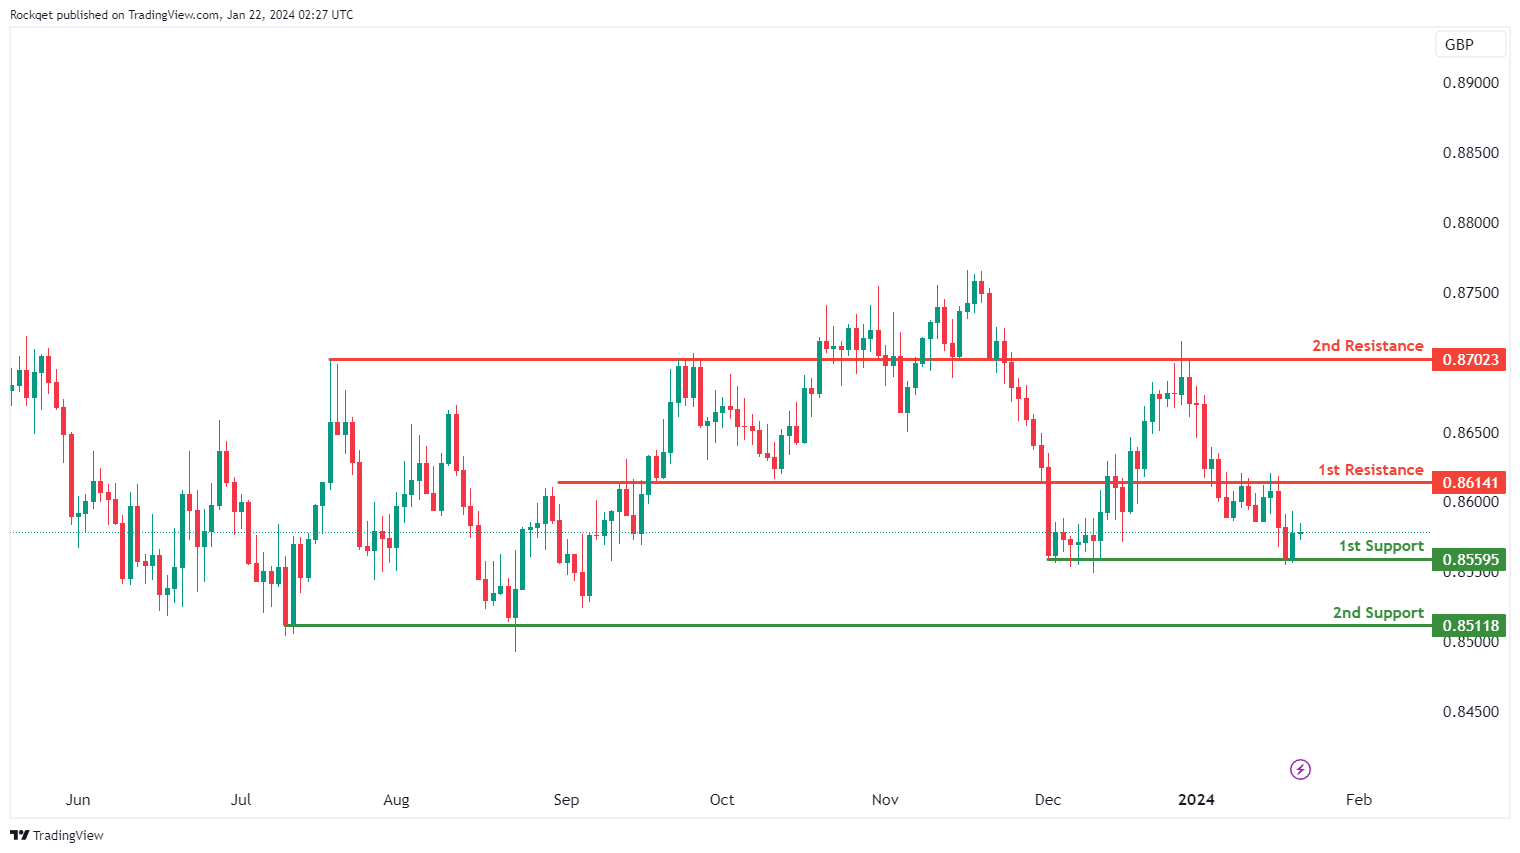
EUR/GBP:
The EUR/GBP trading pair is currently displaying a bullish overall momentum, indicating strength in the Euro relative to the British Pound. Your analysis suggests that there is potential for a bullish continuation towards the 1st resistance level.
The 1st support at 0.8559 is identified as a strong level of support due to its history as a multi-swing low support. This implies that this level corresponds to multiple previous significant low points on the chart, reinforcing its significance as a potential support level during price pullbacks.
Similarly, the 2nd support at 0.8511 is also categorized as a multi-swing low support, indicating its importance as another level where the price has found support in the past.
On the resistance side, the 1st resistance at 0.8614 is recognized as an overlap resistance, suggesting that this price level has previously acted as both support and resistance. This makes it a potentially strong resistance level where selling pressure could emerge.
The 2nd resistance at 0.8702 is also identified as an overlap resistance, further emphasizing its historical significance as a potential barrier for further upward price movement.
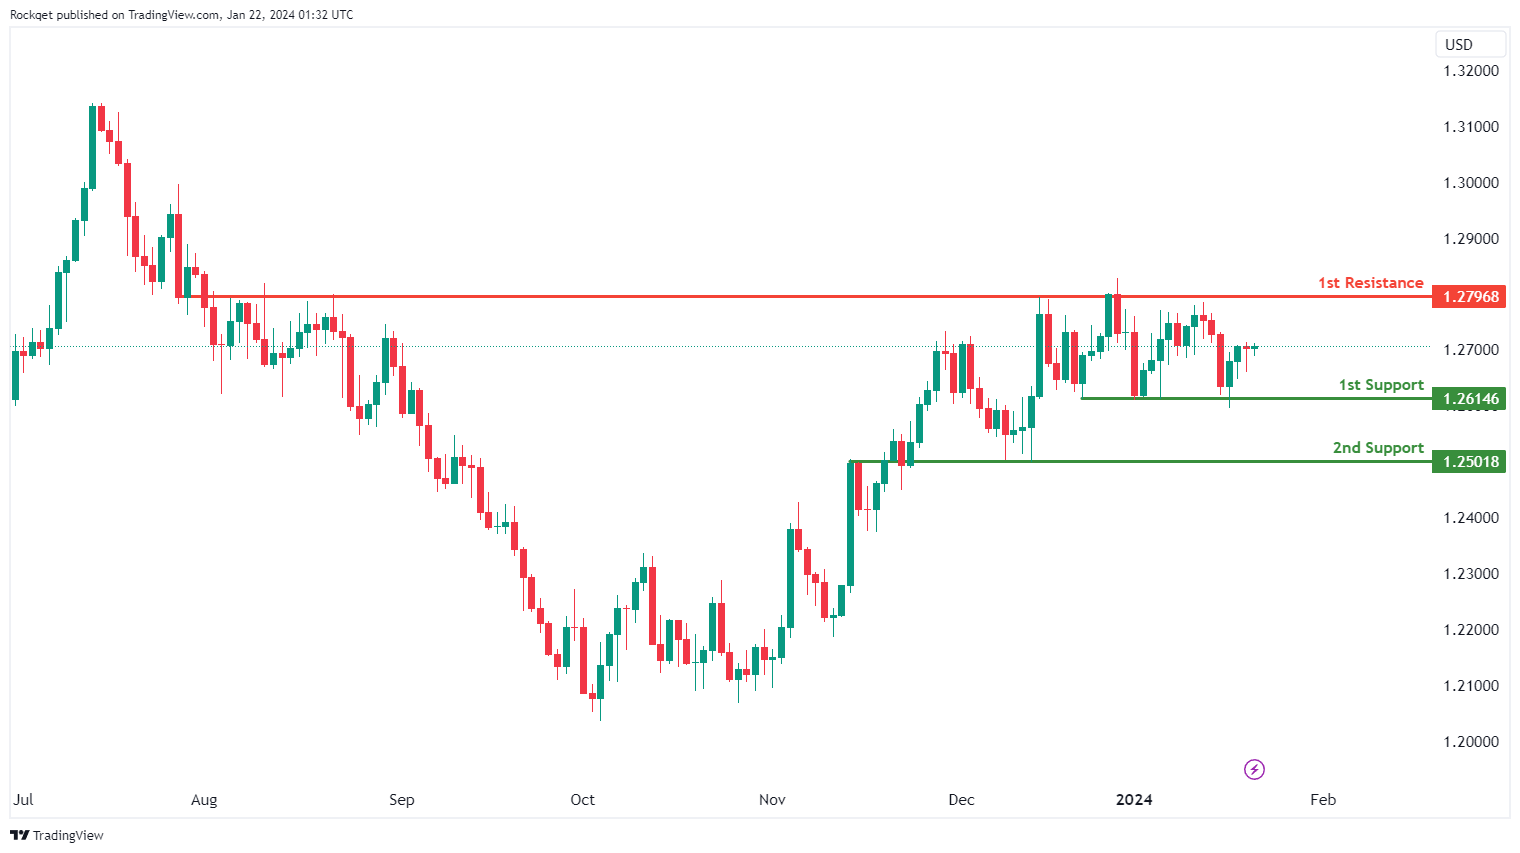
GBP/USD:
The GBP/USD trading pair currently has a neutral overall momentum, indicating a lack of a strong directional bias in the market. The analysis suggests that price may potentially fluctuate between the 1st resistance and the 1st support level.
The 1st support level at 1.2614 is considered significant as it represents a multi-swing low support. This suggests that it has historically been a level where the price has found support during previous fluctuations, making it a potential area of interest for buyers.
The 2nd support level at 1.2501 is identified as an overlap support, indicating that it has previously acted as both support and resistance. This historical significance reinforces its potential as a support level during price fluctuations.
On the resistance side, the 1st resistance level at 1.2796 is recognized as an overlap resistance, implying that it has previously served as both support and resistance. This makes it a potential barrier where selling pressure may emerge.
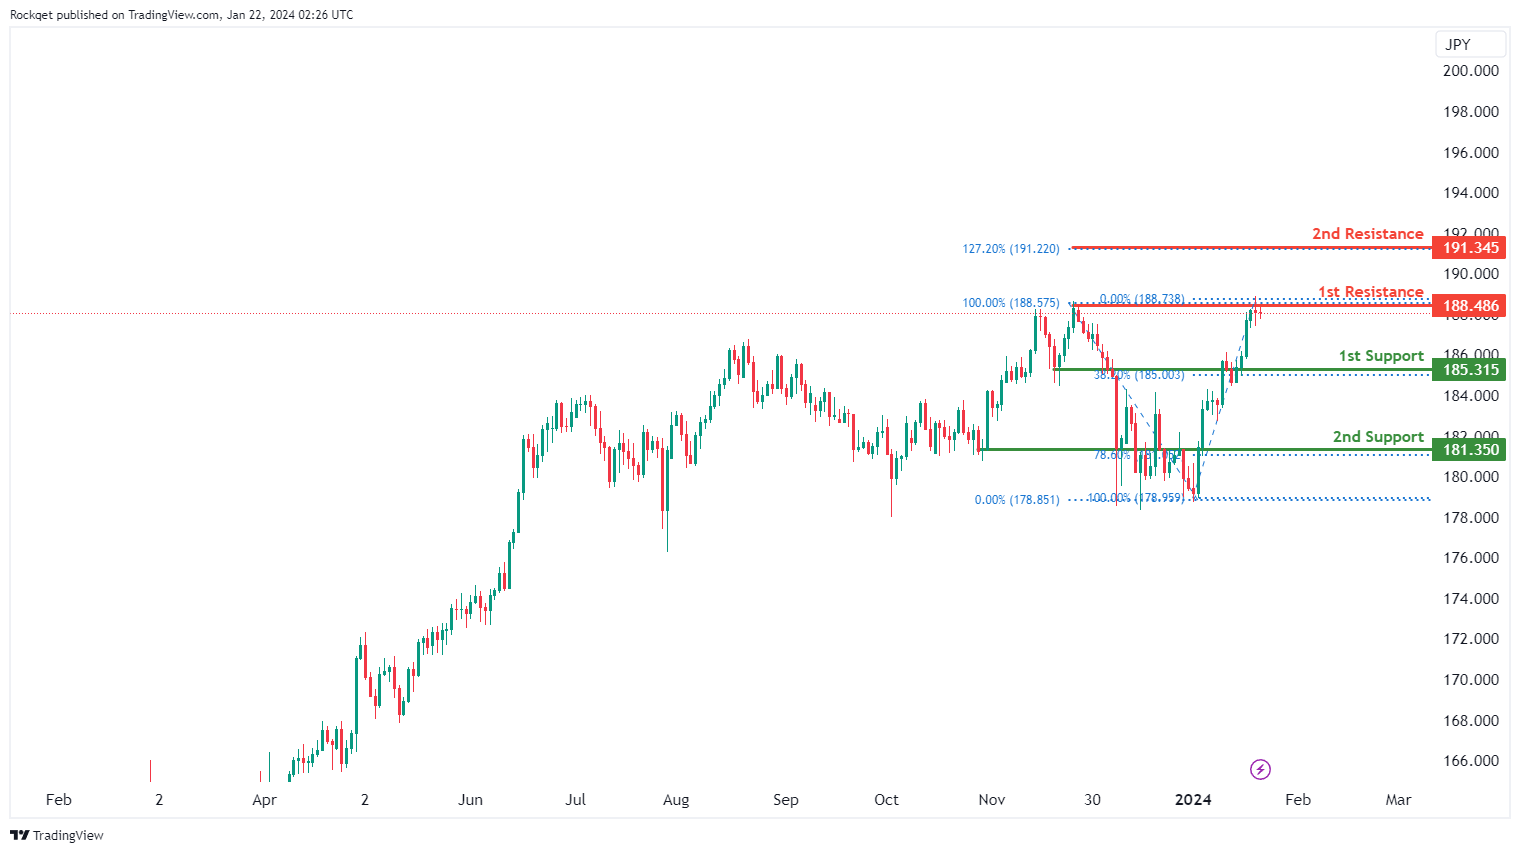
GBP/JPY:
The GBP/JPY trading instrument is currently showing a bearish overall momentum, indicating weakness in the British Pound relative to the Japanese Yen. The analysis suggests that there’s a potential for a bearish continuation towards the 1st support level.
The 1st support at 185.31 is considered a strong level of support for several reasons. It is identified as a pullback support and coincides with the 38.20% Fibonacci Retracement level. This confluence of factors suggests that it may serve as a significant area where interest could emerge, providing temporary support for GBP/JPY during a bearish move.
The 2nd support at 181.35 is also categorized as a pullback support and aligns with the 78.60% Fibonacci Retracement level. This level, too, carries importance and may act as a strong support zone during price pullbacks.
On the resistance side, the 1st resistance at 188.48 is recognized as a swing high resistance, indicating that it has historically served as a point of resistance where selling pressure may emerge.
The 2nd resistance at 191.34 is identified as the 127.20% Fibonacci Extension level. This level may act as a significant barrier for further upward price movement, as Fibonacci Extension levels are often used to id
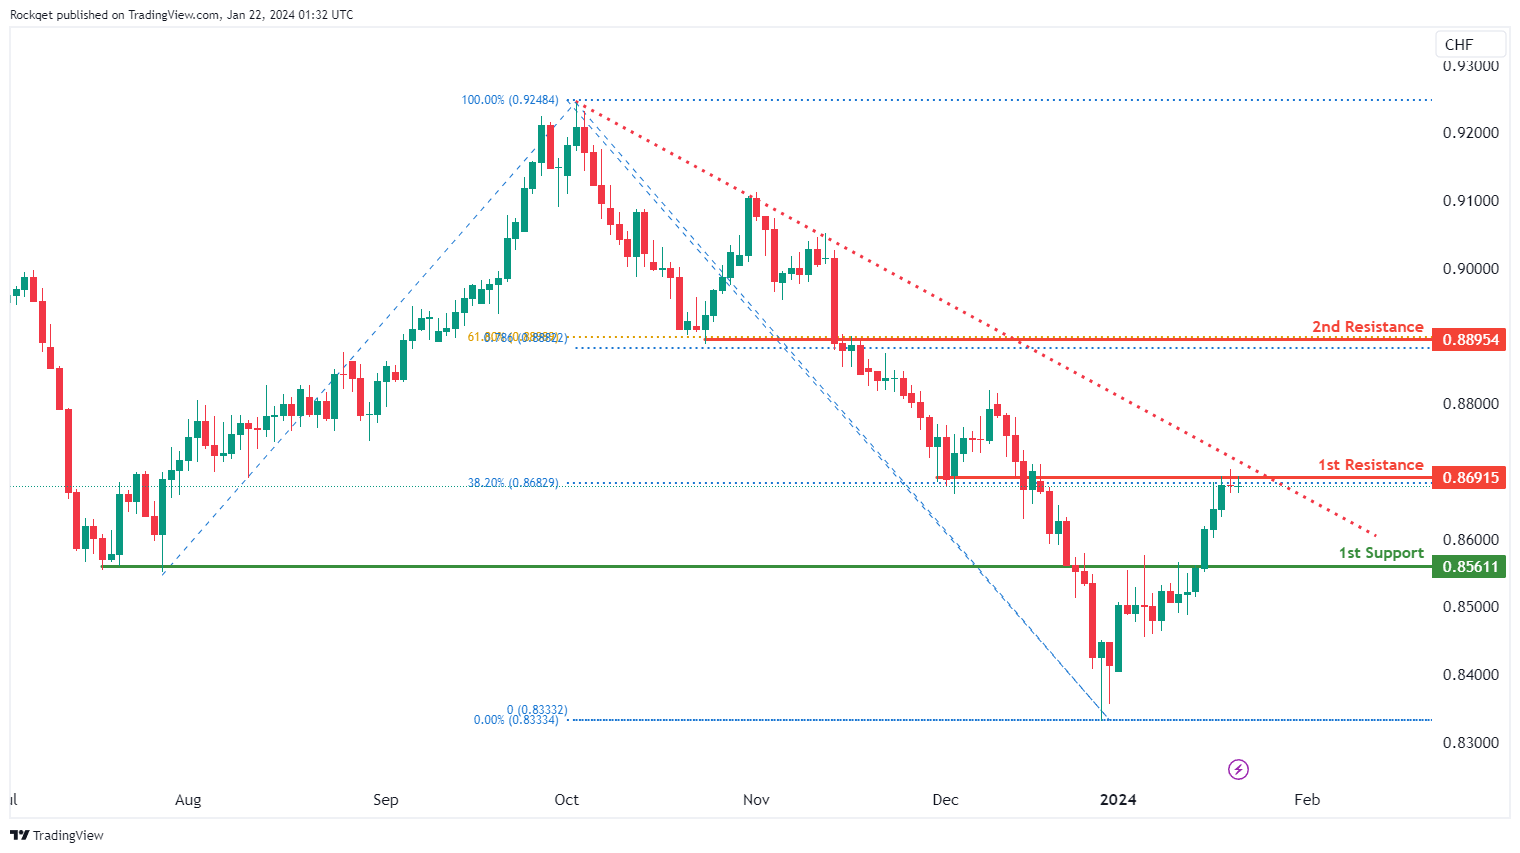
USD/CHF:
The USD/CHF chart currently exhibits a bearish overall momentum, with factors contributing to this momentum being the price’s position below a major descending trend line. This suggests that bearish momentum is prevalent in the market.
Price could potentially make a bearish reaction off the 1st resistance and drop towards the 1st support.
1st support at 0.8561 is identified as pullback support, indicating a potential area where buying interest may emerge, providing temporary support for USD/CHF.
On the resistance side, 1st resistance at 0.8691 is marked as an overlap resistance, which may act as a barrier for further upward price movement.
2nd resistance at 0.8895 is categorized as an overlap resistance, and it holds significance due to the confluence of the 61.80% Fibonacci Retracement and the 78.60% Fibonacci Projection.
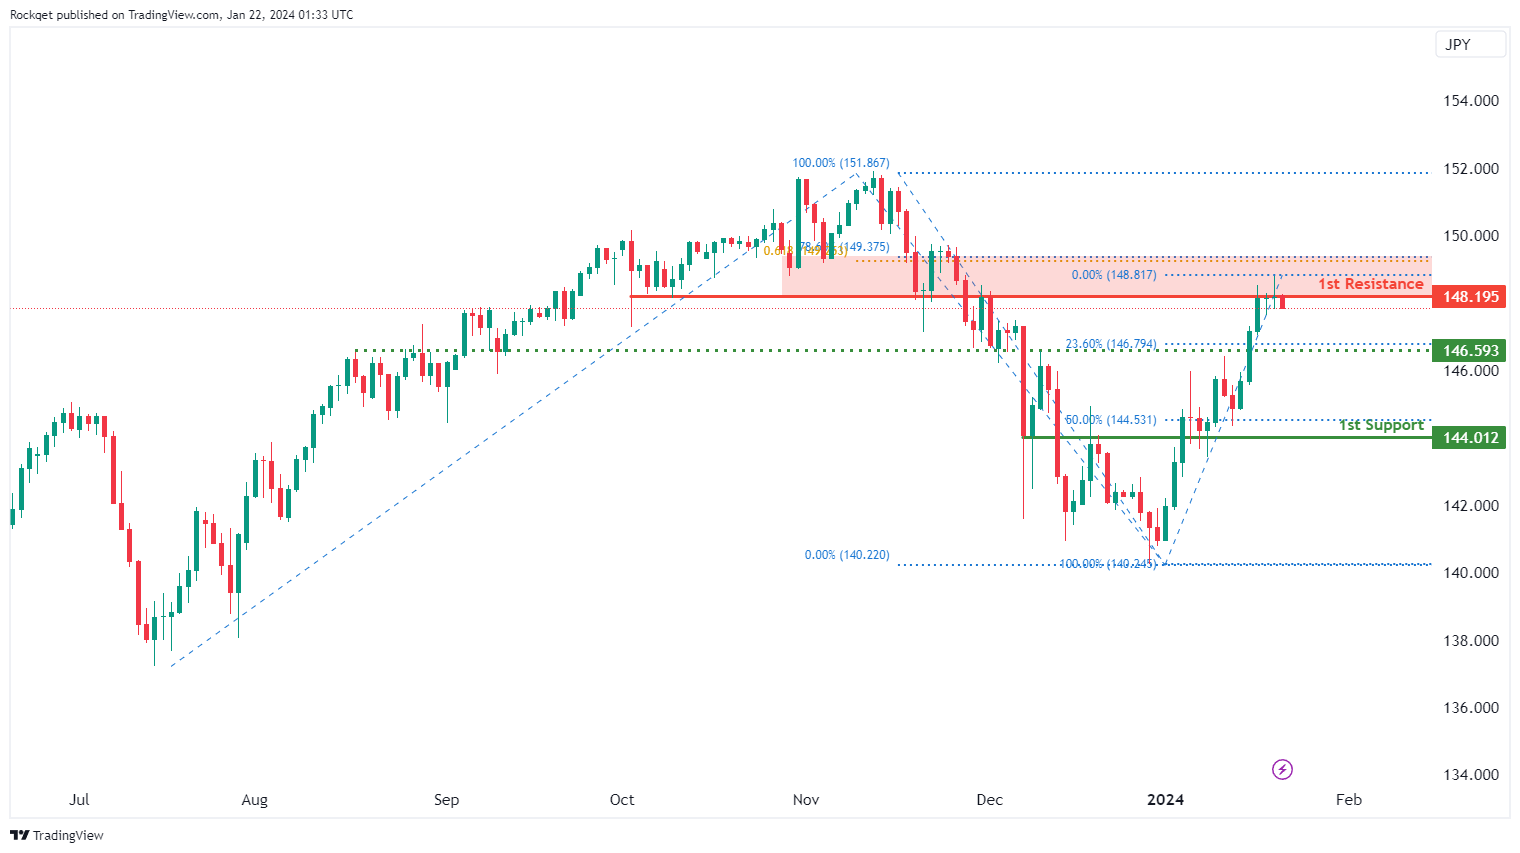
USD/JPY:
The USD/JPY chart currently exhibits a bearish overall momentum. Price could potentially make a bearish continuation towards the 1st support and the identified support and resistance levels are as follows:
1st support at 144.01 is an overlap support and aligns with the 50% Fibonacci Retracement level. This level is significant as it suggests a potential area where buying interest may emerge, providing temporary support for USD/JPY.
Intermediate support at 146.59 is categorized as a pullback support and is reinforced by the 23.60% Fibonacci Retracement, further adding to its significance as a potential support zone.
On the resistance side, 1st resistance at 148.19 is marked as an overlap resistance, and it may act as a barrier for the price if it attempts to move higher.
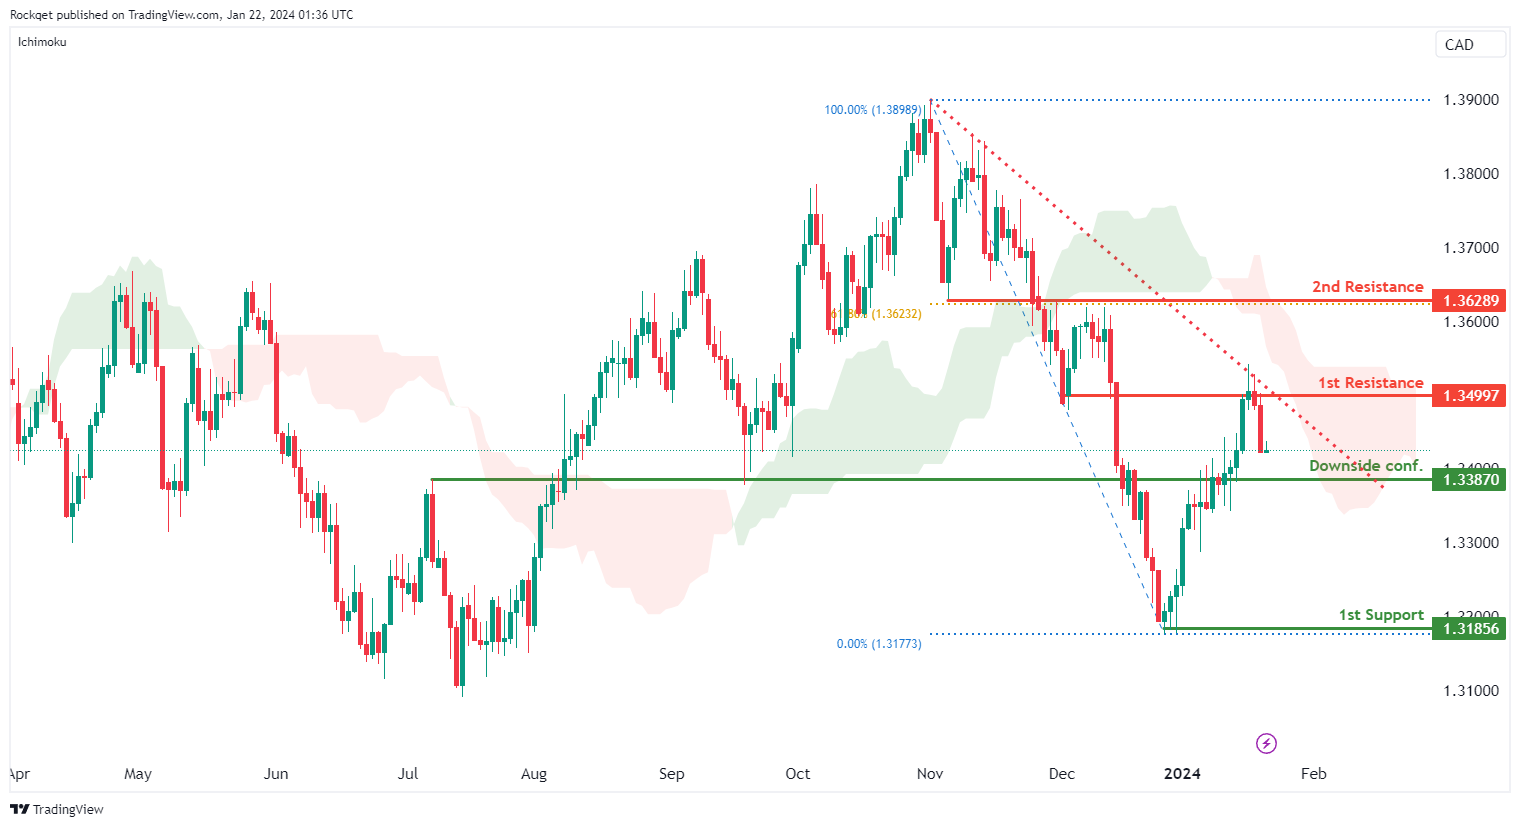
USD/CAD:
The USD/CAD chart currently exhibits an overall bearish momentum. Factors such as the descending trendline and the bearish Ichimoku Cloud are contributing to this bearish outlook. In this context, there is a potential scenario for price to drop towards the 1st support should it break the Downside Confirmation level.
The Downside Confirmation level at 1.3387 is identified as an overlap support. Further below, the 1st support level at 1.3185 is marked as a swing-low support, further reinforcing its importance as a key support level.
To the upside, the 1st resistance level at 1.3499 is identified as an overlap resistance. Higher up, the 2nd resistance level at 1.3628 is also noted as an overlap resistance that aligns with the 61.80% Fibonacci retracement level, further reinforcing its significance as a potential resistance zone.
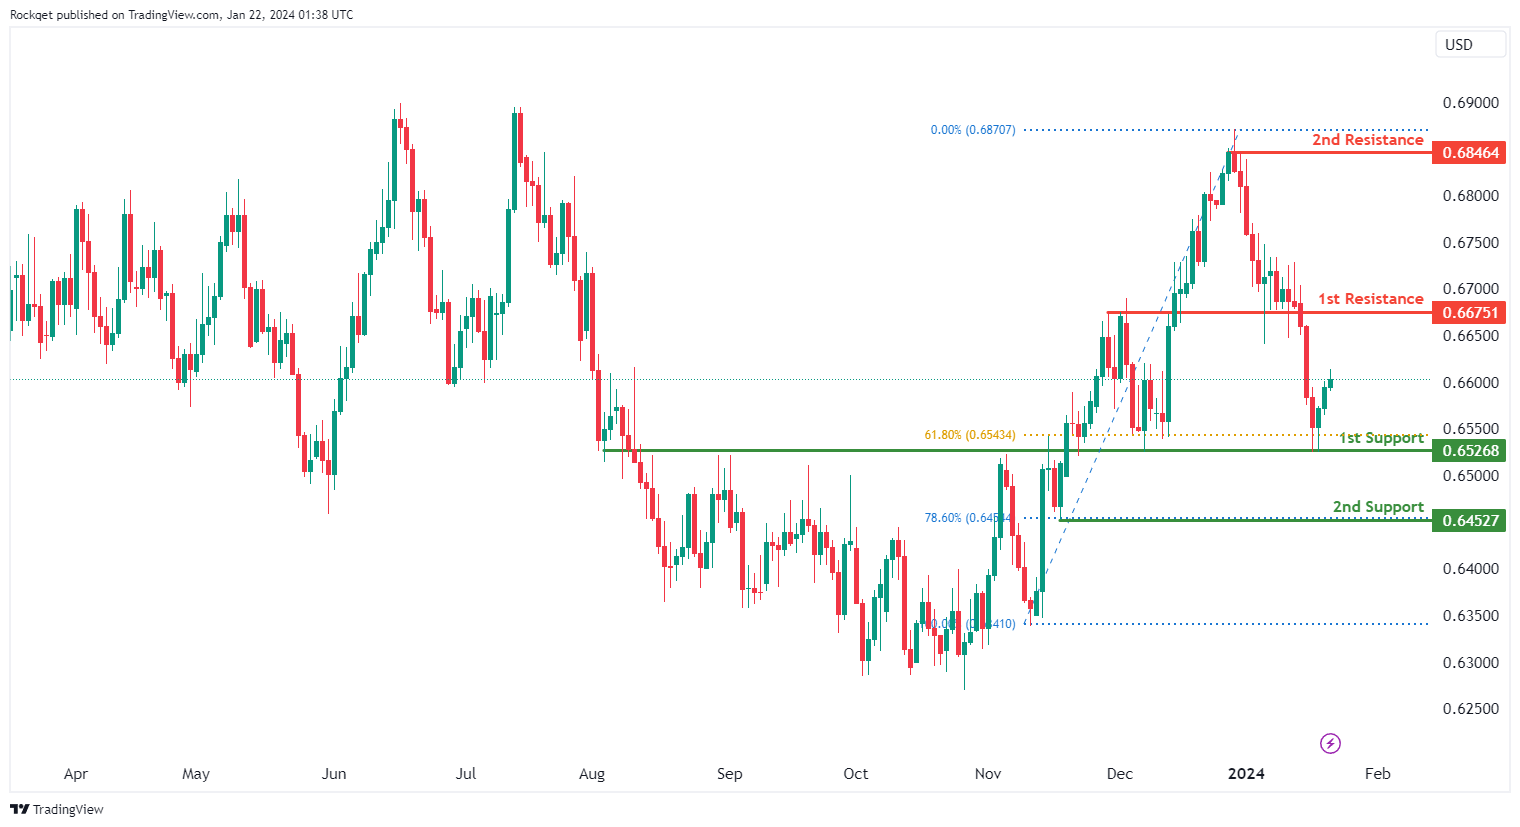
AUD/USD:
The AUD/USD chart currently exhibits an overall bullish momentum. In this context, there is a potential scenario for price to rise towards the 1st resistance.
The 1st resistance level at 0.6675 is identified as an overlap resistance. Higher up, the 2nd resistance level at 0.6846 is noted as a swing-high resistance, suggesting a potential barrier for further upside movement.
To the downside, the 1st support level at 0.6526 is identified as an overlap support that aligns close to the 61.80% Fibonacci retracement level. Further below, the 2nd support level at 0.6452 is marked as a pullback support that aligns with the 78.60% Fibonacci retracement level, further reinforcing its importance as a key support level.
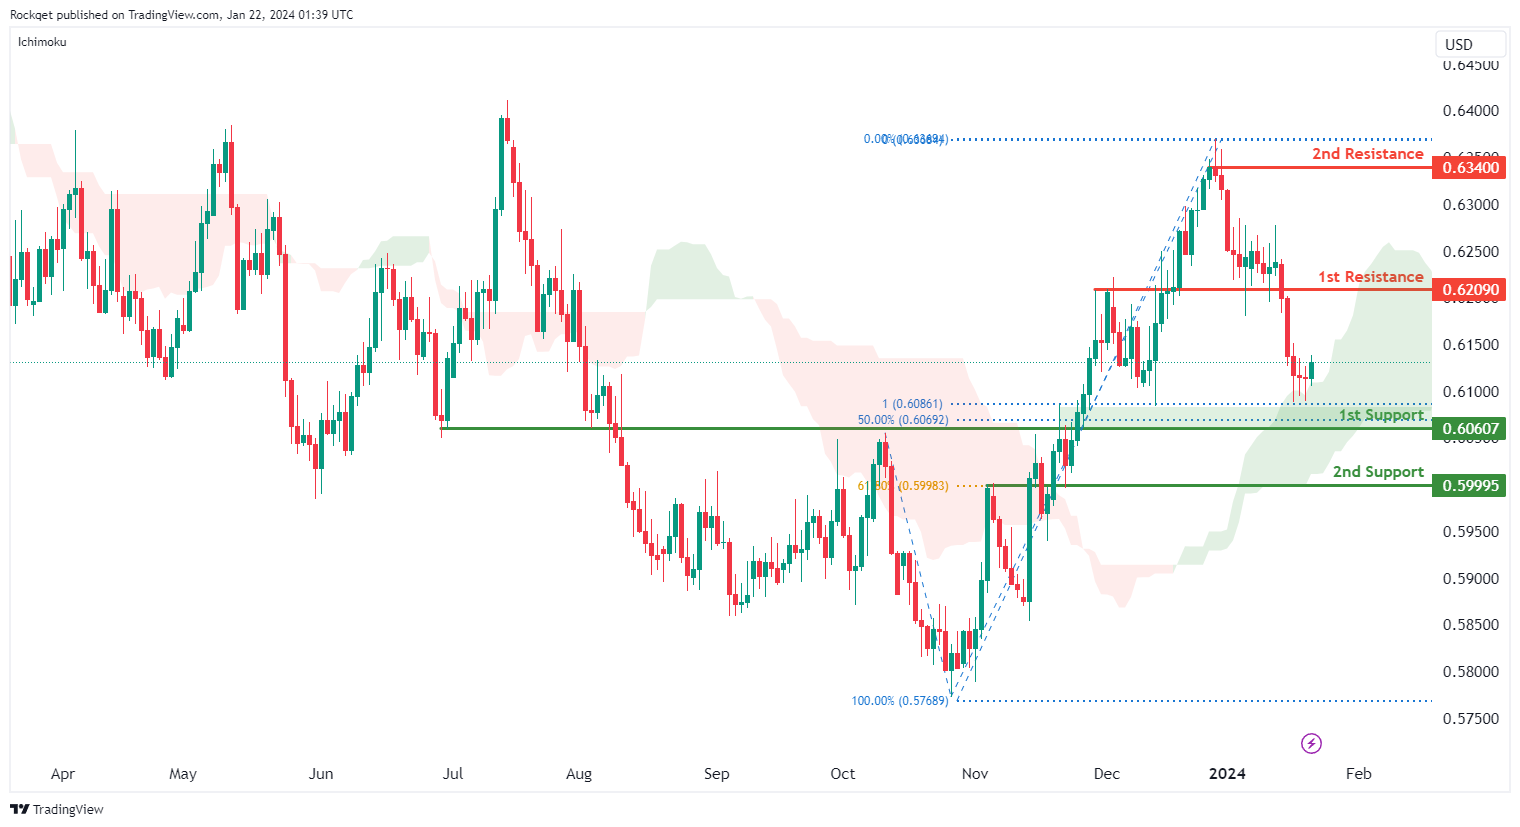
NZD/USD
The NZD/USD chart currently exhibits an overall bullish momentum with price finding support just above the bullish Ichimoku Cloud. In this context, there is a potential scenario for price to rise towards the 1st resistance.
The 1st resistance level at 0.6209 is identified as an overlap resistance. Higher up, the 2nd resistance level at 0.6340 is noted as a swing-high resistance, suggesting a potential barrier for further upside movement.
To the downside, the 1st support level at 0.6060 is identified as an overlap support that aligns with a confluence of Fibonacci levels i.e. the 50.00% retracement and the 100.00% projection. Further below, the 2nd support level at 0.5999 is also marked as an overlap support that aligns with the 61.80% Fibonacci retracement level, further reinforcing its importance as a key support level.
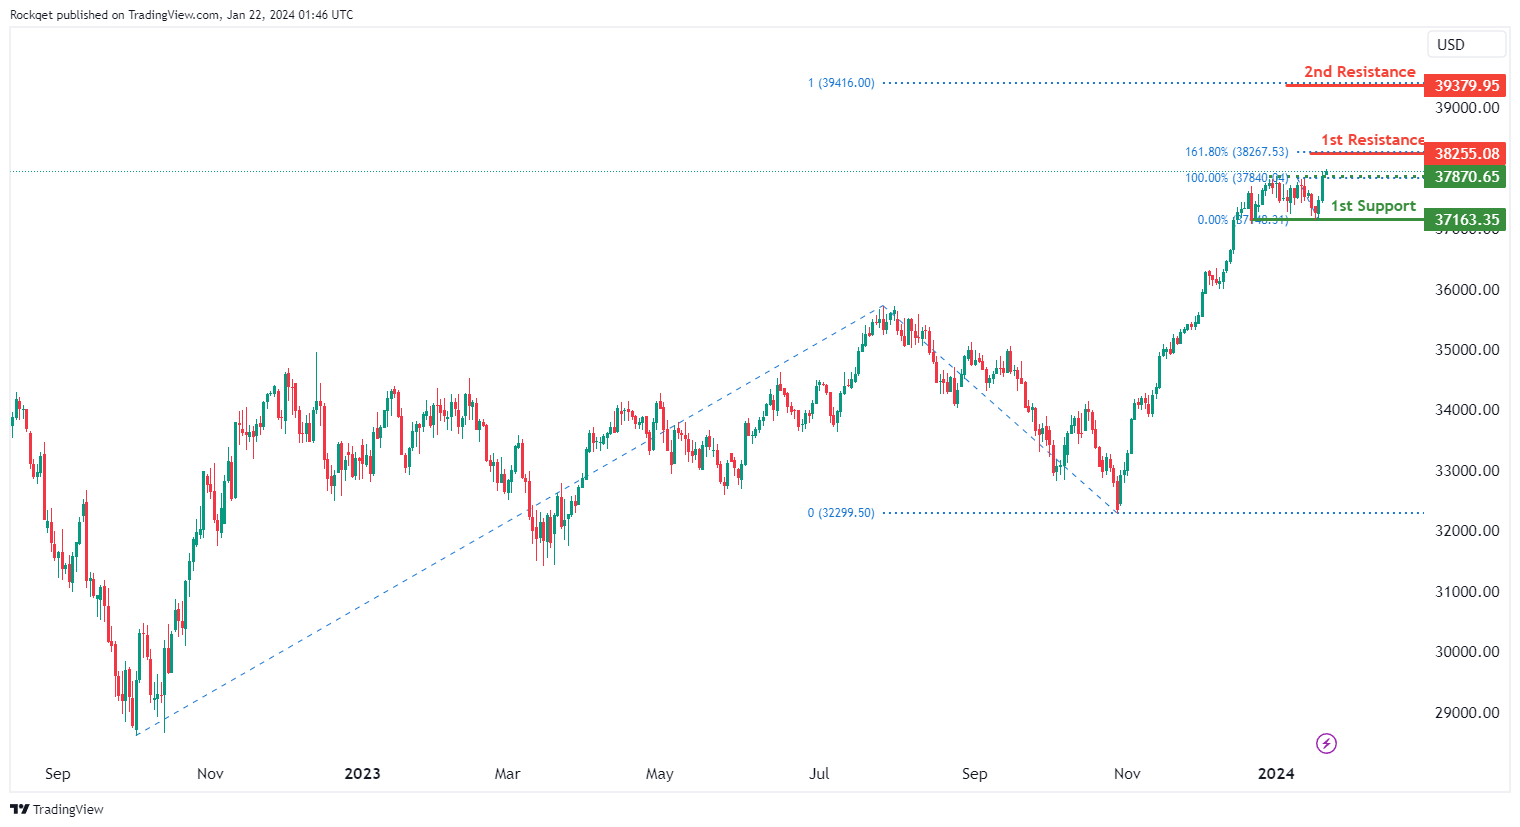
DJ30:
The DJ30 (Dow Jones) chart currently exhibits an overall bullish momentum. In this context, there is a potential scenario for price to rise towards the 1st resistance.
The 1st resistance level at 38,255.08 is identified as a resistance that aligns with the 161.80% Fibonacci extension level. Higher up, the 2nd resistance level at 39,379.95 is noted as a resistance that aligns with the 100.00% Fibonacci projection level, suggesting a potential barrier for further upside movement.
To the downside, the intermediate support level at 37,870.65 is identified as pullback support. Further below, the 1st support level at 37,163.35 is also marked as a pullback support, further reinforcing its importance as a key support level.
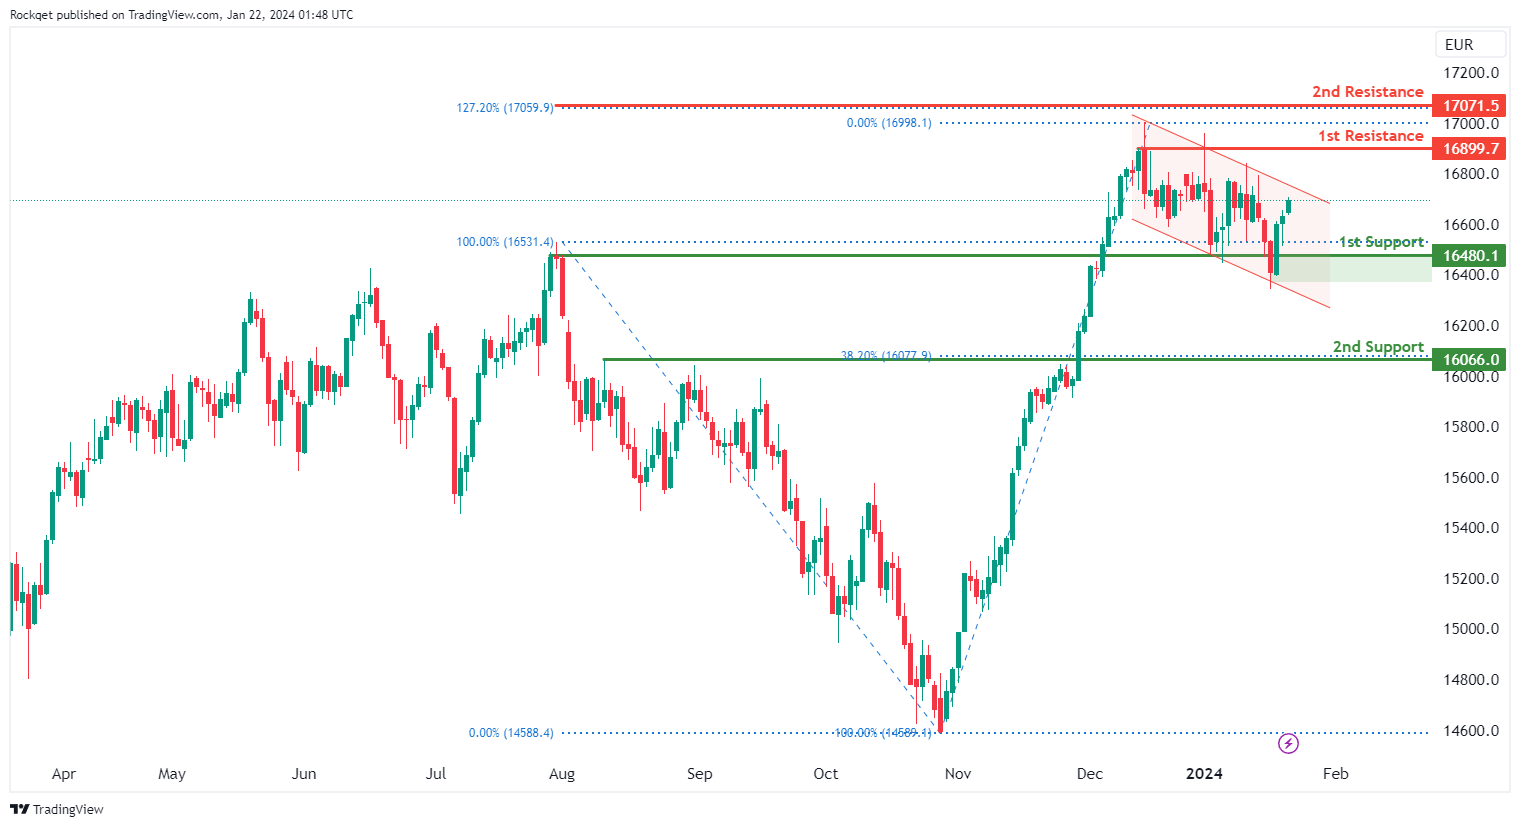
GER40:
The GER40 (DAX) chart currently exhibits an overall bullish momentum. In this context, there is a potential scenario for price to rise towards the 1st resistance. However, take note that price is also trading within a bearish channel.
The 1st resistance level at 16,899.70 is identified as a pullback resistance. Higher up, the 2nd resistance level at 17,071.50 is noted as a resistance that aligns with the 127.20% Fibonacci extension level, further reinforcing its significance as a potential resistance zone.
To the downside, the 1st support level at 16,480.10 is identified as an overlap support. Further below, the 2nd support level at 16,066.00 is noted as a pullback support that aligns with the 38.20% Fibonacci retracement level, further reinforcing its importance as a key support level.
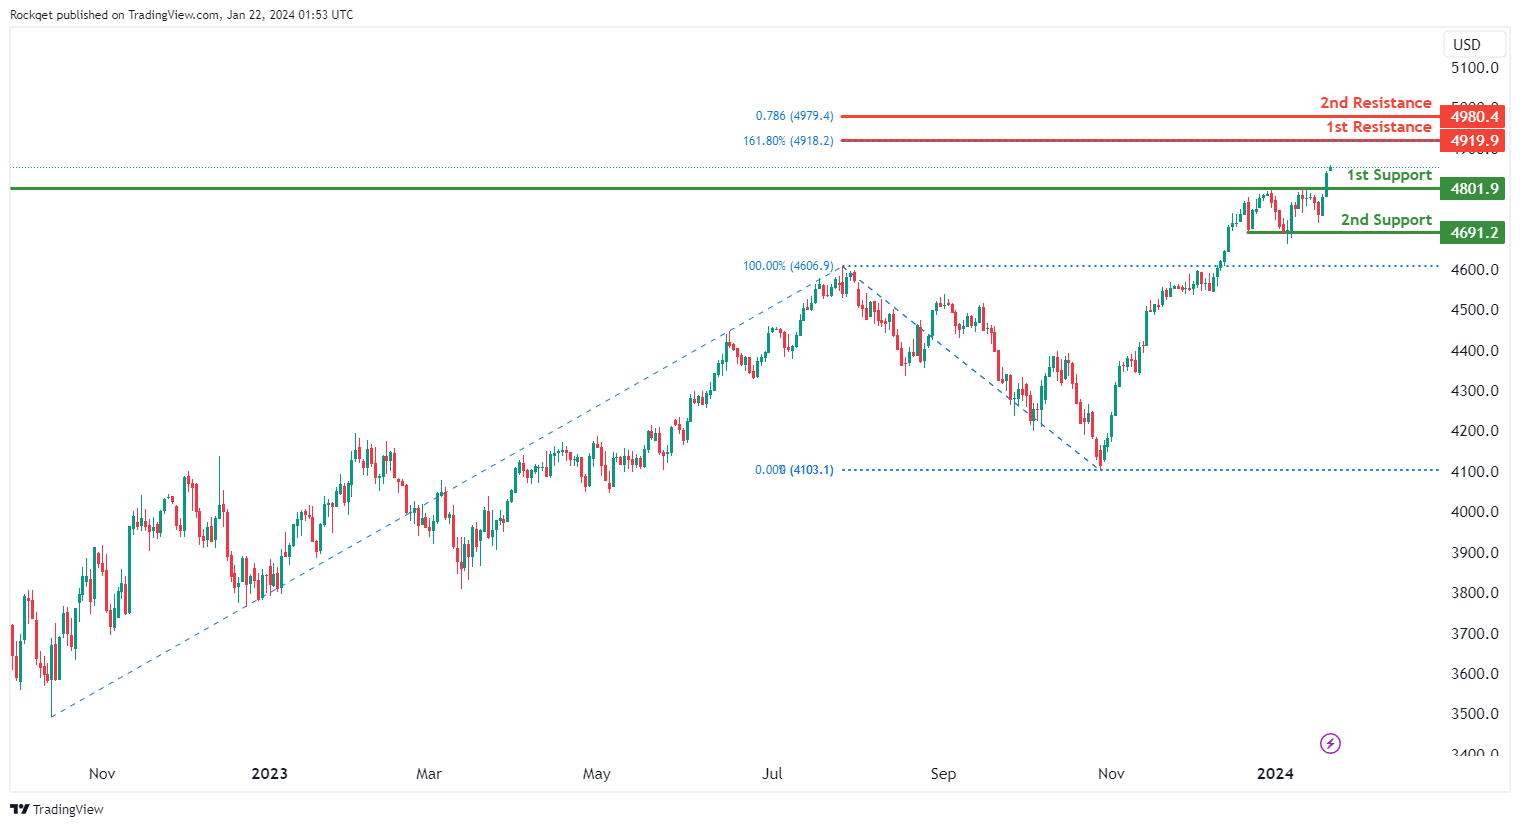
 US500:
The US500 (S&P 500) chart currently exhibits an overall bullish momentum. In this context, there is a potential scenario for price to rise towards the 1st resistance.
The 1st resistance level at 4,919.90 is identified as a resistance that aligns with the 161.80% Fibonacci extension level. Higher up, the 2nd resistance level at 4,980.40 is noted as a resistance that aligns with the 78.60% Fibonacci projection level, further reinforcing its significance as a potential resistance zone.
To the downside, the 1st support level at 4,801.90 is identified as a pullback support. Further below, the 2nd support level at 4,691.20 is also noted as a pullback support, further reinforcing its importance as a key support level.
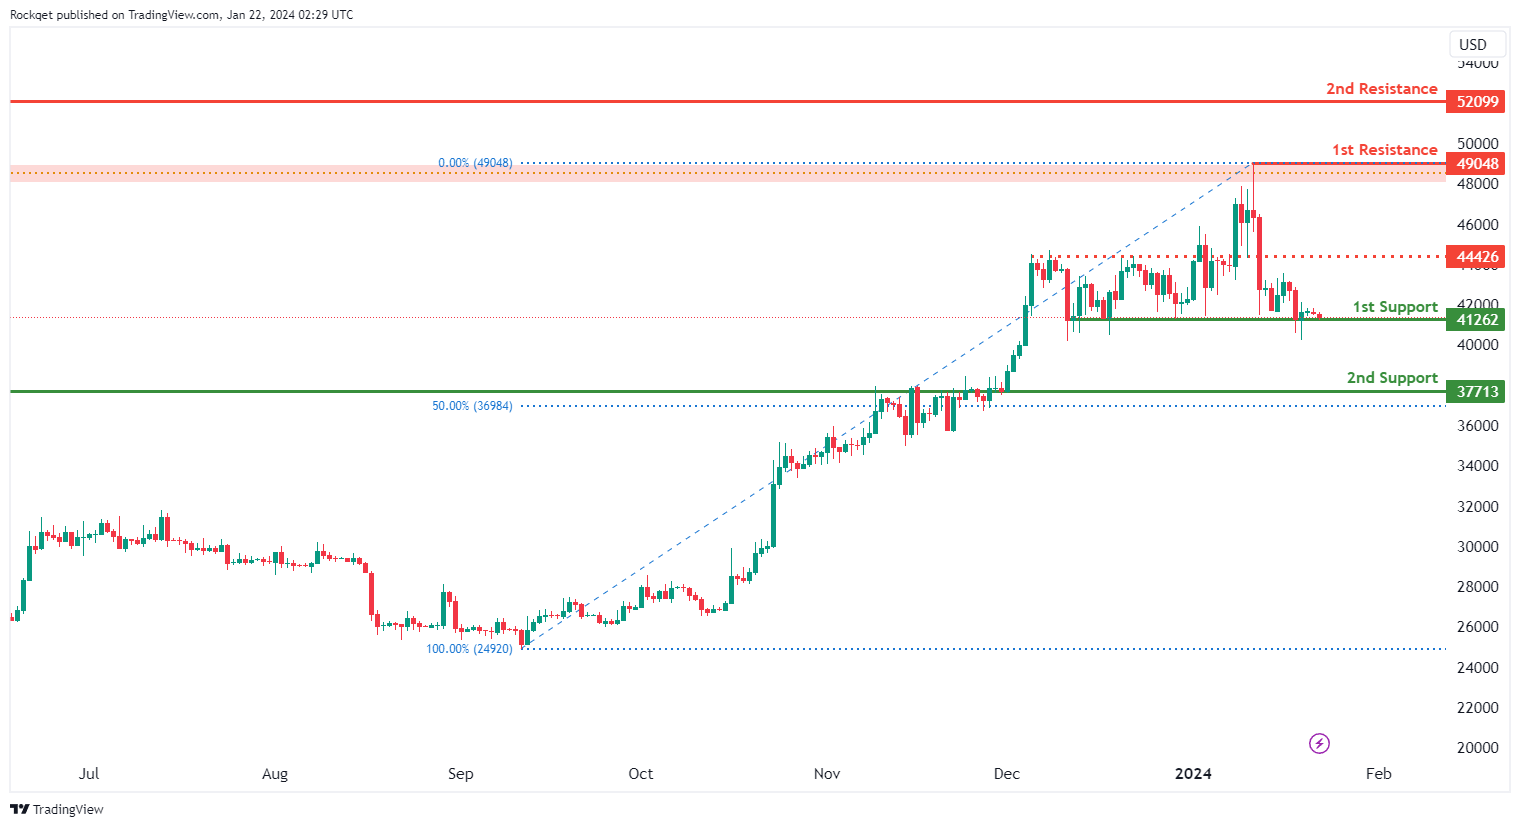
BTC/USD:
The BTC/USD (Bitcoin) chart currently exhibits an overall bullish momentum. However, there is a potential scenario for price to fall towards the 1st support before making a bullish bounce to resume the uptrend.
The 1st support level at 41,262.00 is identified as a pullback support. Further below, the 2nd support level at 37,713.00 is marked as an overlap support that aligns close to the 50.00% Fibonacci retracement level, further reinforcing its importance as a key support level.
To the upside, the intermediate resistance level at 44,426.00 is identified as an overlap resistance while the 1st resistance level at 49,048.00 is marked as a swing-high resistance that aligns close to the 61.80% Fibonacci retracement level. Higher up, the 2nd resistance level at 52,099.00 is also noted as a swing-high resistance, suggesting a potential barrier for further upside movement.
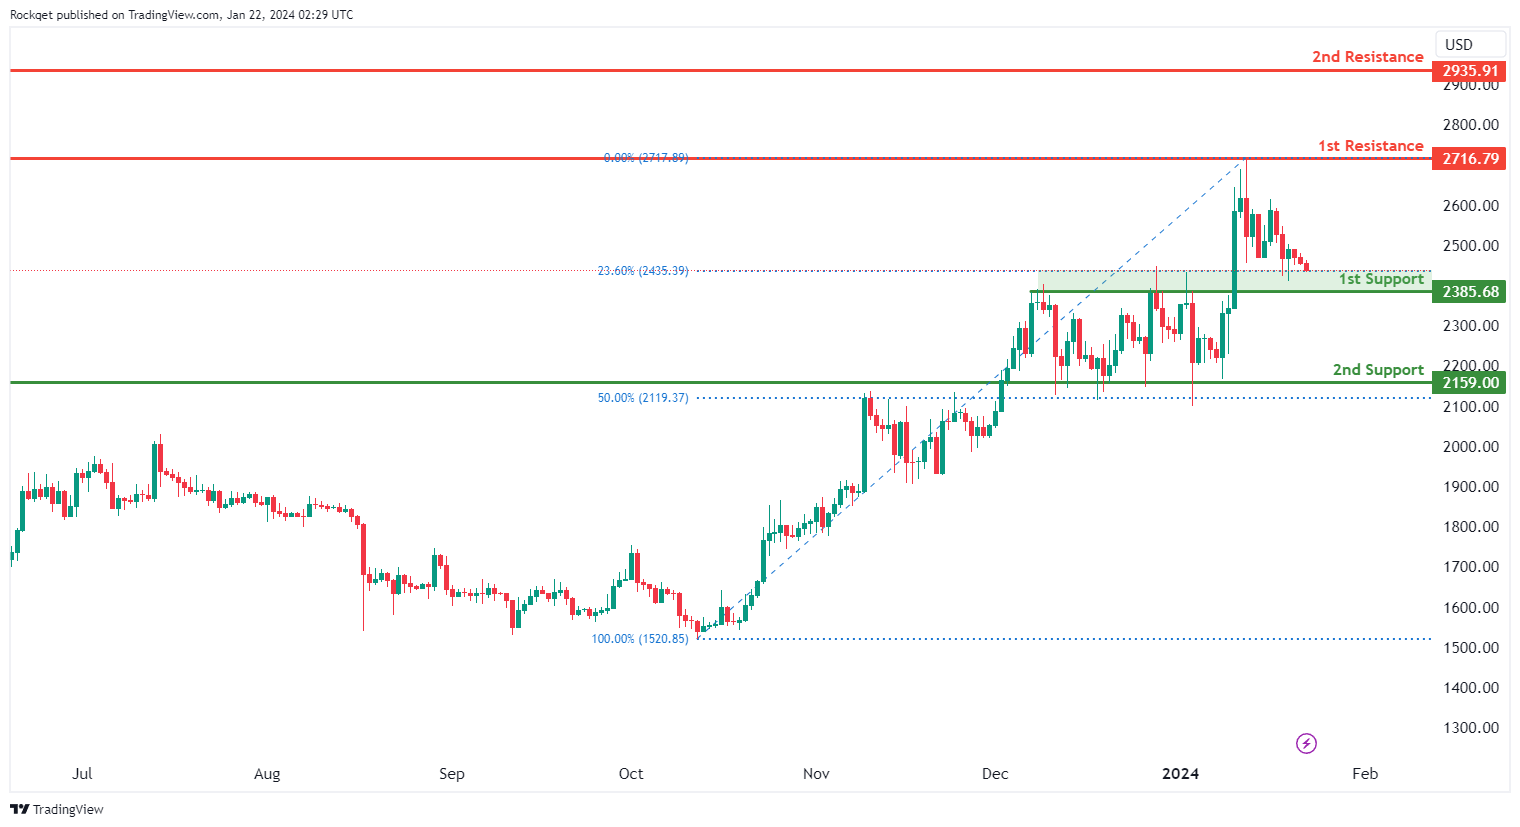
ETH/USD:
The ETH/USD (Ethereum) chart currently exhibits an overall bearish momentum. However, there is a potential scenario for price to fall towards the 1st support before making a bullish bounce to resume the uptrend.
The 1st support level at 2,385.68 is identified as a pullback support that aligns close to the 23.60% Fibonacci retracement level. Further below, the 2nd support level at 2,159.00 is marked as an overlap support that aligns close to the 50.00% Fibonacci retracement level, further reinforcing its importance as a key support level.
To the upside, the 1st resistance level at 2,716.79 is identified as an overlap resistance. Higher up, the 2nd resistance level at 2,935.91 is noted as a pullback resistance, suggesting a potential barrier for further upside movement.
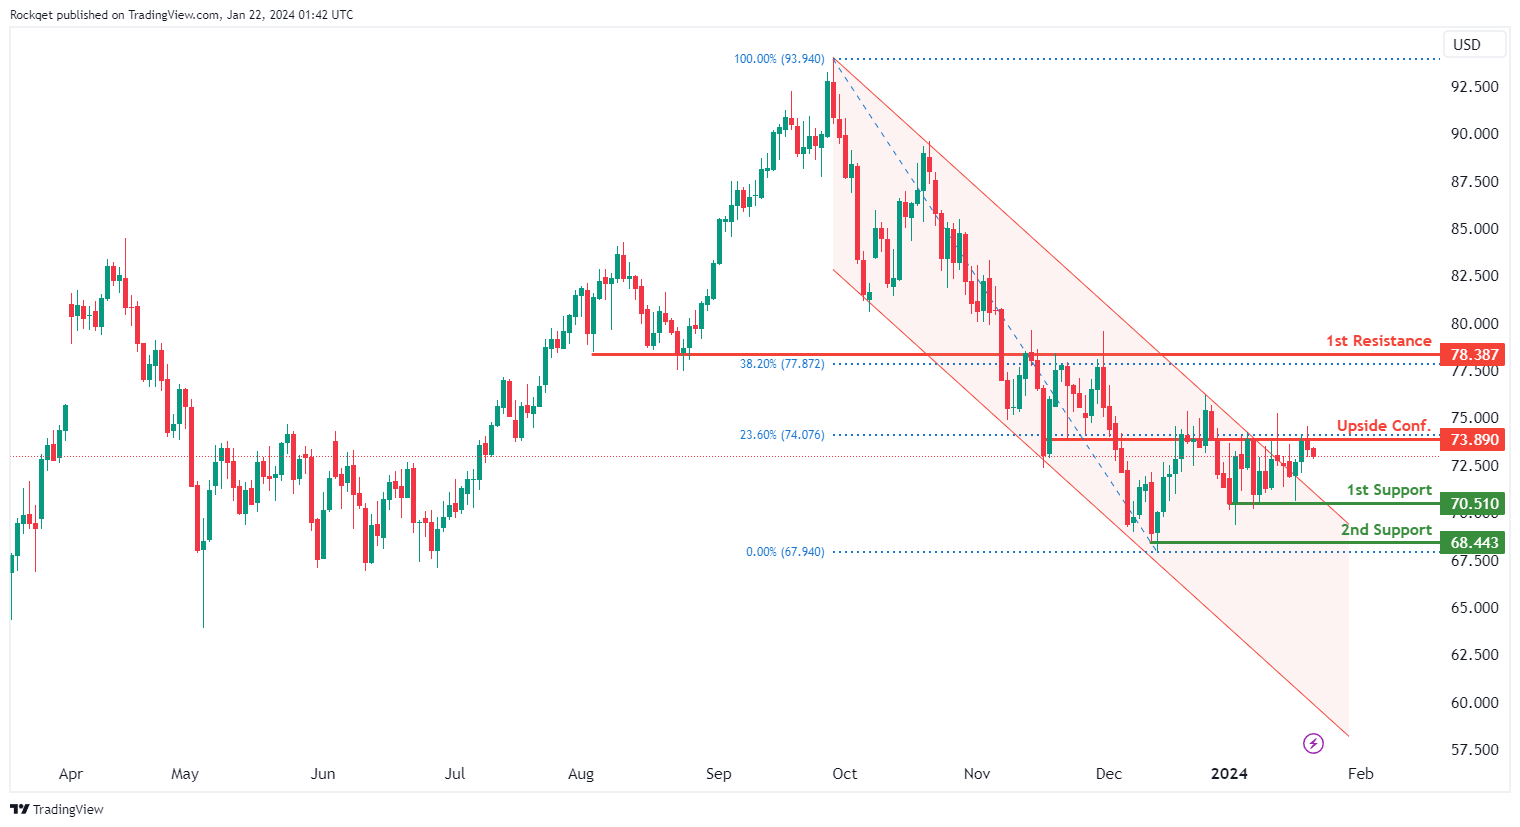
WTI/USD:
The WTI (West Texas Intermediate) chart currently exhibits an overall bearish momentum. However, price has broken above the upper trendline of the bearish channel. In this context, there is a potential scenario for price to rise towards the 1st resistance should it break above the Upside Confirmation level.
The Upside Confirmation level at 73.89 is identified as an overlap resistance that aligns with the 23.60% Fibonacci retracement level. Higher up, the 1st resistance level at 78.38 is also noted as an overlap resistance that aligns close to the 38.20% Fibonacci retracement level, suggesting a potential barrier for further upside movement.
To the downside, the 1st support level at 70.51 is identified as a pullback support. Further below, the 2nd support level at 68.44 is marked as a swing-low support, further reinforcing its importance as a key support level.
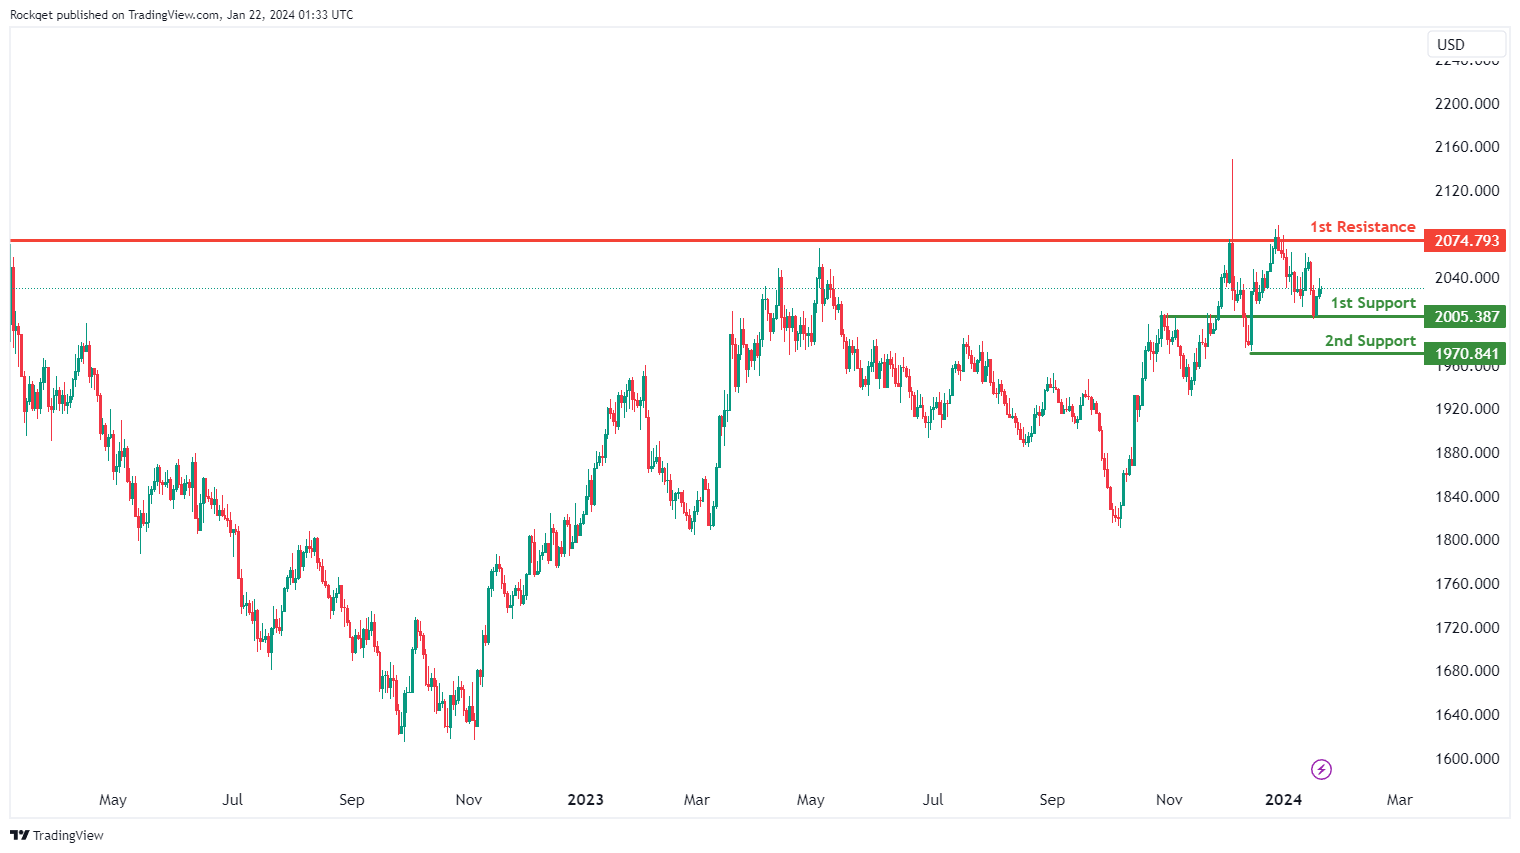
XAU/USD (GOLD):
The XAUUSD (Gold/US Dollar) chart presently displays a bullish overall momentum, indicating strength in the price of gold. This bullish momentum implies the possibility of a bullish continuation towards the 1st resistance level.
The 1st resistance level at 2074.79 is identified as an overlap resistance, signifying its historical significance as both a support and resistance level. It may serve as a potential hurdle for further upward price movement.
On the support side, the 1st support at 2005.38 is recognized as an overlap support, underlining its importance as a level where price has previously found both support and resistance. This level could offer potential buying interest, acting as a temporary support for XAUUSD.
The 2nd support at 1970.84 is categorized as a swing low support, pointing to its significance as a previous low point on the chart, which might serve as a support level during price pullbacks.


