
DXY:
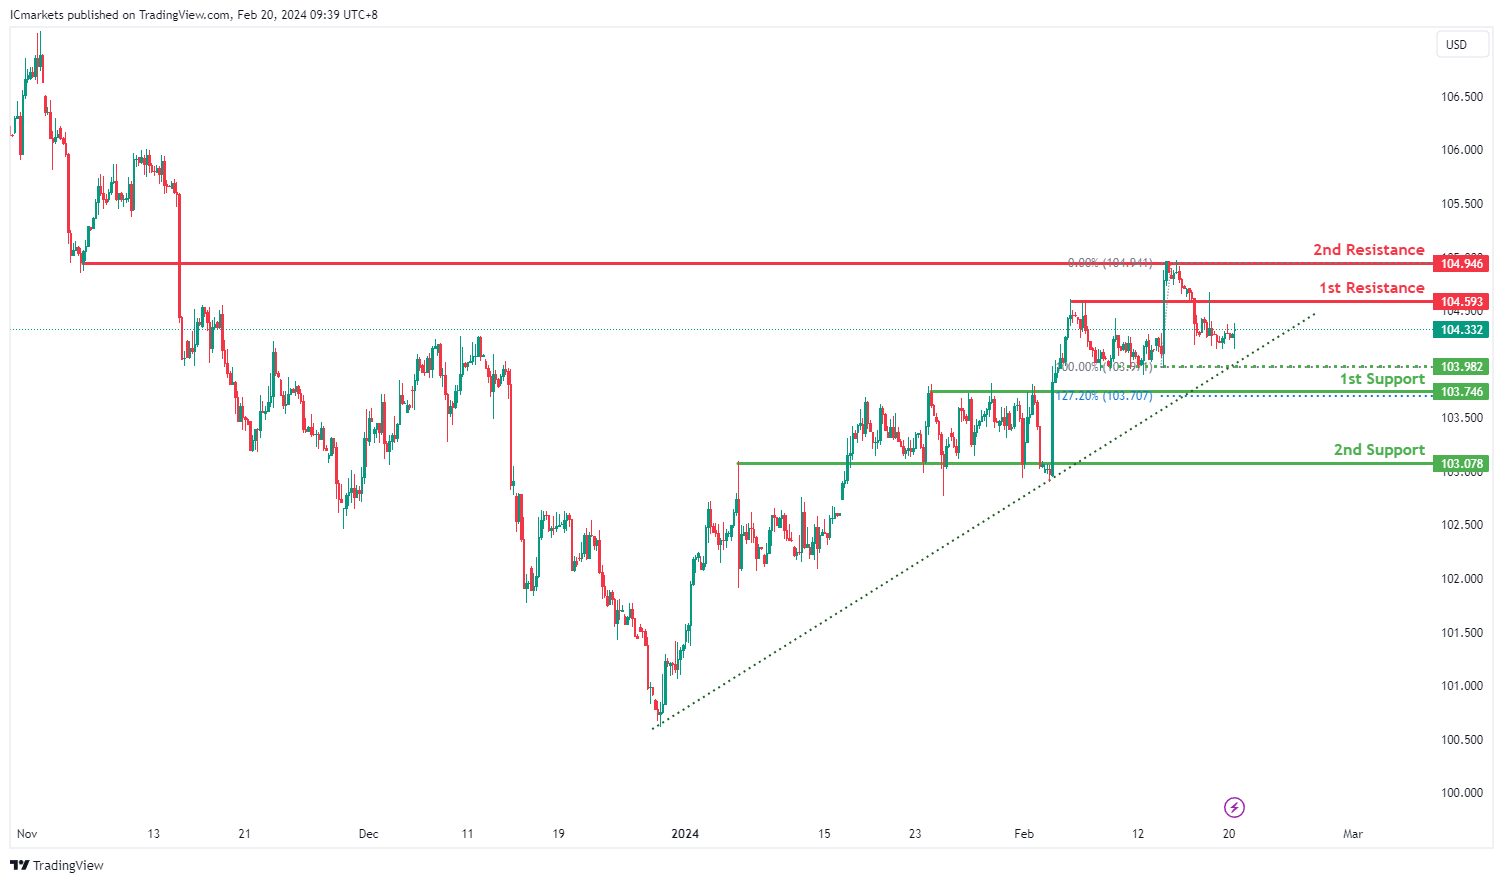
For DXY, the current momentum on the chart is assessed as bullish, with several factors contributing to this outlook. One notable factor is that the price is currently positioned above a major ascending trend line, indicating potential for further bullish momentum.
Looking ahead, the price could potentially experience a bullish bounce off the 1st support level, which is identified at 103.74. This level is considered a pullback support, suggesting that buyers might step in to defend this area, especially given the overall bullish sentiment.
Additionally, the 2nd support level is noted at 103.07, characterized as an overlap support. This further reinforces the potential for support in the event of a pullback, adding to the bullish case.
On the resistance side, the 1st resistance level is identified at 104.59, categorized as an overlap resistance. This level may act as a barrier where selling pressure could increase, potentially leading to a pause or reversal in the bullish trend.
Furthermore, the 2nd resistance level stands at 104.94, also considered an overlap resistance. This level provides additional resistance overhead and could serve as a target for bullish moves if the price continues its upward trajectory.
EUR/USD:
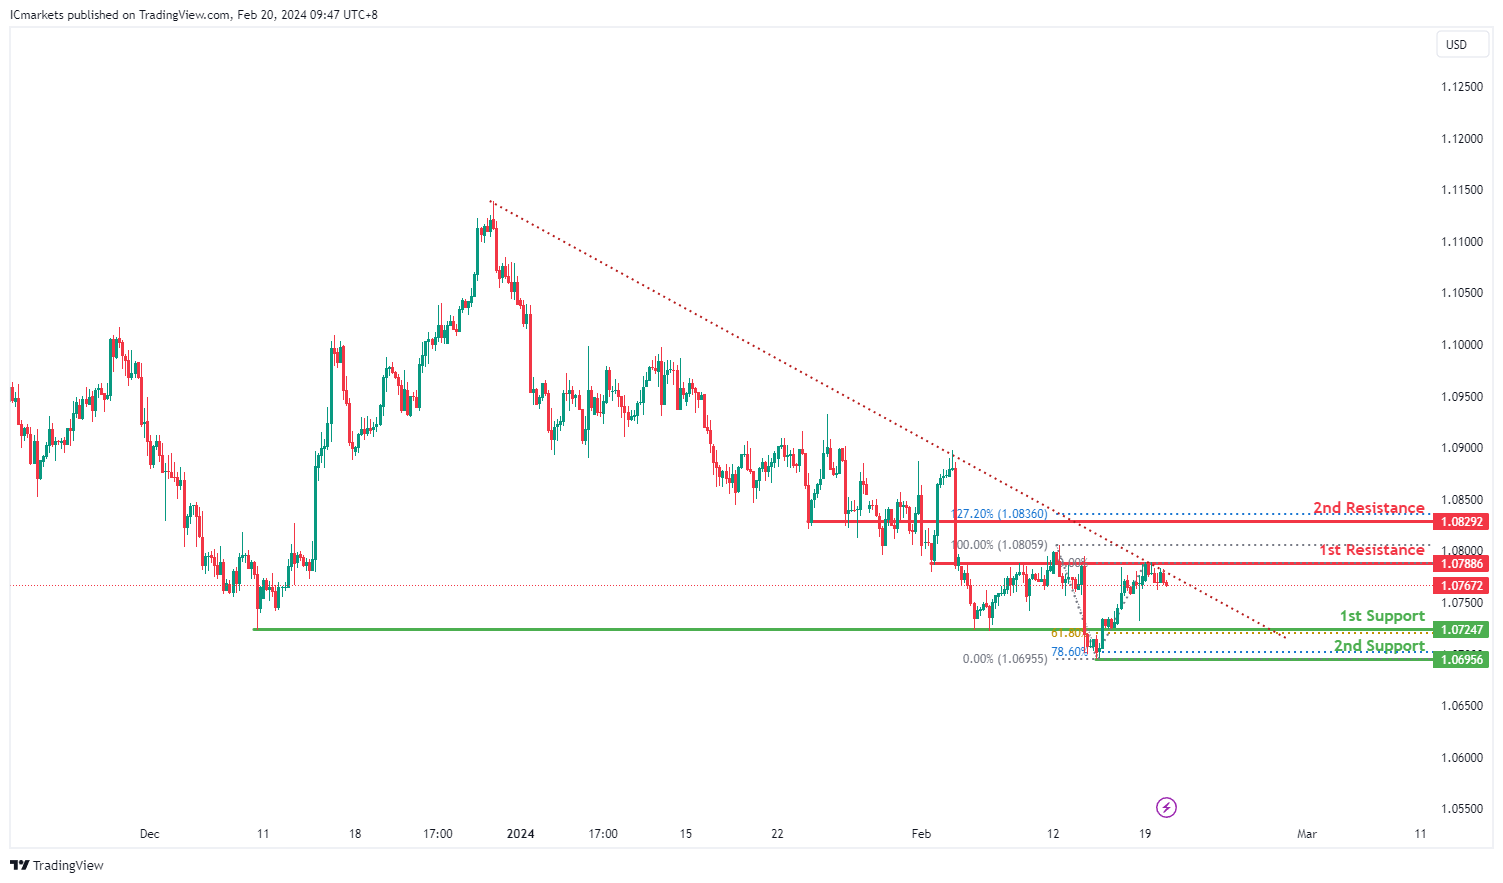
For EUR/USD, the current momentum on the chart is characterized as bearish, with several factors contributing to this outlook. One significant factor is that the price is currently within a bearish descending channel, indicating a downtrend.
Considering the potential price action, there’s a likelihood for a bearish continuation towards the 1st support level, which is identified at 1.0724. This level is deemed significant as it represents an overlap support and coincides with the 61.80% Fibonacci retracement level, adding to its significance as a potential area of support where buyers might step in.
Furthermore, the 2nd support level is situated at 1.0695, which is marked as a swing low support and corresponds to the 78.60% Fibonacci retracement level. This reinforces the potential for support at this level and adds to the bearish case for a continuation towards lower levels.
On the resistance side, the 1st resistance level is identified at 1.0788, characterized as an overlap resistance. This level may act as a barrier where selling pressure could increase, potentially causing the price to reverse or consolidate.
Additionally, the 2nd resistance level stands at 1.0829, categorized as an overlap resistance and coinciding with the 127.20% Fibonacci extension level. This level provides additional resistance overhead and could serve as a target for bearish moves if the price attempts a bounce but fails to breach higher resistance levels.
EUR/JPY:
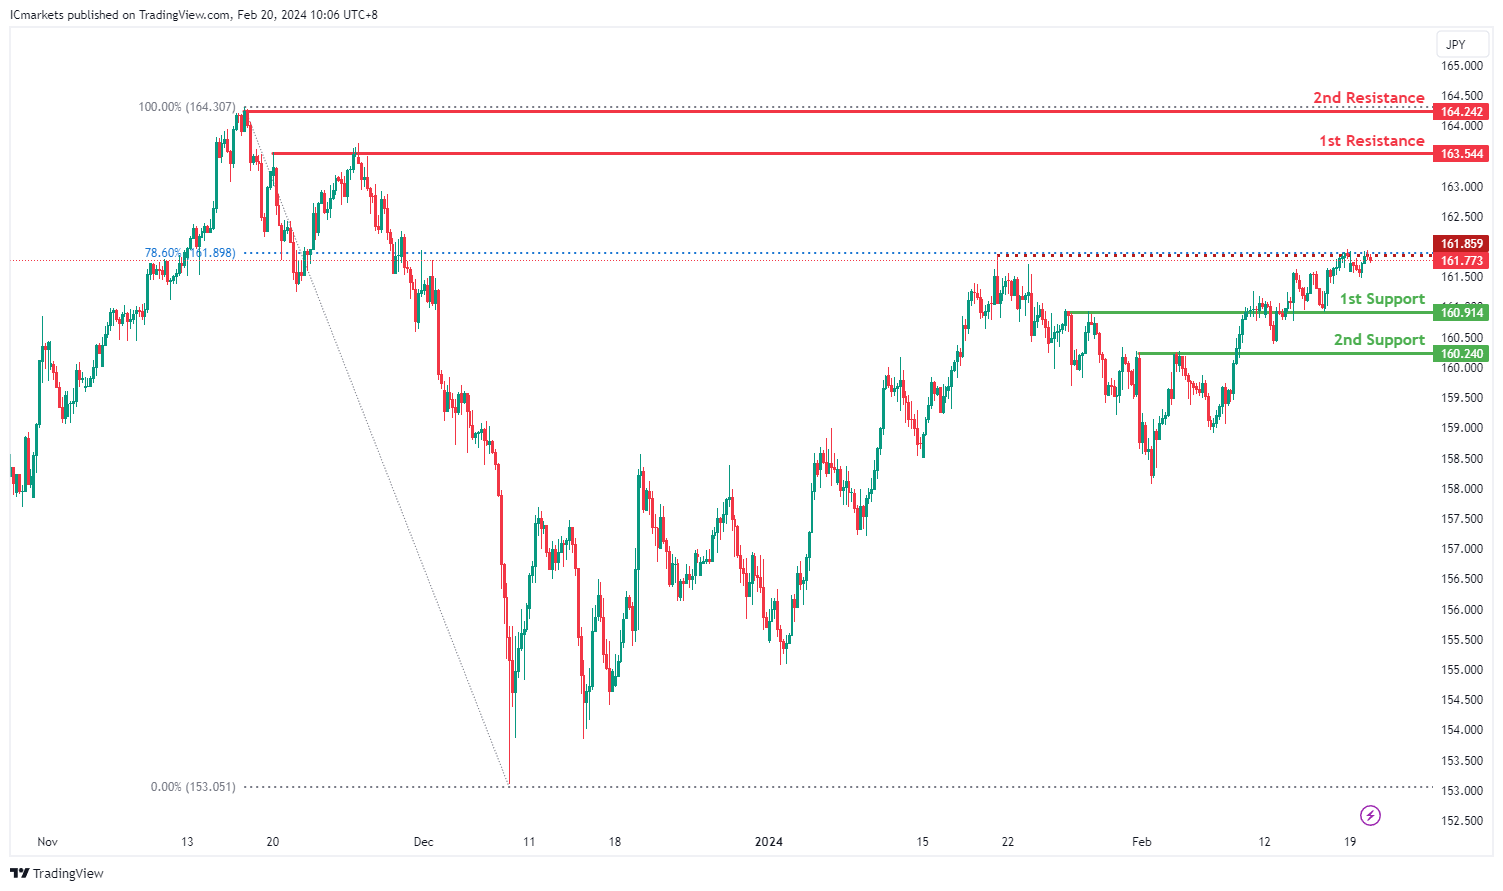
The EUR/JPY chart currently exhibits a bearish overall momentum, driven by several factors contributing to the downward trend. However, there is a potential short-term rise towards the 1st resistance level before a reversal back towards the 1st support level.
The 1st support level at 160.914 is significant as it aligns with an overlap support, indicating a historical level where buying interest has emerged in the past. This level suggests a strong potential support zone where the price may find temporary stability.
Additionally, the 2nd support level at 160.220 corresponds to a pullback support, reinforcing its importance as a potential level where buyers could step in to support the price.
On the resistance side, the 1st resistance level at 163.544 is identified as a multi-swing high resistance, indicating a historical point where selling pressure has been significant. This level may act as a barrier to further upward movement in the short term.
Further up, the 2nd resistance level at 164.242 aligns with a swing high resistance, adding to its significance as a potential point where selling interest may intensify.
An intermediate resistance level at 161.86 is also identified, which aligns with a pullback resistance and the 78.60% Fibonacci Retracement, providing additional reinforcement to the resistance structure.
EUR/GBP:
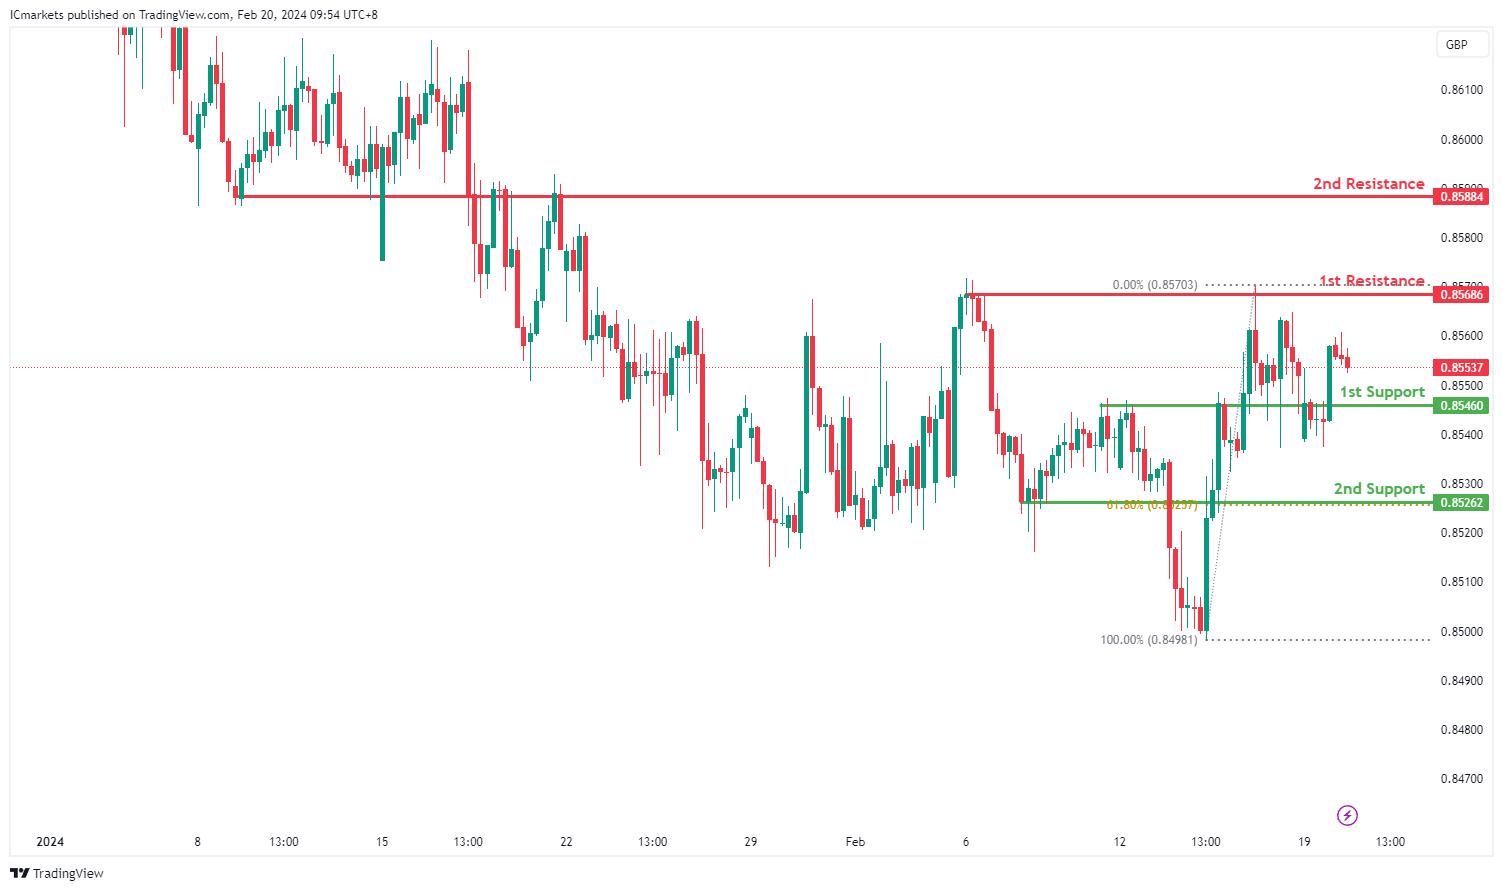
The EUR/GBP chart currently reflects a bearish momentum, suggesting a continued downward trend. Several factors contribute to this sentiment, indicating the potential for further decline towards the 1st support level.
The 1st support level at 0.85460 is significant as it aligns with an overlap support, indicating a historical level where buying interest has emerged in the past. This level serves as a strong potential support zone where the price could find stability or experience a bounce.
Moreover, the 2nd support level at 0.85262 corresponds to both a pullback support and the 61.80% Fibonacci Retracement, further reinforcing its significance as a potential support area. This confluence of support factors suggests increased buying interest at this level.
On the resistance side, the 1st resistance level at 0.85686 is identified as a pullback resistance, suggesting a historical point where selling pressure may intensify. This level may act as a barrier to upward movement, potentially leading to further downside momentum.
Further up, the 2nd resistance level at 0.85884 aligns with an overlap resistance, adding to its significance as a potential point where selling interest could strengthen.
GBP/USD:
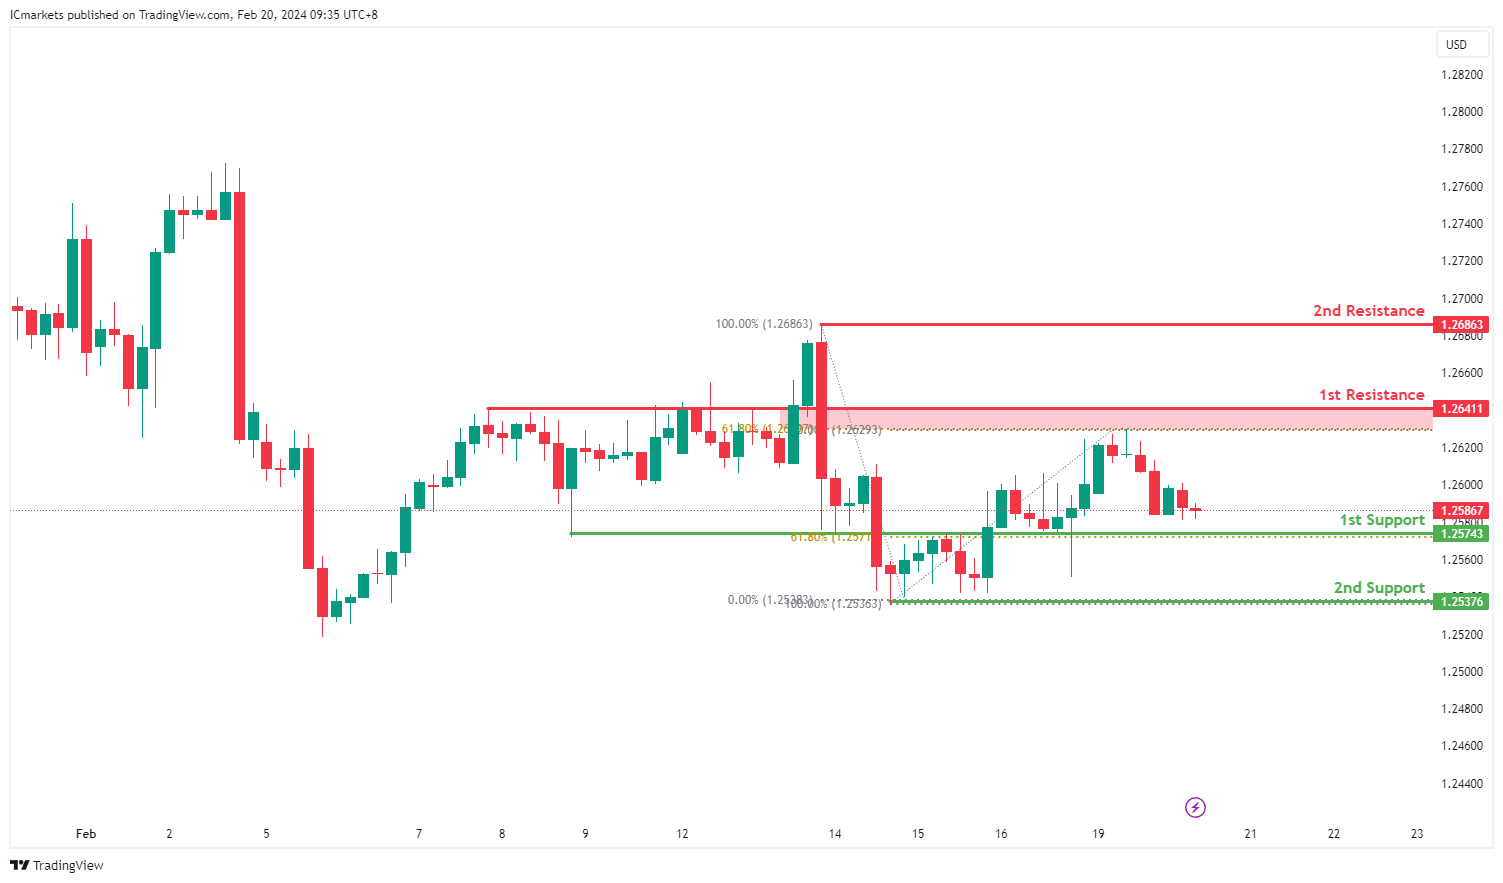
For GBP/USD, the current momentum on the chart is described as bullish. Here are the identified levels and reasons supporting potential price movements:
The 1st support at 1.2574 is considered an overlap support, indicating a historical area where buyers have previously entered the market. Additionally, it coincides with the 61.80% Fibonacci retracement level, adding confluence and significance to the support level.
The 2nd support at 1.2537 is identified as a multi-swing low support, suggesting that it has been a level where buyers have stepped in multiple times in the past. It provides further reinforcement for potential support.
On the resistance side, the 1st resistance at 1.2641 is characterized as an overlap resistance, indicating a historical area where selling pressure has been prevalent. This level also coincides with the 61.80% Fibonacci retracement level, adding to its significance as a potential barrier to further upside movement.
Finally, the 2nd resistance at 1.2686 is marked as a swing high resistance, suggesting that it has acted as a significant barrier to upward price movements. It adds further resistance overhead, potentially capping bullish advances.
GBP/JPY:
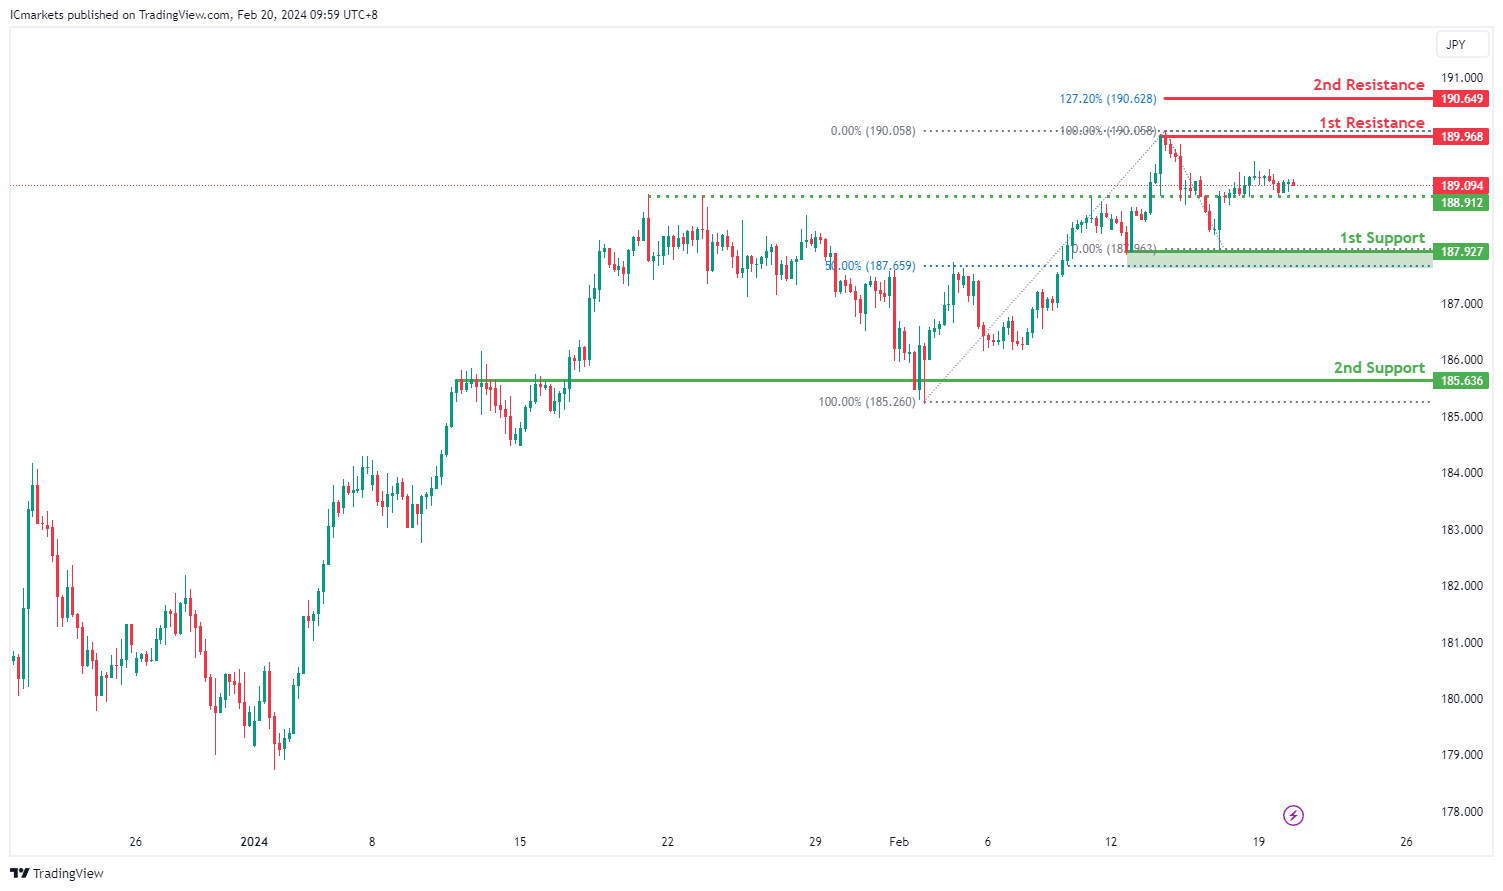
The GBP/JPY chart currently indicates a neutral momentum, suggesting a lack of clear directional bias. There are several key levels identified that may influence potential price movements, indicating the possibility of fluctuation between the 1st resistance and 1st support levels.
The 1st support level at 187.927 is significant as it aligns with both an overlap support and the 50% Fibonacci Retracement. This convergence suggests a strong historical level where buying interest has emerged in the past, potentially providing support to the price if tested.
Additionally, the 2nd support level at 185.636 corresponds to another overlap support, further reinforcing its importance as a potential support zone. This level indicates a significant historical area where buyers have previously intervened to support the price.
On the resistance side, the 1st resistance level at 189.968 is identified as a swing high resistance, suggesting a historical point where selling pressure may increase. This level could act as a barrier to further upward movement, potentially leading to a reversal or consolidation.
An intermediate support level at 190.649 is also identified, aligning with the 127.20% Fibonacci Retracement. This level could provide additional support to the price if tested, potentially influencing price action in the short term.
USD/CHF:
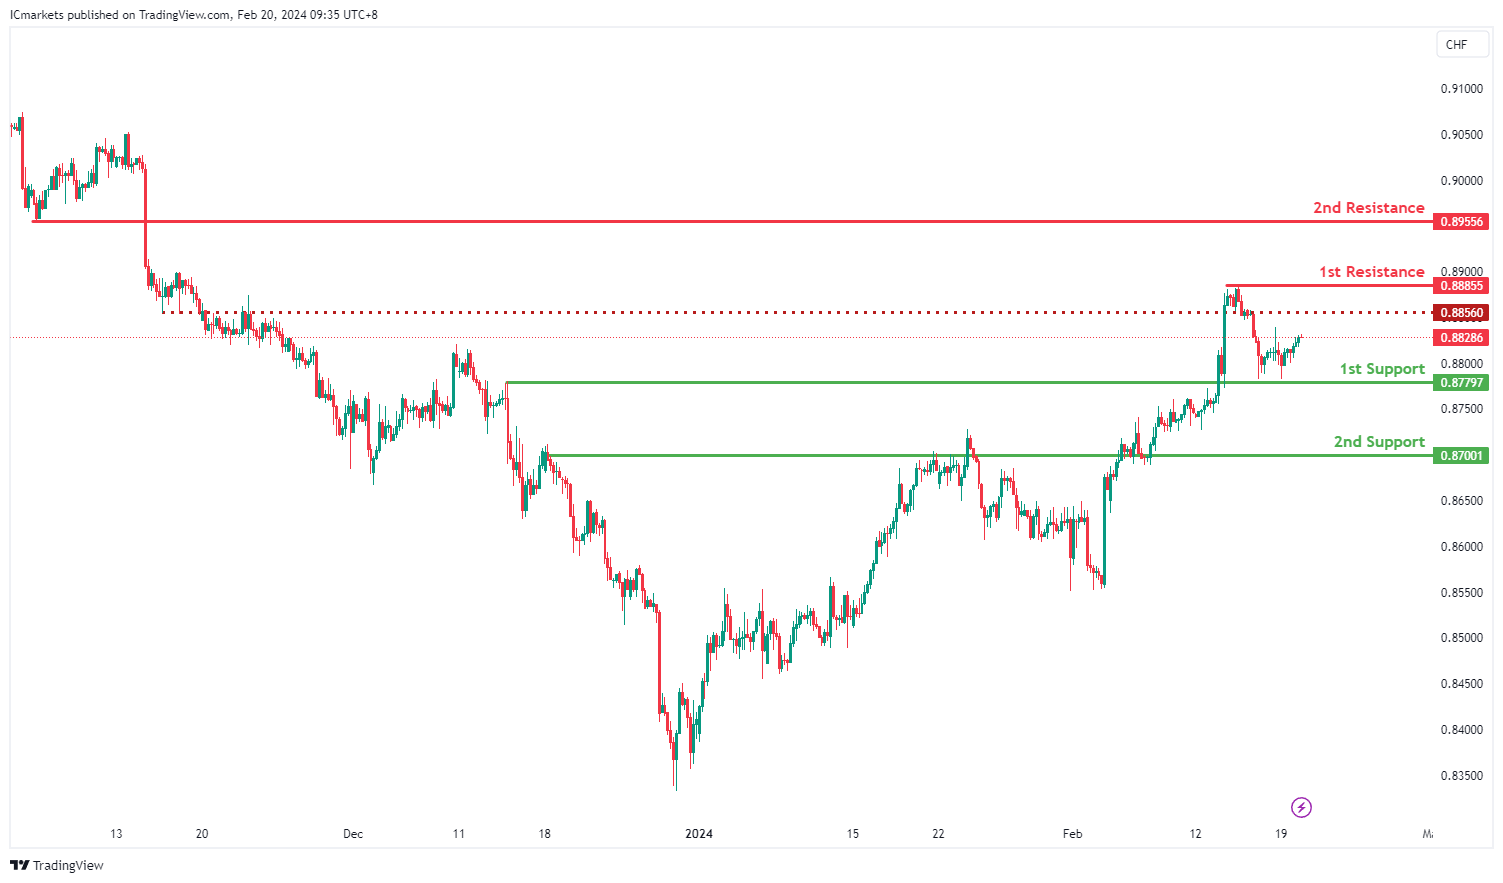
For USD/CHF, the current momentum on the chart is described as bullish. Here are the identified levels and reasons supporting potential price movements:
The 1st support at 0.8779 is considered an overlap support, indicating a historical area where buyers have previously entered the market. This level provides initial reinforcement for potential downside movements.
The 2nd support at 0.8700 is also identified as an overlap support, further strengthening its significance as a level where buyers have historically been active. It provides additional support in case of a deeper retracement.
On the resistance side, the 1st resistance at 0.8885 is characterized as a multi-swing high resistance, suggesting that it has acted as a significant barrier to upward price movements. Traders often pay close attention to such levels as they represent areas where selling pressure has been strong in the past.
The 2nd resistance at 0.8955 is marked as a pullback resistance, indicating that it may pose a challenge to further upward movements after an initial bounce. This level adds further resistance overhead, potentially limiting bullish advances.
Additionally, an intermediate resistance at 0.8856 is identified as a pullback resistance, providing an additional hurdle for bullish continuation.
USD/JPY:
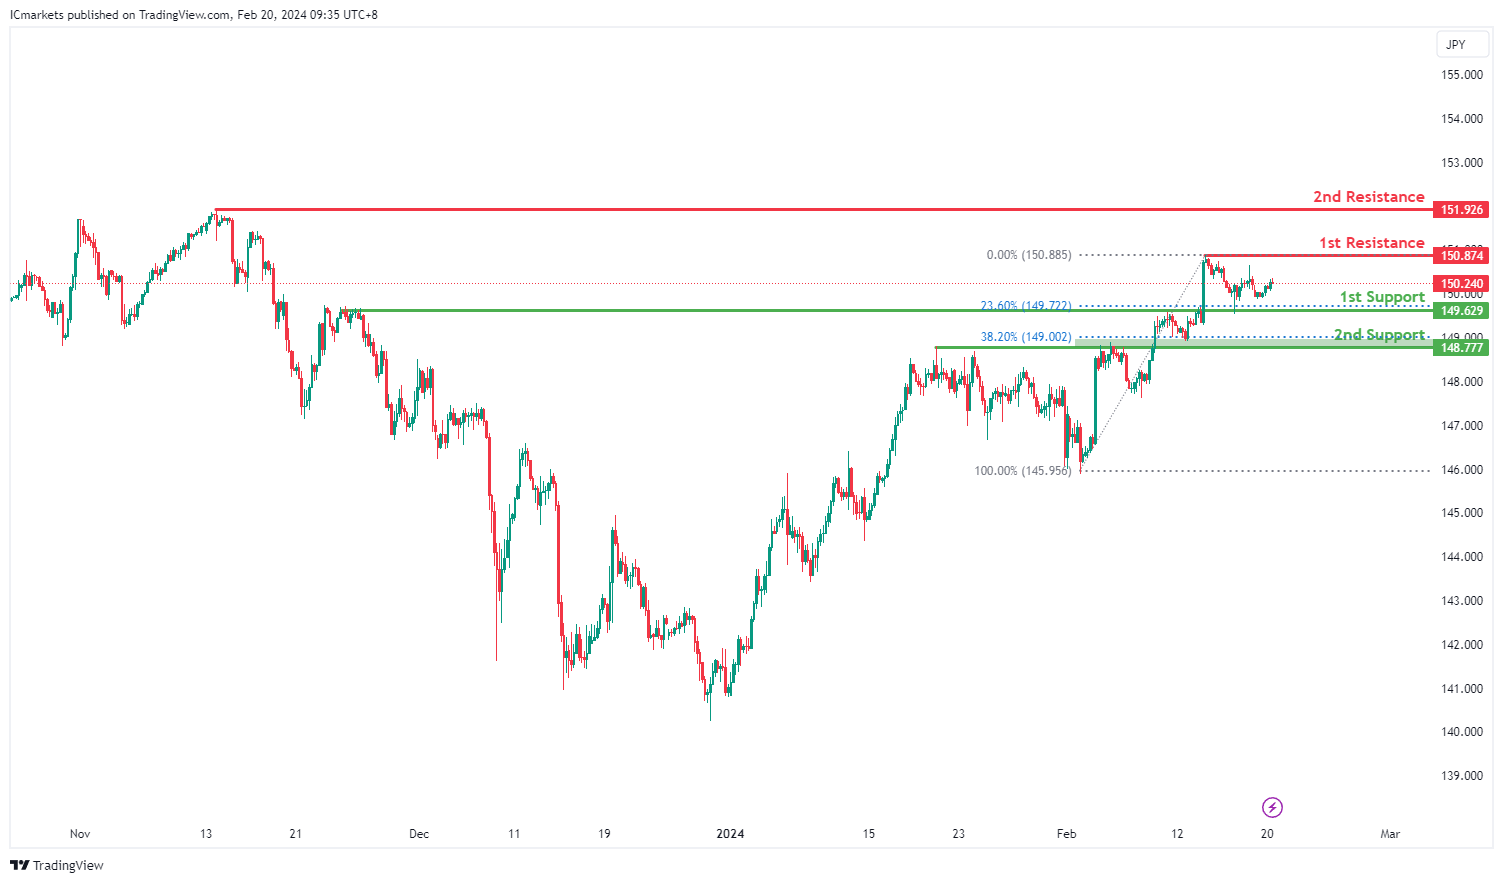
For USD/JPY, the current momentum on the chart is described as bullish. Here are the identified levels and reasons supporting potential price movements:
The 1st support at 149.62 is identified as an overlap support, indicating a historical level where buyers have previously entered the market. This level is reinforced by the presence of the 23.60% Fibonacci Retracement, adding significance to the support zone.
The 2nd support at 148.77 is also characterized as an overlap support, further strengthening its importance as a level where buying interest has historically been observed. The presence of the 38.20% Fibonacci Retracement adds additional confluence to this support level.
On the resistance side, the 1st resistance at 150.87 is identified as a swing high resistance. This level suggests that it has acted as a significant barrier to upward price movements in the past, indicating potential selling pressure near this level.
The 2nd resistance at 151.92 is also marked as a swing high resistance, further confirming its importance as a historical point where selling interest has been strong. Traders often pay attention to such levels as they may represent areas where selling pressure could intensify.
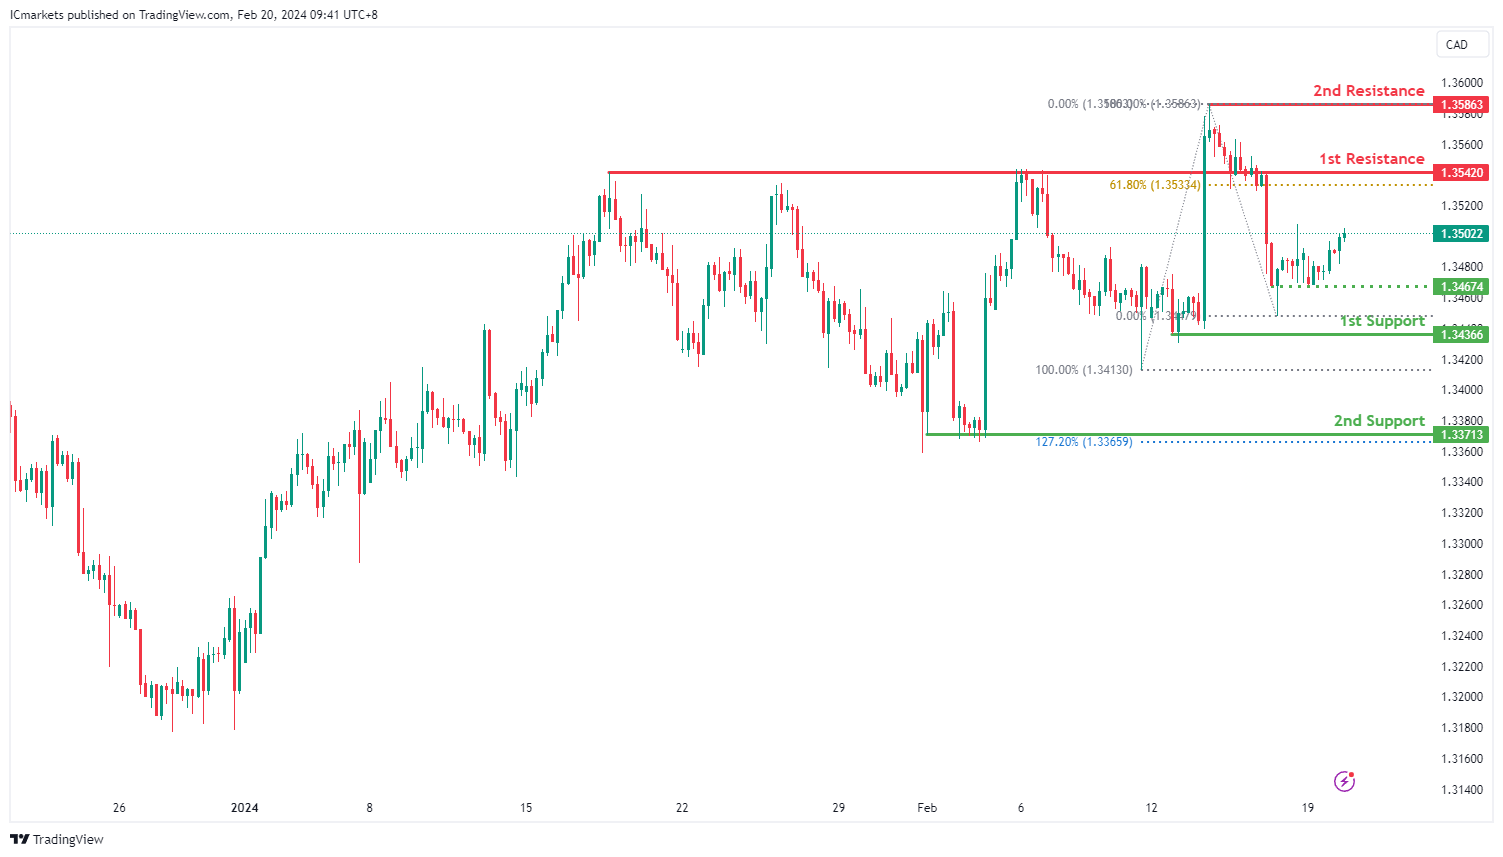
USD/CAD:
The USD/CAD chart currently exhibits an overall bullish momentum. In this context, there is a potential scenario for price to rise towards the 1st resistance.
The 1st resistance level at 1.3542 is identified as an overlap resistance that aligns close to the 61.80% Fibonacci Retracement level. Higher up, the 2nd resistance level at 1.3586 is noted as a swing-high resistance, further highlighting its importance as a potential resistance point.
To the downside, the intermediate support level at 1.3467 is identified as a pullback support while the 1st support level at 1.3436 is also marked as a pullback support. Further below, the 2nd support level at 1.3371 is also noted as a pullback support that aligns close to the 127.20% Fibonacci Extension level, further emphasizing its importance as a potential support zone.
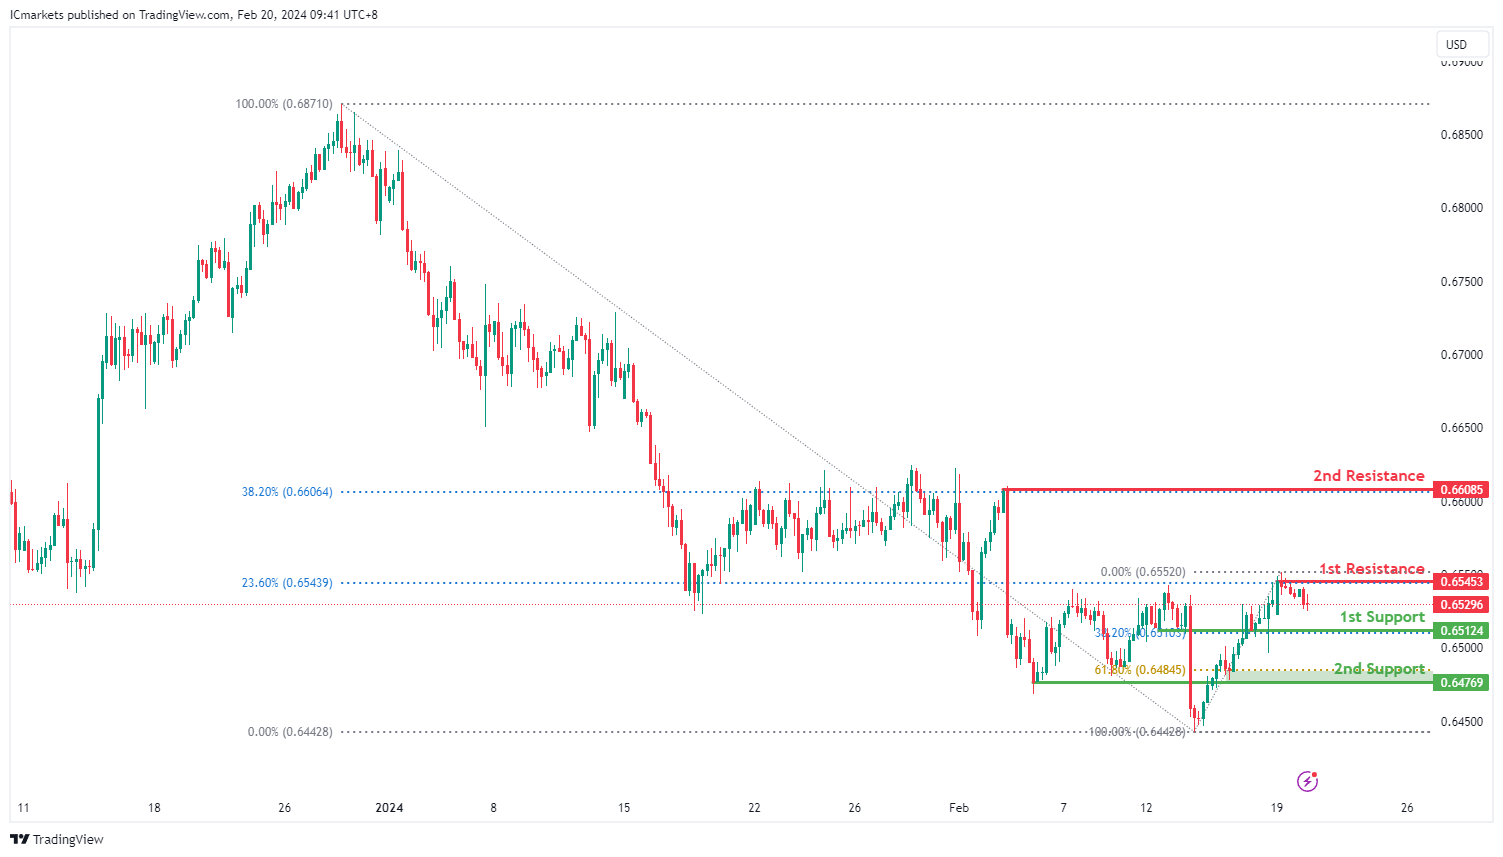
AUD/USD:
The AUD/USD chart currently exhibits a neutral bias. In this context, there is a potential scenario for price to fluctuate between the 1st resistance and the 1st support.
The 1st resistance level at 0.6545 is identified as a pullback resistance that aligns with the 23.60% Fibonacci Retracement level. Higher up, the 2nd resistance level at 0.6608 is also marked as a pullback resistance that aligns with the 38.20% Fibonacci Retracement level, further highlighting its importance as a potential resistance point.
To the downside, the 1st support level at 0.6512 is identified as pullback support that aligns with the 38.20% Fibonacci Retracement level. Further below, the 2nd support level at 0.6476 is also noted as a pullback resistance that aligns close to the 61.80% Fibonacci Retracement level, further emphasizing its importance as a potential support zone.
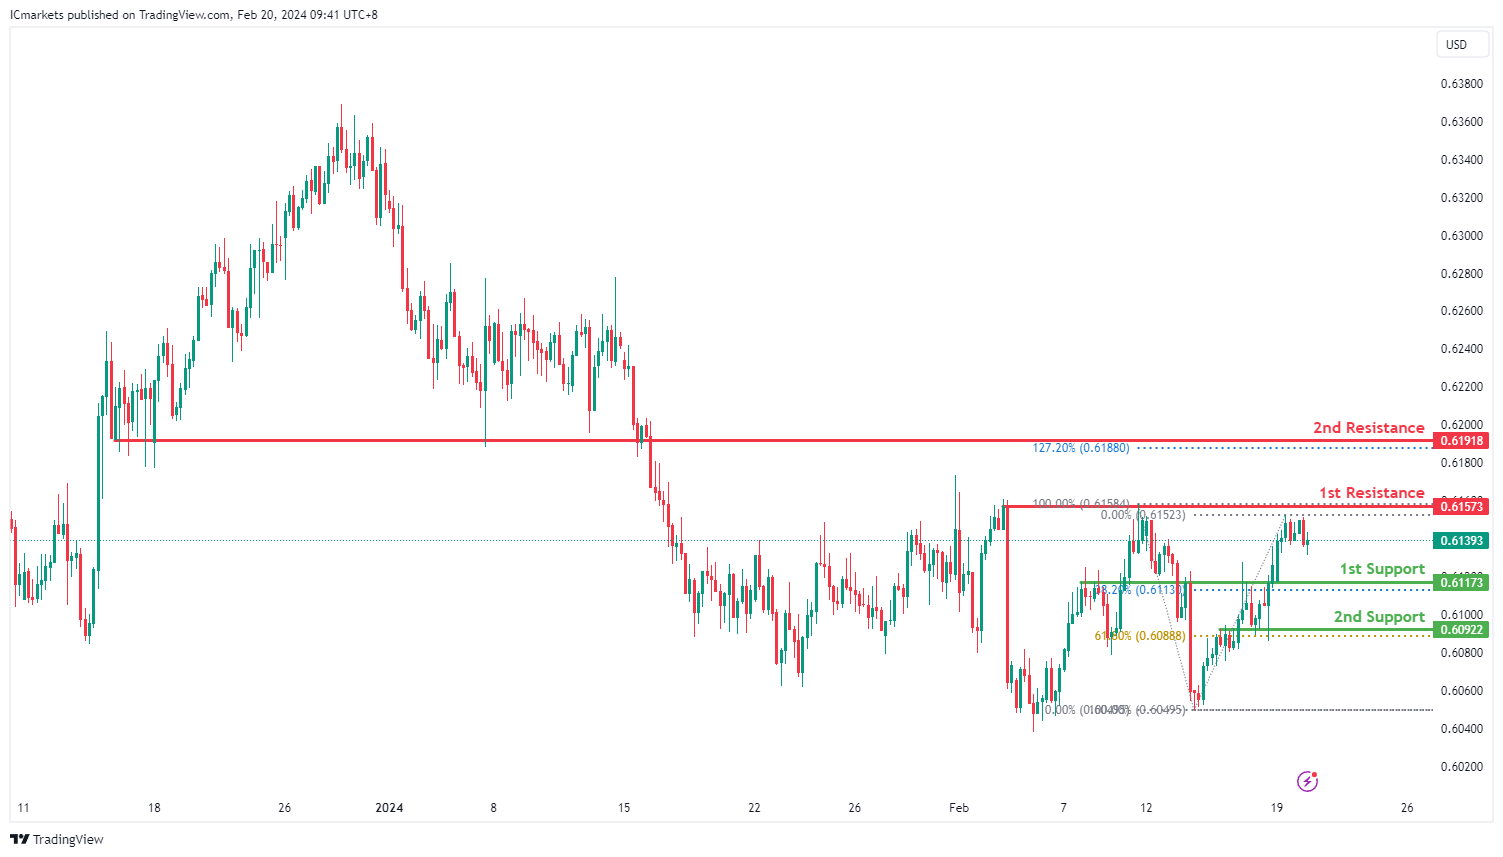
NZD/USD
The NZD/USD chart currently exhibits a neutral bias. In this context, there is a potential scenario for price to fluctuate between the 1st resistance and the 1st support.
The 1st resistance level at 0.6157 is identified as a pullback resistance. Higher up, the 2nd resistance level at 0.6191 is also marked as a pullback resistance that aligns with the 127.20% Fibonacci Extension level, further highlighting its importance as a potential resistance point.
To the downside, the 1st support level at 0.6117 is identified as an overlap support that aligns with the 38.20% Fibonacci Retracement level. Further below, the 2nd support level at 0.6092 is also noted as an overlap support that aligns with the 61.80% Fibonacci Retracement level, further emphasizing its importance as a potential support zone.
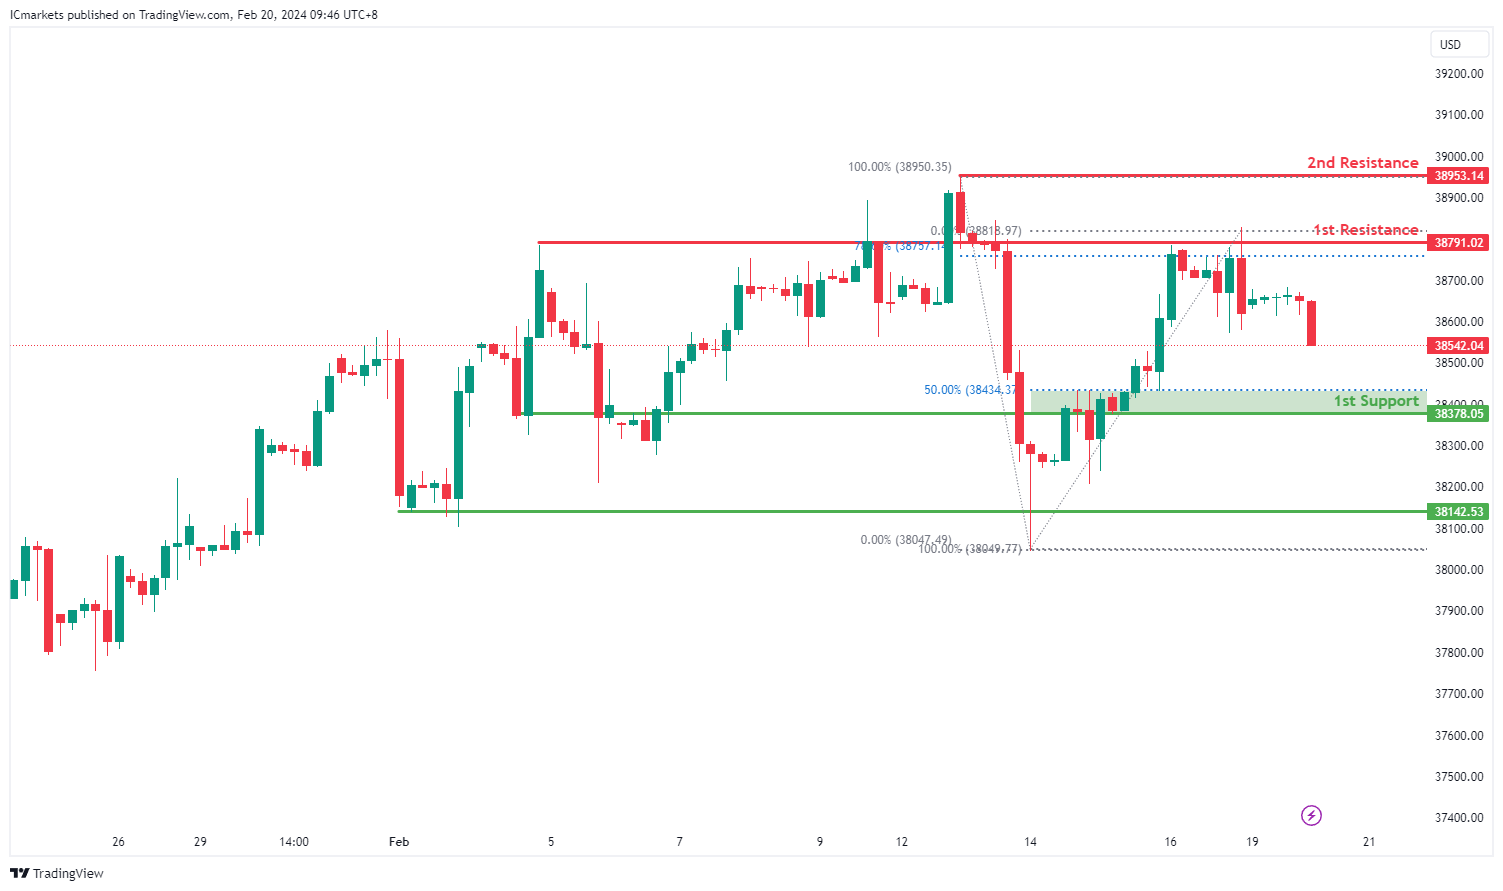
DJ30:
The DJ30 chart currently demonstrates a bearish momentum, indicating a prevailing downward trend. However, there are potential price movements identified that suggest a short-term rise towards the 1st resistance level before reversing downwards towards the 1st support.
The 1st support level at 38,378.05 is considered significant as it aligns with both a pullback support and the 50% Fibonacci Retracement. This convergence suggests a strong historical level where buying interest has emerged, potentially providing support to the price if tested.
Additionally, the 2nd support level at 38,142.53 corresponds to another pullback support, reinforcing its importance as a potential support zone. This level indicates a significant historical area where buyers have previously intervened to support the price.
On the resistance side, the 1st resistance level at 38,791.02 is identified as a pullback resistance, suggesting a historical point where selling pressure may increase. This level, combined with the 78.60% Fibonacci Retracement, could act as a barrier to further upward movement, potentially leading to a reversal in the short term.
Further up, the 2nd resistance level at 38,953.14 aligns with a swing high resistance, adding to its significance as a potential barrier to upward movement.
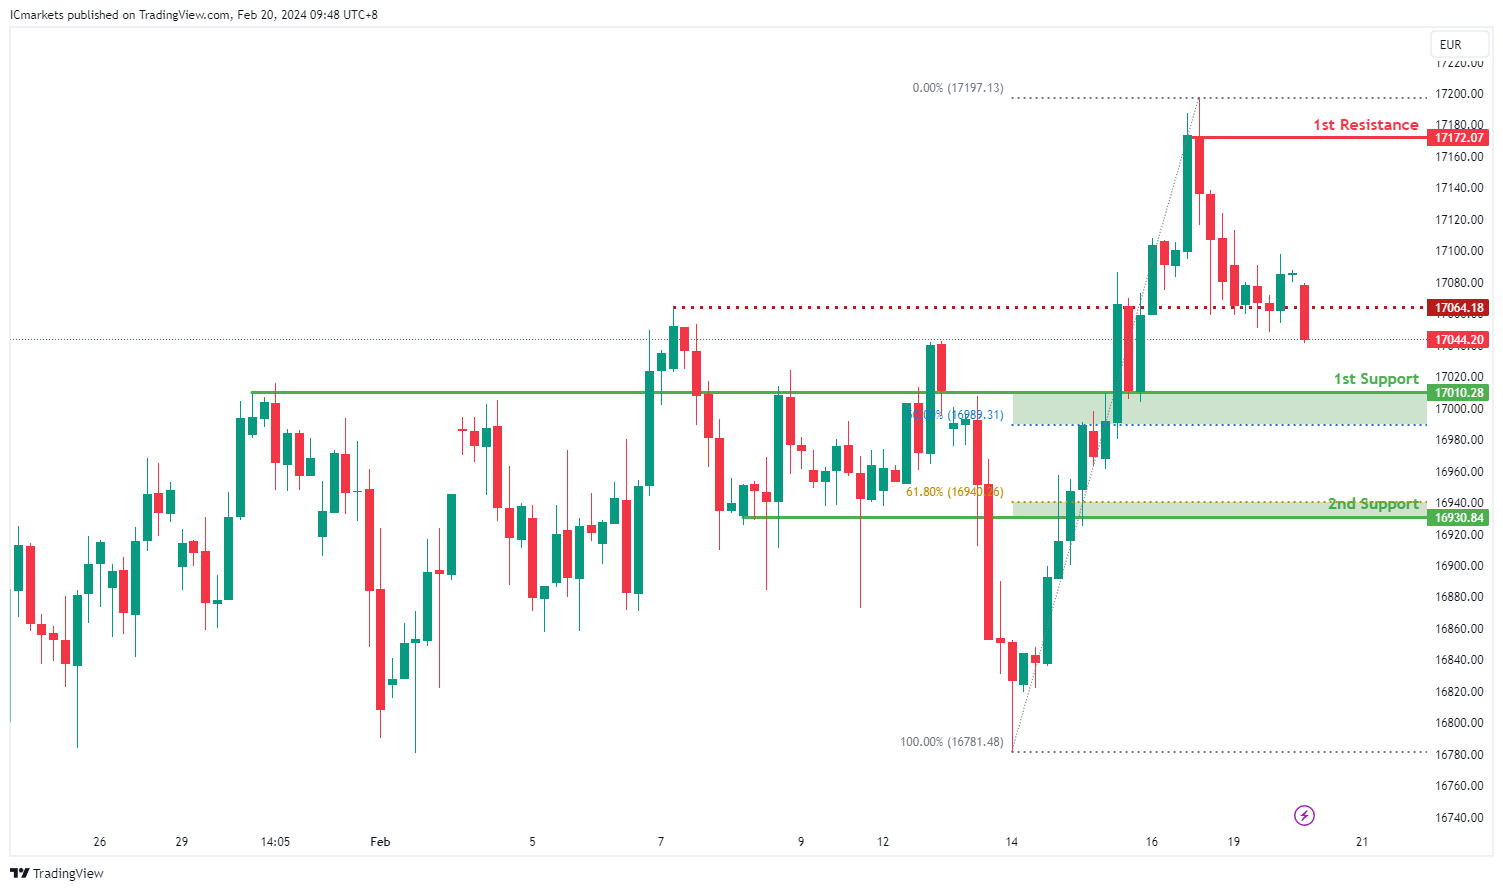
GER40:
The GER40 chart currently exhibits a bearish momentum, indicating a prevailing downward trend. Several factors contribute to this bearish sentiment, supporting the potential for a continued downward movement in price.
The 1st support level at 17,010.3 is significant as it aligns with both an overlap support and the 50% Fibonacci Retracement. This convergence suggests a robust historical level where buying interest has emerged, potentially providing support to the price if tested.
Furthermore, the 2nd support level at 16,930.8 corresponds to a pullback support and the 61.80% Fibonacci Retracement, reinforcing its importance as a potential support zone. This level indicates a significant historical area where buyers have previously intervened to support the price.
On the resistance side, the 1st resistance level at 17,172.1 is identified as a swing high resistance, suggesting a historical point where selling pressure may increase. This level could act as a barrier to further upward movement, contributing to the bearish momentum.
Additionally, an intermediate resistance level at 17,064.2 aligns with a swing high resistance, further reinforcing its significance as a potential barrier to upward movement.
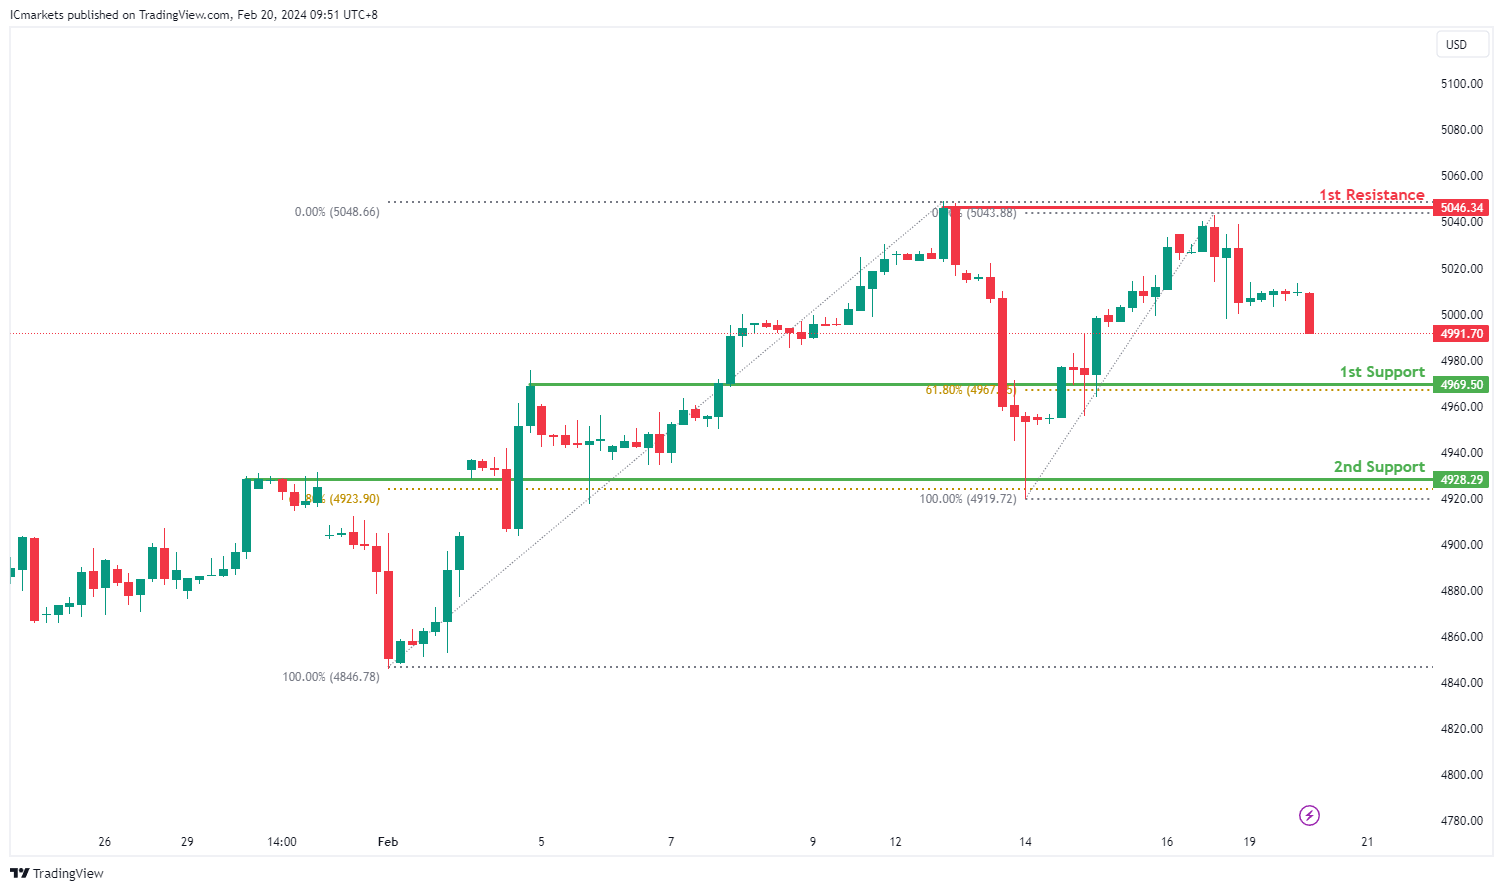
US500:
The US500 chart currently displays a bearish momentum, indicating a prevalent downward trend. Several factors contribute to this bearish sentiment, suggesting a potential continuation of the downward movement in price.
The 1st support level at 4969.50 is significant as it aligns with both a pullback support and the 61.80% Fibonacci Retracement level. This convergence indicates a strong historical level where buying interest has emerged, potentially providing a solid foundation for a bounce or a halt in further downward movement.
Furthermore, the 2nd support level at 4928.29 corresponds to an overlap support, reinforcing its significance as a potential support zone. This level suggests a notable historical area where buyers have previously intervened to support the price.
On the resistance side, the 1st resistance level at 5046.34 is identified as a swing high resistance, indicating a historical point where selling pressure may increase. This level could act as a barrier to further upward movement, aligning with the overall bearish sentiment.
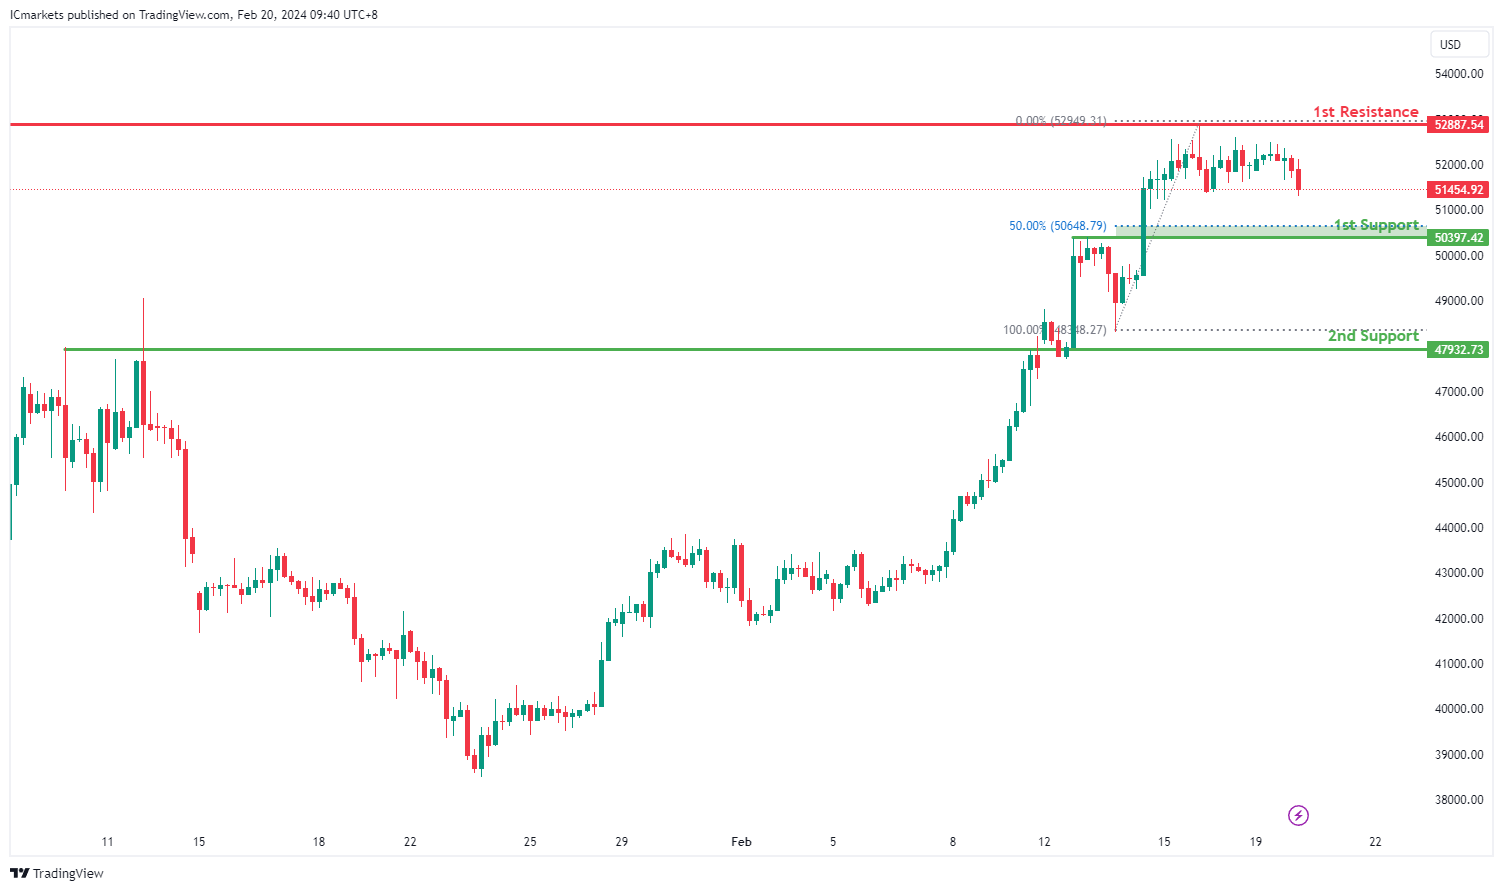
BTC/USD:
The BTC/USD chart currently demonstrates a neutral overall momentum, indicating a lack of clear directionality in the prevailing trend. Given this neutrality, the price may potentially oscillate within a range bounded by the 1st resistance and 1st support levels.
The 1st support level at 50397.42 is considered significant as it aligns with a pullback support and the 50% Fibonacci retracement level. This confluence suggests a strong historical area where buying interest has previously emerged, potentially acting as a support zone.
Additionally, the 2nd support level at 47932.73 corresponds to an overlap support, further reinforcing its importance as a potential area where buyers may intervene to support the price.
On the resistance side, the 1st resistance level at 52887.54 is identified as a swing high resistance. This level represents a historical point where selling pressure has been significant, potentially acting as a barrier to further upward movement.
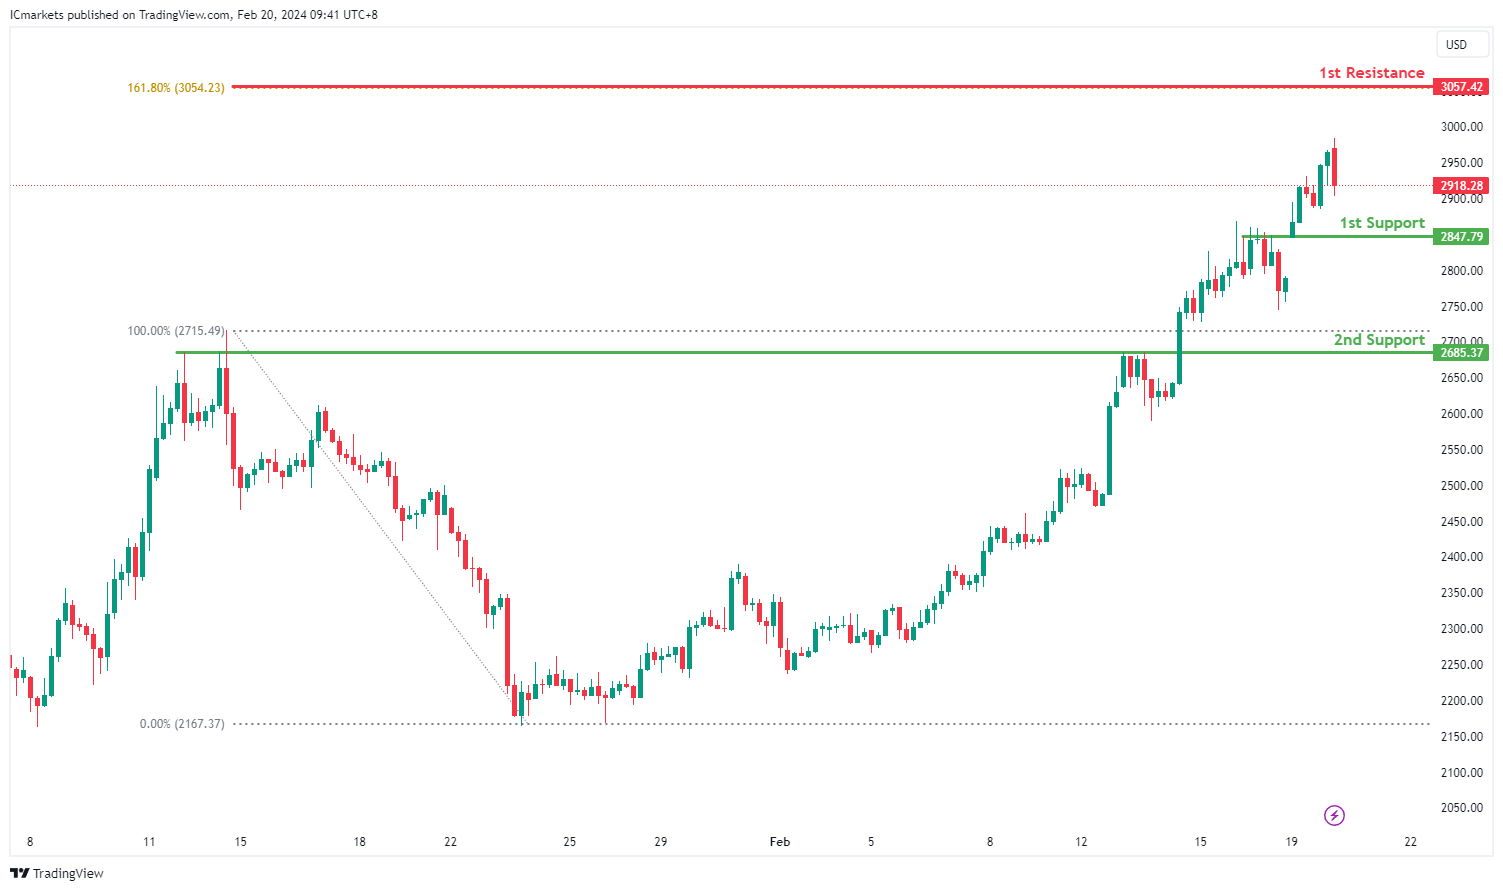
ETH/USD:
The ETH/USD chart currently exhibits a bullish overall momentum, suggesting a prevailing upward trend in the market. Given this momentum, the price may potentially continue its bullish movement towards the 1st resistance level.
The 1st support level at 2847.79 is deemed significant as it aligns with an overlap support, indicating a historical level where buying interest has been notable. This support level could act as a foundation for further upward movement.
Furthermore, the 2nd support level at 2685.37 corresponds to a pullback support, adding to its significance as a potential area where buyers might step in to support the price during any retracements.
On the resistance side, the 1st resistance level at 3057.42 is identified as a critical point where selling pressure may increase. This level aligns with the 161.80% Fibonacci extension, suggesting a potential target for bullish momentum to pause or encounter resistance.
WTI/USD:
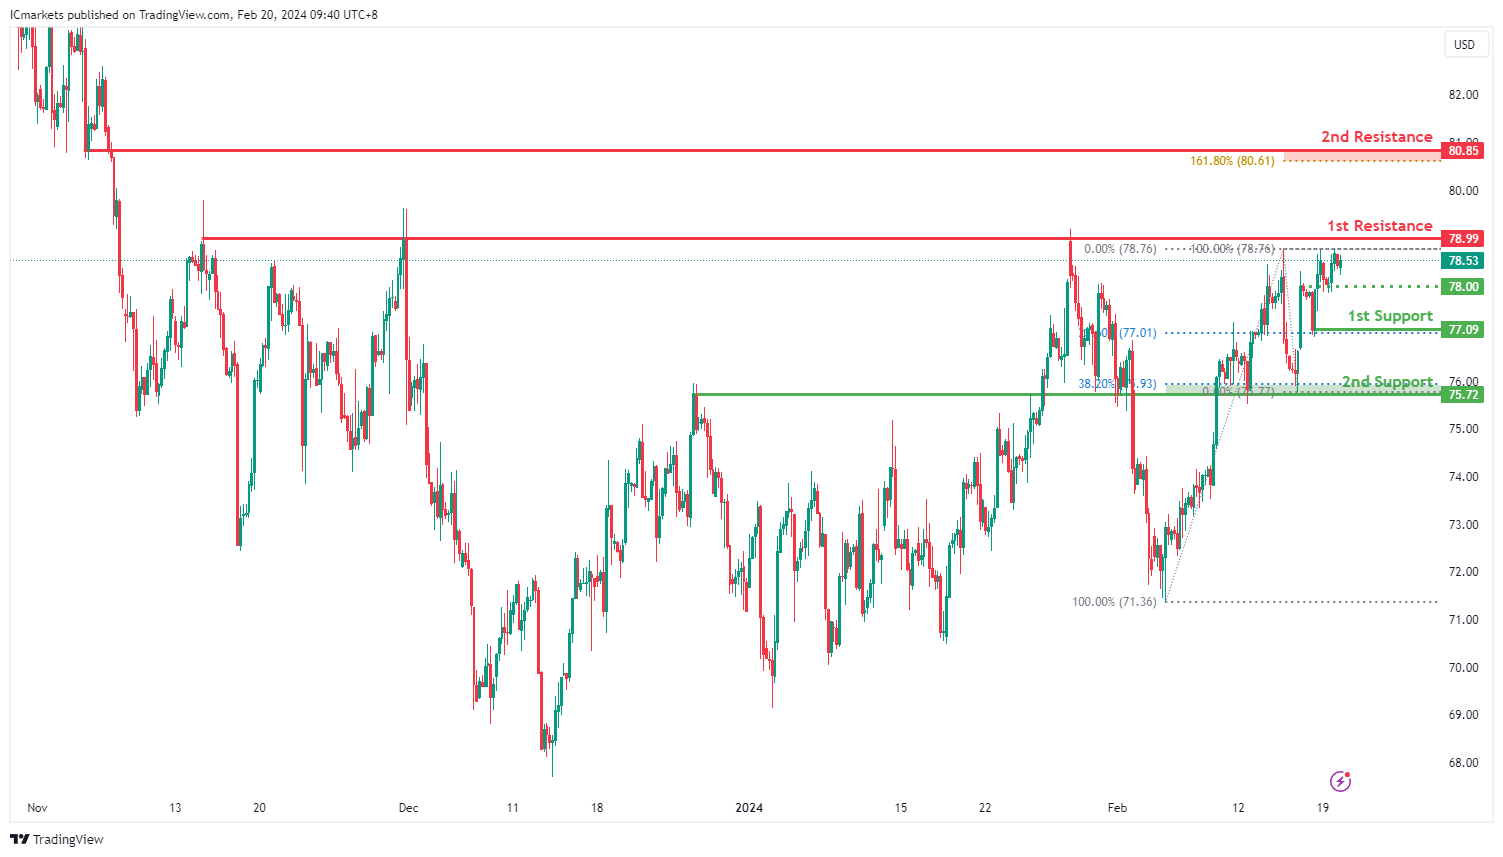
The WTI (West Texas Intermediate) chart currently exhibits an overall bullish momentum. In this context, there is a potential scenario for price to rise towards the 1st resistance.
The 1st resistance level at 78.99 is identified as a multi-swing-high resistance. Higher up, the 2nd resistance level at 80.85 is marked as a pullback resistance that aligns close to the 161.80% Fibonacci Extension level, further highlighting its importance as a potential resistance zone.
To the downside, the intermediate support level at 78.00 is identified as an overlap support while the 1st support level at 77.09 is noted as a pullback support that aligns with the 23.60% Fibonacci Retracement level. Further below, the 2nd support level at 75.72 is marked as an overlap support that aligns close to the 38.20% Fibonacci Retracement level, reinforcing its significance as a key support level.
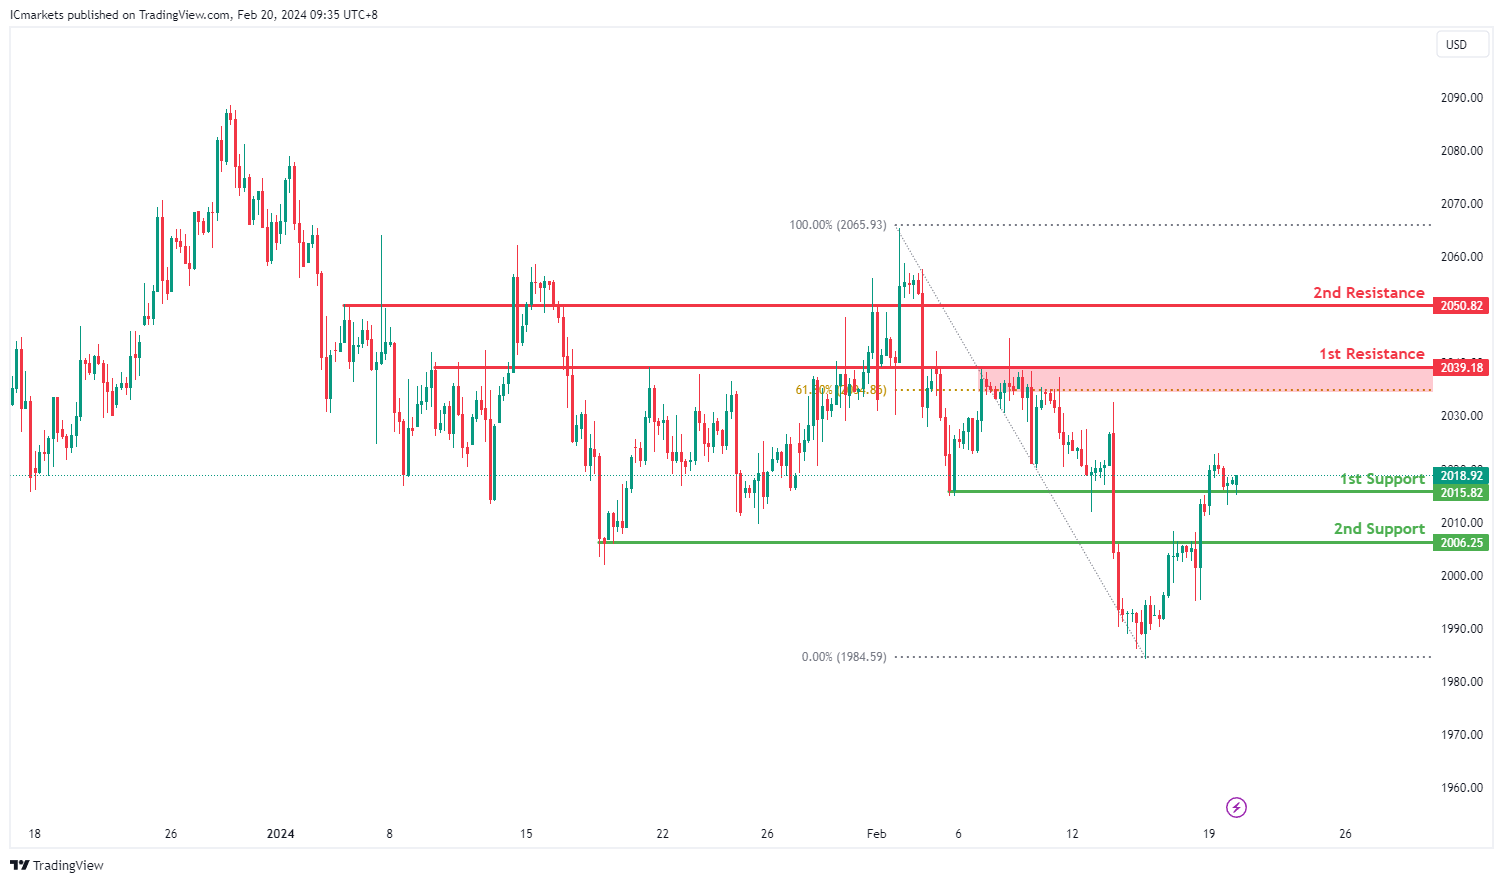
XAU/USD (GOLD):
For XAUUSD, the overall momentum on the chart is bullish, indicating a potential upward movement in prices. Here’s the breakdown of identified levels and reasons supporting this analysis:
The 1st support level is at 2015.82, recognized as an overlap support. This suggests that historically, this level has attracted significant buying interest, potentially leading to a bounce in price.
The 2nd support is at 2006.25, identified as a pullback support. This level aligns with a retracement within the bullish trend, indicating a potential area of buying interest during price pullbacks.
Moving to resistance levels, the 1st resistance stands at 2039.18, noted as an overlap resistance. This level has historically acted as a barrier to upward price movements, and the presence of the 61.80% Fibonacci Retracement adds further significance to this resistance zone.
The 2nd resistance is at 2050.82, characterized as a pullback resistance. This suggests that within the bullish trend, this level may attract selling interest during price retracements.


