
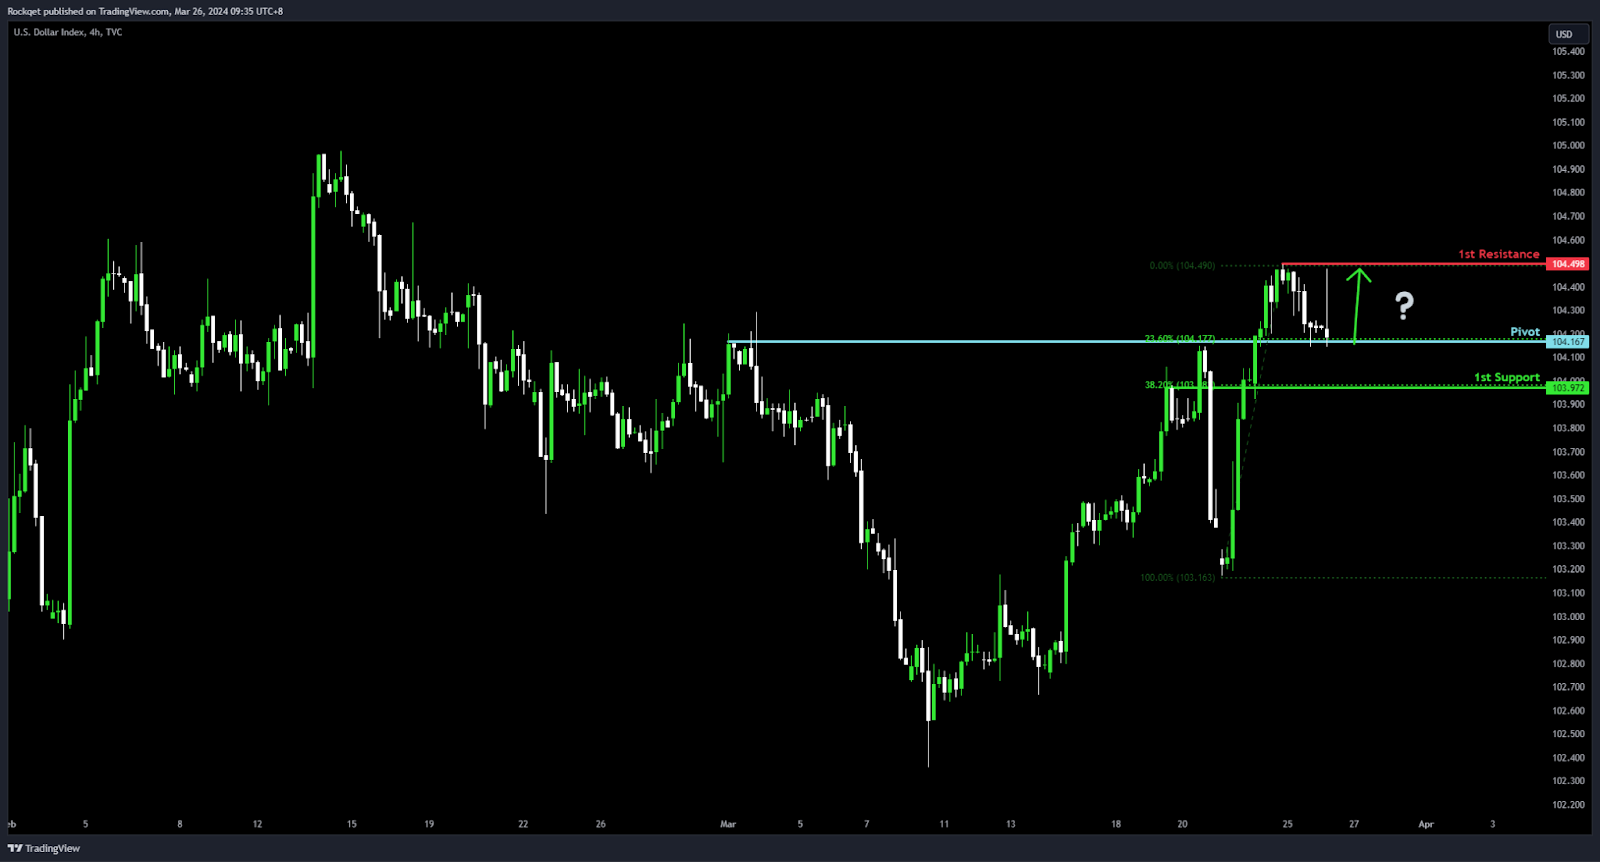
DXY:
Potential Direction: Bullish
Overall momentum of the chart: Bullish
Price could potentially make a Bullish bounce off pivot and head towards 1st resistance
Pivot: 104.16
Supporting reasons: Acts as an Overlap support and aligns with a 23.60% Fibonacci Retracement, providing a strong base for potential upward movements.
1st support: 103.92
Supporting reasons: Offers Pullback support at a 38.20% Fibonacci Retracement level, representing a key area where previous buying interest has successfully countered downward trends
1st resistance: 104.49
Supporting reasons: Serves as Multi-swing high resistance, posing a significant hurdle that needs to be overcome for the bullish momentum to continue.
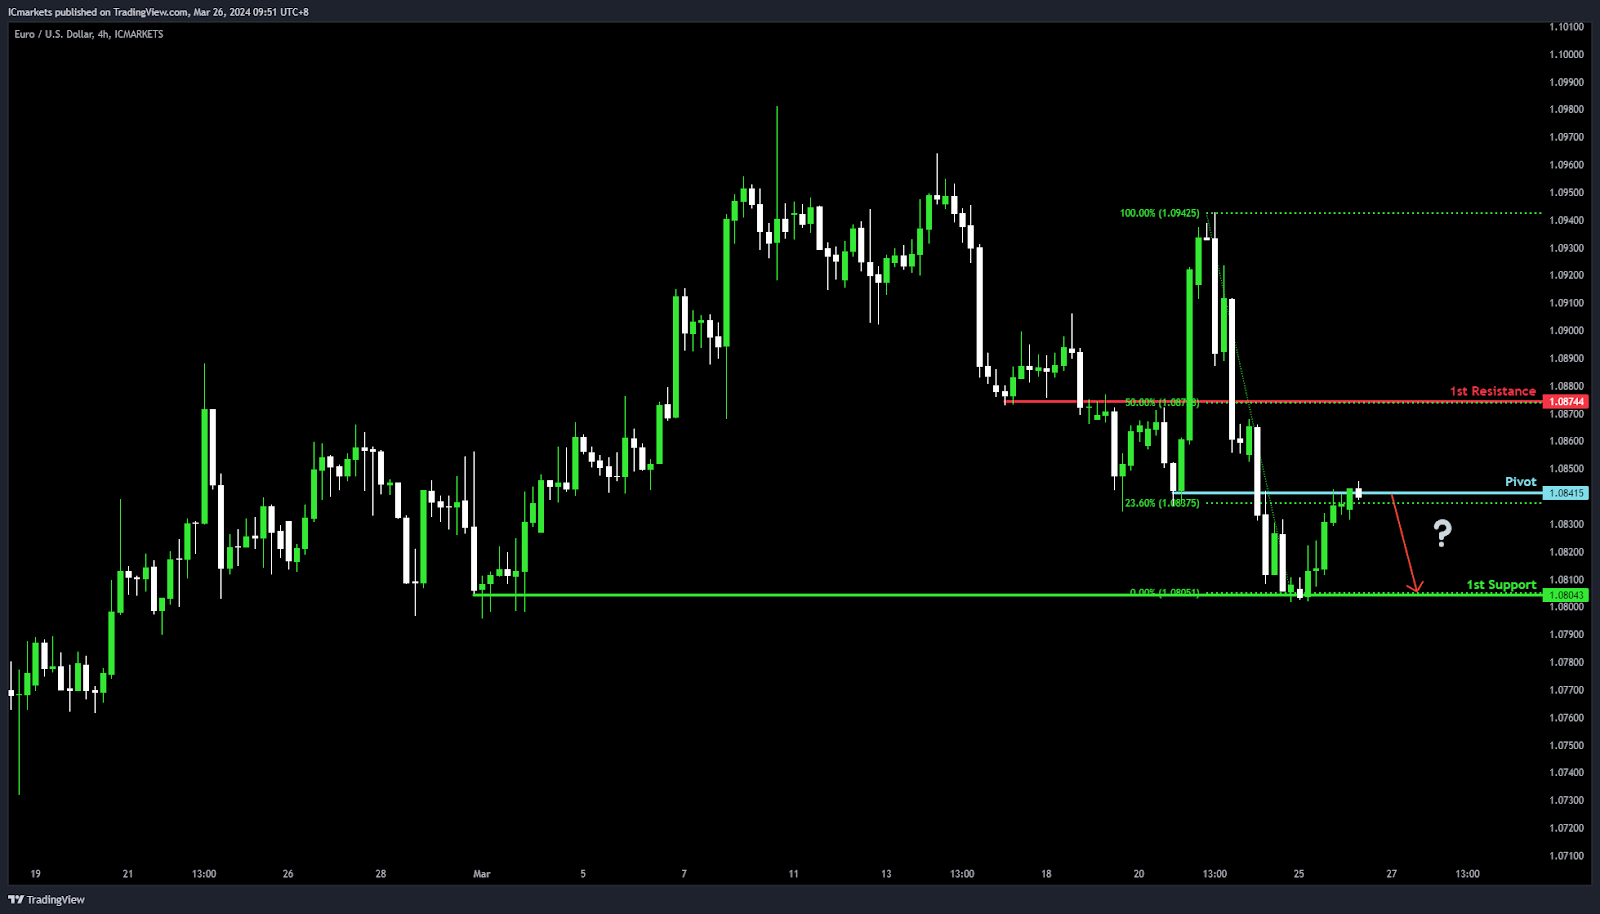
EUR/USD:
Potential Direction: Bearish
Overall momentum of the chart: Bearish
Price could potentially make a Bearish reaction off pivot and drop to 1st support
Pivot: 1.0841
Supporting reasons: Identified as an Overlap resistance, indicating a crucial level where selling pressure may intensify, pushing the price downwards as traders react to this technical barrier.
1st support: 1.0804
Supporting reasons: Acts as a Multi-swing low support, marking a significant floor where the market has previously found stability and buyers have entered, potentially halting further declines.
1st resistance: 1.0874
Supporting reasons: Serves as Pullback resistance, complemented by a 50% Fibonacci Retracement, highlighting a pivotal area where the upward movement might face resistance, making it a critical point for bearish trend continuation.
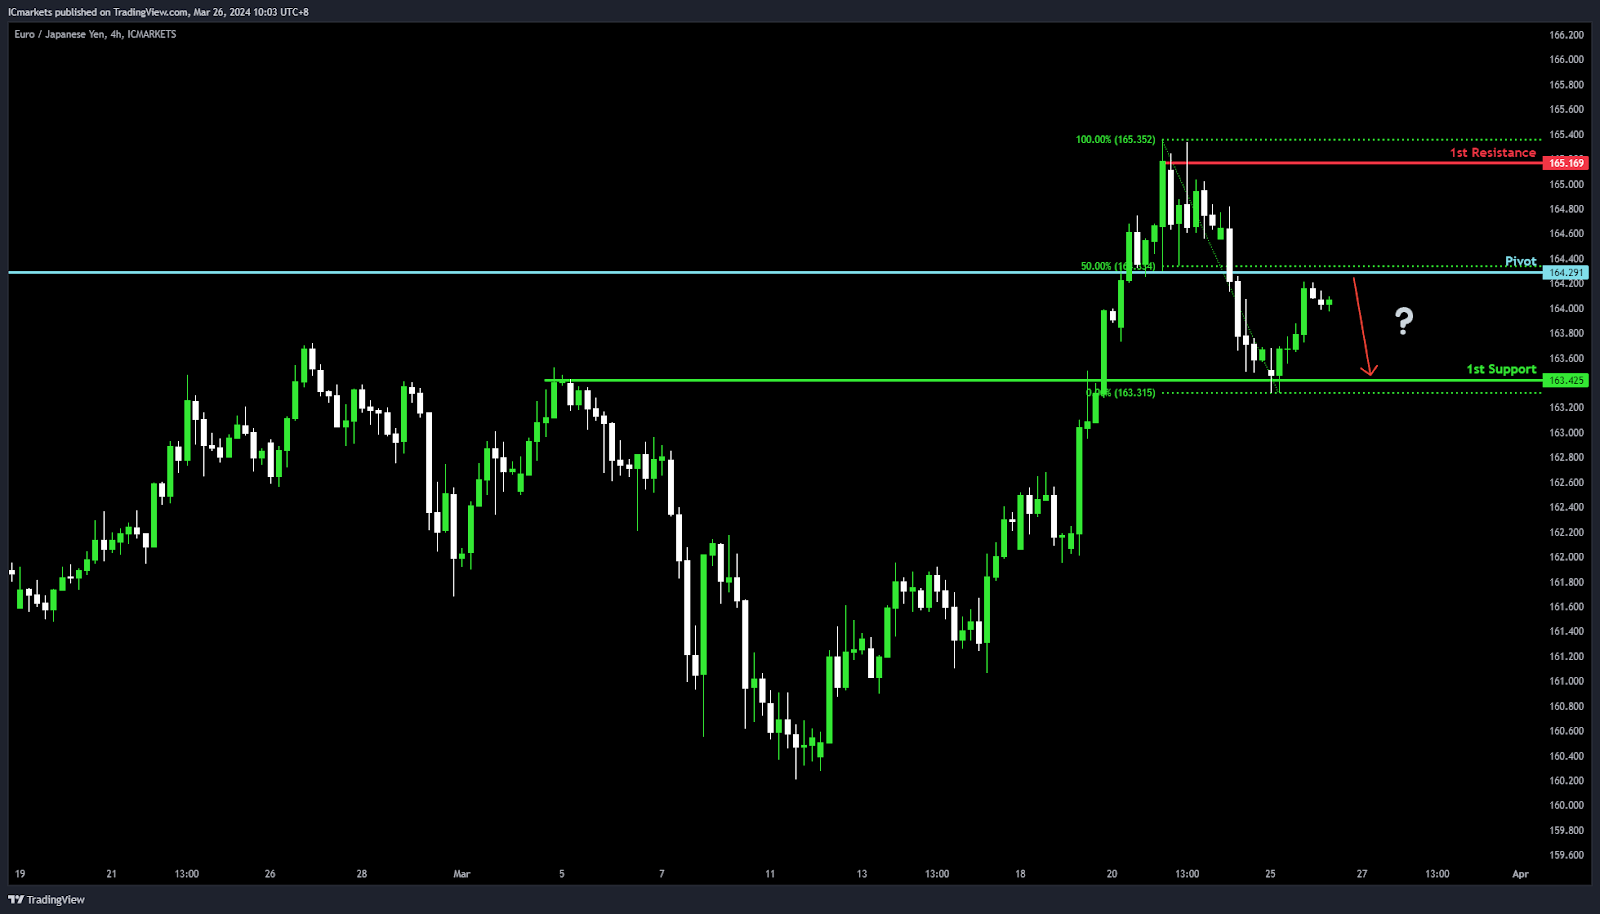
EUR/JPY:
Potential Direction: Bearish
Overall momentum of the chart: Bullish
Price could potentially make a: Bearish reaction off pivot and drop to 1st support
Pivot: 164.29
Supporting reasons: Acts as Pullback resistance and aligns with a 50% Fibonacci Retracement, marking a key point where sellers might start pushing prices down, indicating a possible shift in price direction.
1st support: 163.42
Supporting reasons: Serves as an Overlap support, a crucial area where buyers have historically stepped in, suggesting a strong base that could halt the bearish momentum.
1st resistance: 165.16
Supporting reasons: Characterized by Multi-swing high resistance, a significant barrier that has previously capped upward movements, making it a pivotal point for monitoring potential reversals or continuations of the bullish trend.
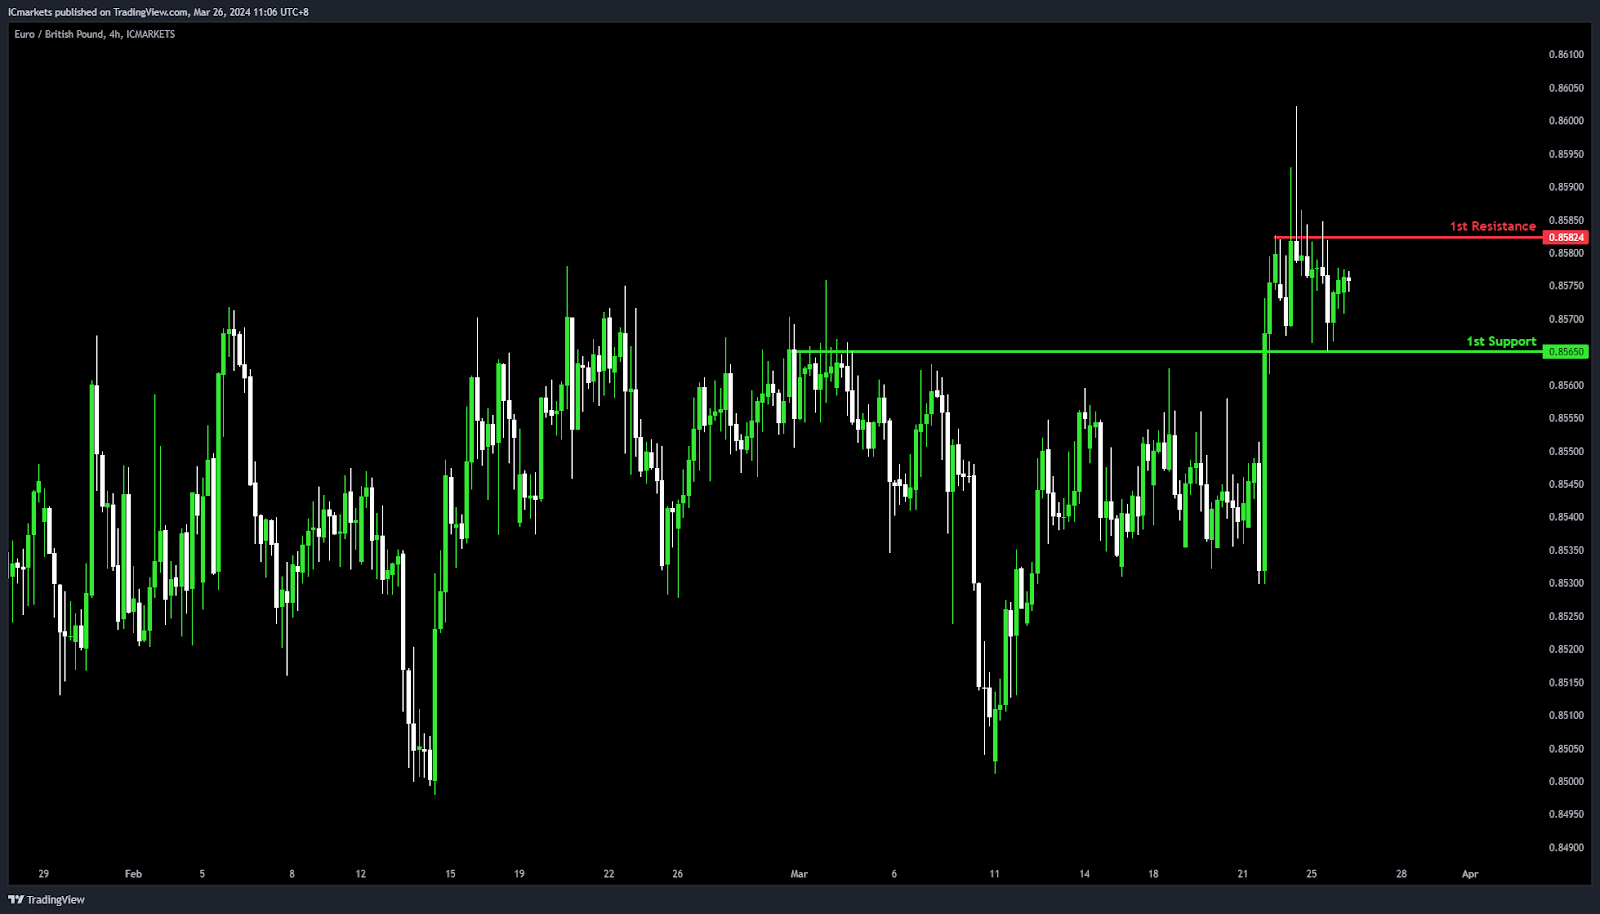
EUR/GBP:
Potential Direction: Neutral
Overall momentum of the chart: Neutral
Price could potentially make a: Fluctuation between the 1st resistance and 1st support level.
1st support: 0.8565
Supporting reasons: Acts as an Overlap support, a key level where buying interest has historically been strong enough to stop further declines and potentially initiate a bounce, indicating its role as a solid base for the price.
1st resistance: 0.8582
Supporting reasons: Characterized by Multi-swing high resistance, marking a significant ceiling that has previously limited upward movements, highlighting its importance as a potential turning point for the price, possibly capping gains and maintaining the current range.
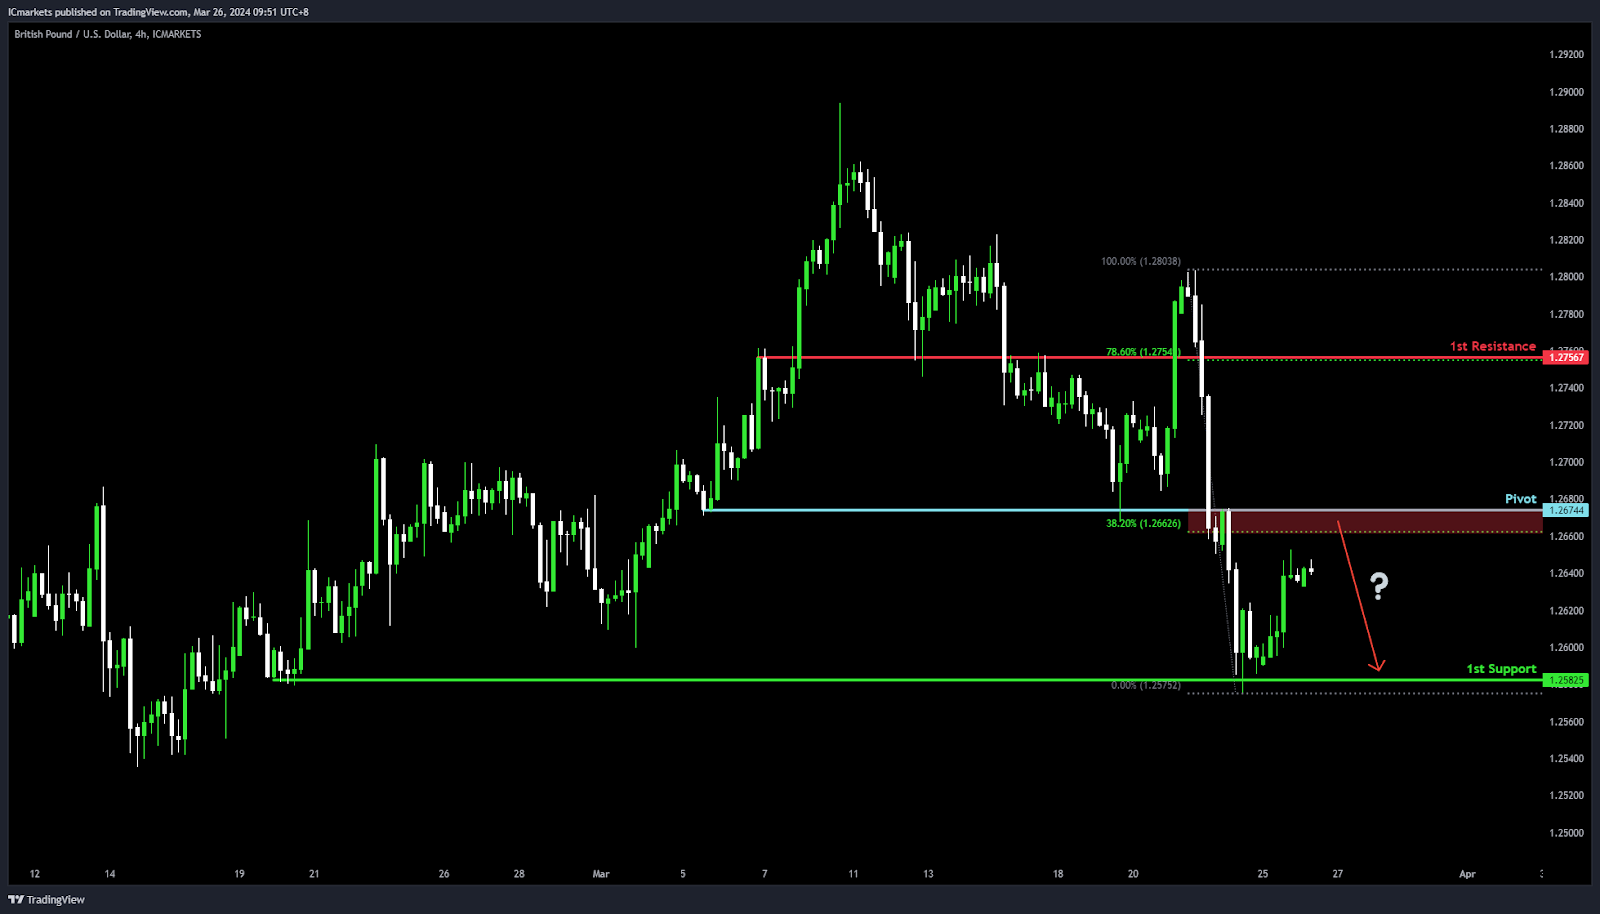
GBP/USD:
Potential Direction: Bearish
Overall momentum of the chart: Bearish
Price could potentially make a: Bearish reaction off pivot and drop to 1st support
Pivot: 1.2674
Supporting reasons: Serves as an Overlap resistance and aligns with a 38.20% Fibonacci Retracement, making it a key level where sellers could gain an upper hand, driving the price lower as it acts as a technical barrier to upward movements.
1st support: 1.2582
Supporting reasons: Identified as Multi-swing low support, this level represents a significant historical floor where buying interest has previously emerged to stall further declines, suggesting it could once again provide a basis for a potential rebound or slow down the bearish momentum.
1st resistance: 1.2756
Supporting reasons: Functions as Pullback resistance, reinforced by a 78.60% Fibonacci Retracement. This delineates a critical threshold that, if unbroken, could cement the bearish outlook.
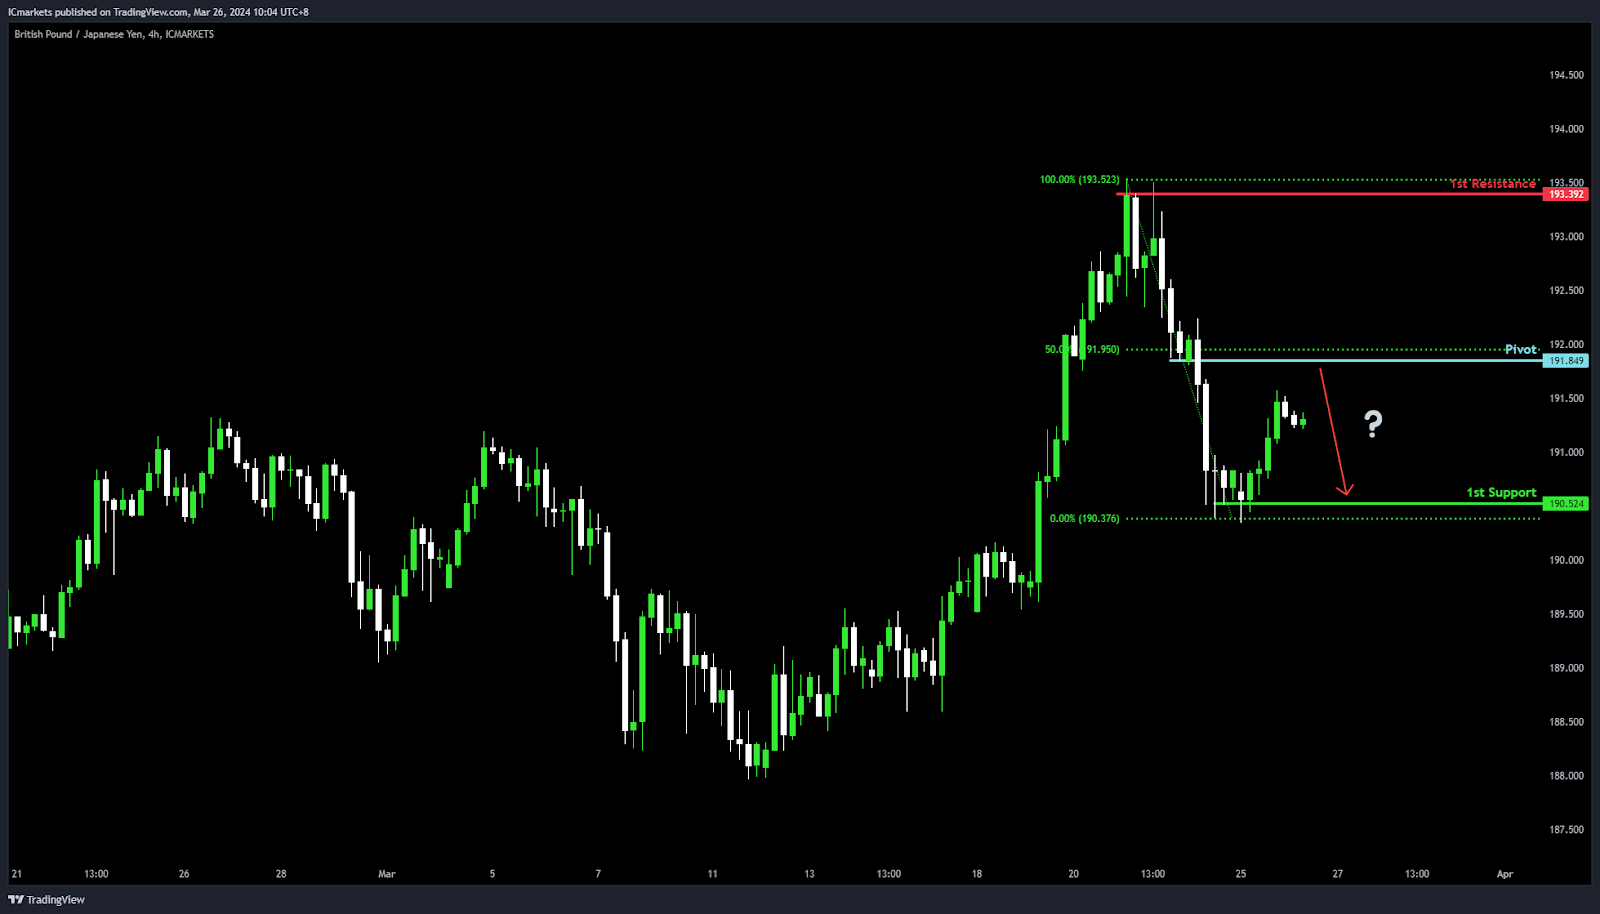
GBP/JPY:
Potential Direction: Bearish
Overall momentum of the chart: Bullish
Price could potentially make a: Bearish reaction off pivot and drop to 1st support
Pivot: 191.84
Supporting reasons: Acts as Pullback resistance with a 50% Fibonacci Retracement, marking a key level where sellers might start pushing prices down, showing it’s an important spot for possible changes in how the price moves.
1st support: 190.52
Supporting reasons: Serves as Multi-swing low support, a strong area that could stop the price from falling further, indicating it’s a crucial base for potentially halting the bearish momentum.
1st resistance: 193.39
Supporting reasons: Known as Multi-swing high resistance, a level that has previously stopped the price from climbing higher, marking it as a significant barrier for price movements.
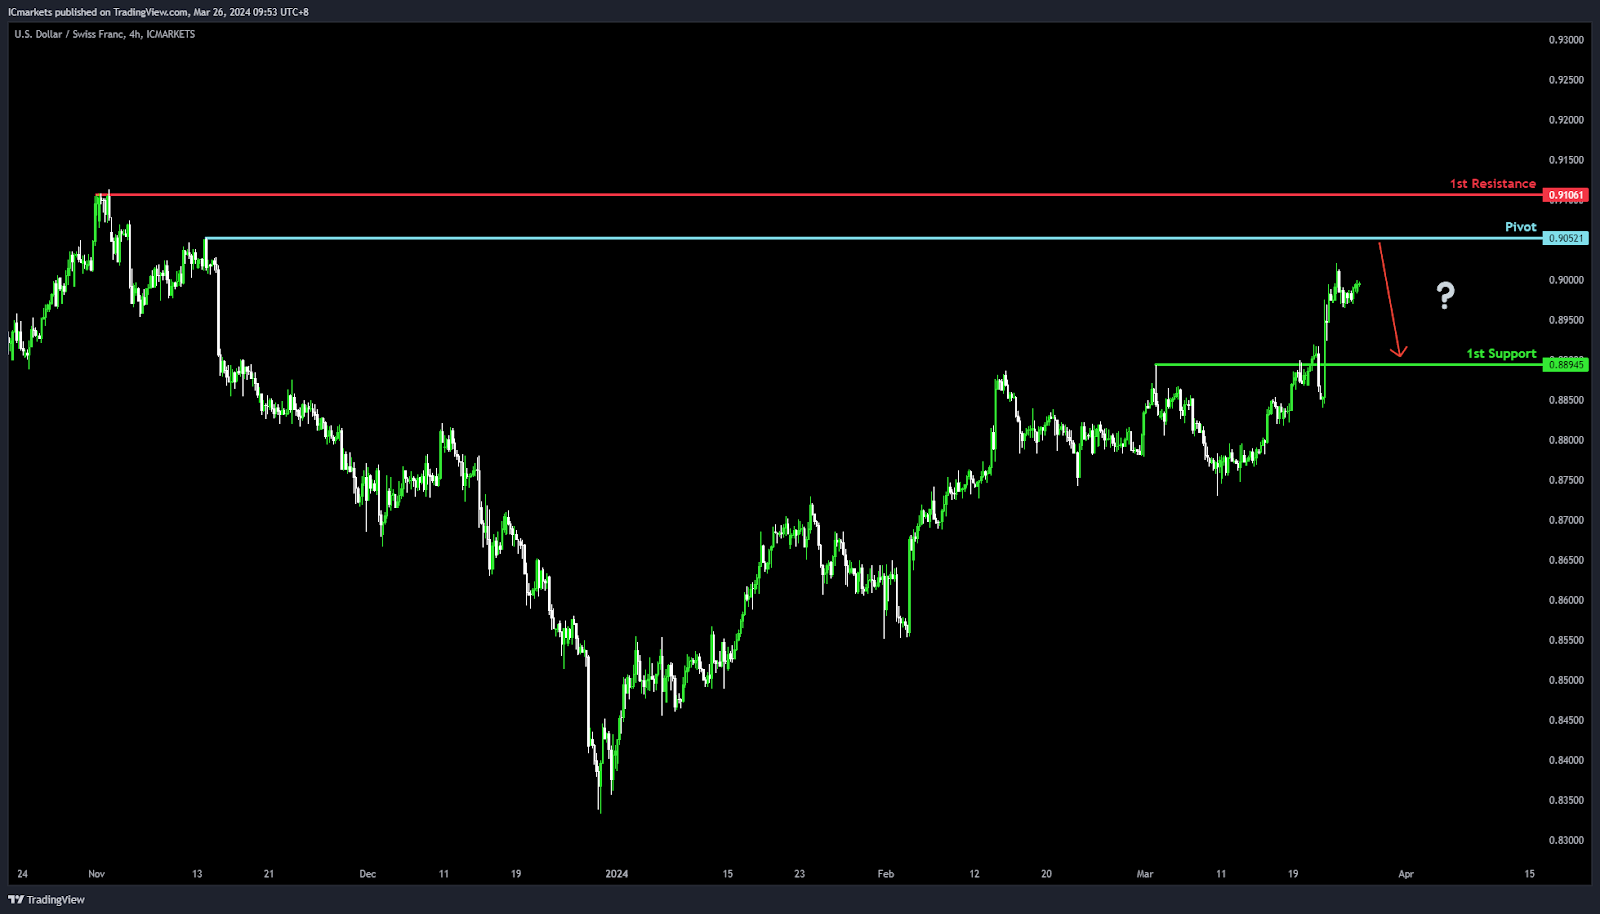
USD/CHF:
Potential Direction Bearish
Overall momentum of the chart Bullish
Price could potentially make a bearish reaction off pivot and drop to 1st support
Pivot 0.9052
Supporting reasons: Swing high resistance, marking a significant level where the price has previously encountered resistance, potentially triggering a reversal or halt in upward momentum
1st support 0.8894
Supporting reasons: Pullback support, indicating a level where the market has found support in the past, offering a potential area for price stabilization or a rebound after a decline
1st Resistance 0.9106
Supporting reasons: Multi-swing high resistance, highlighting a critical barrier that has capped previous attempts to push higher, making it a pivotal point for monitoring potential bearish reversals or continuation of the bullish trend
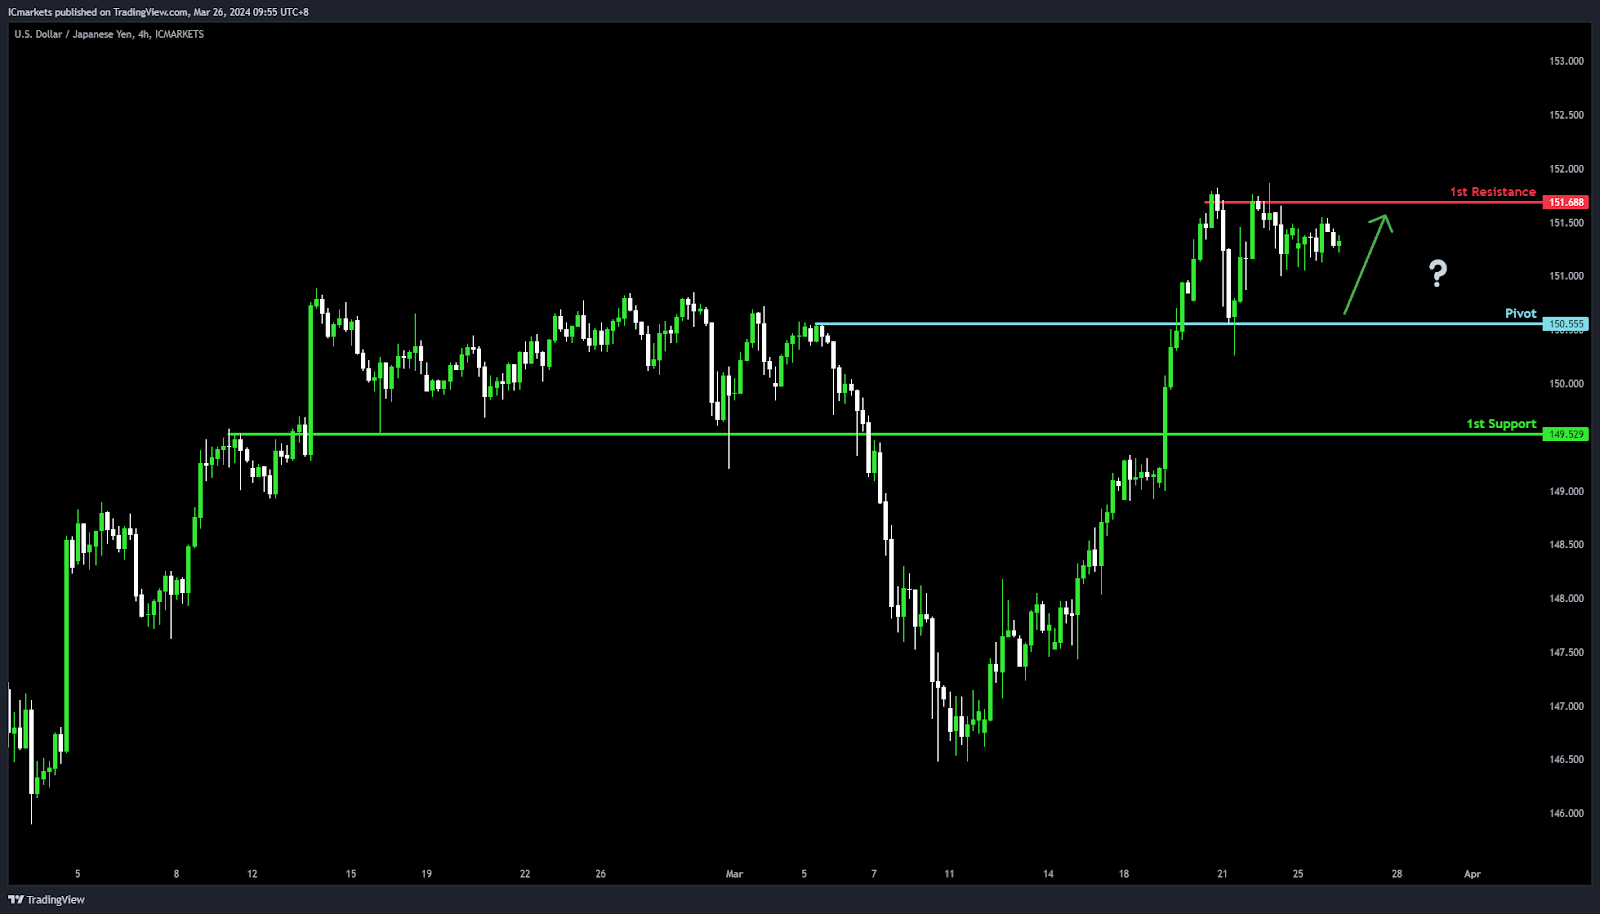
USD/JPY:
Potential Direction: Bullish
Overall momentum of the chart: Bullish
Price could potentially make a bullish bounce-off pivot and head toward 1st resistance
Pivot: 150.55
Supporting reasons: An Overlap support, indicating a level where buying interest is typically strong, suggesting a solid foundation for a potential upward move
1st support: 149.52
Supporting reasons: Pullback support, represents a key area where the market has historically found buyers ready to step in, highlighting its importance for sustaining bullish momentum
1st resistance: 151.68
Supporting reasons: Multi-swing high resistance, marking a significant barrier that has previously capped upward movements, making it a critical point for bulls to overcome for a continued bullish
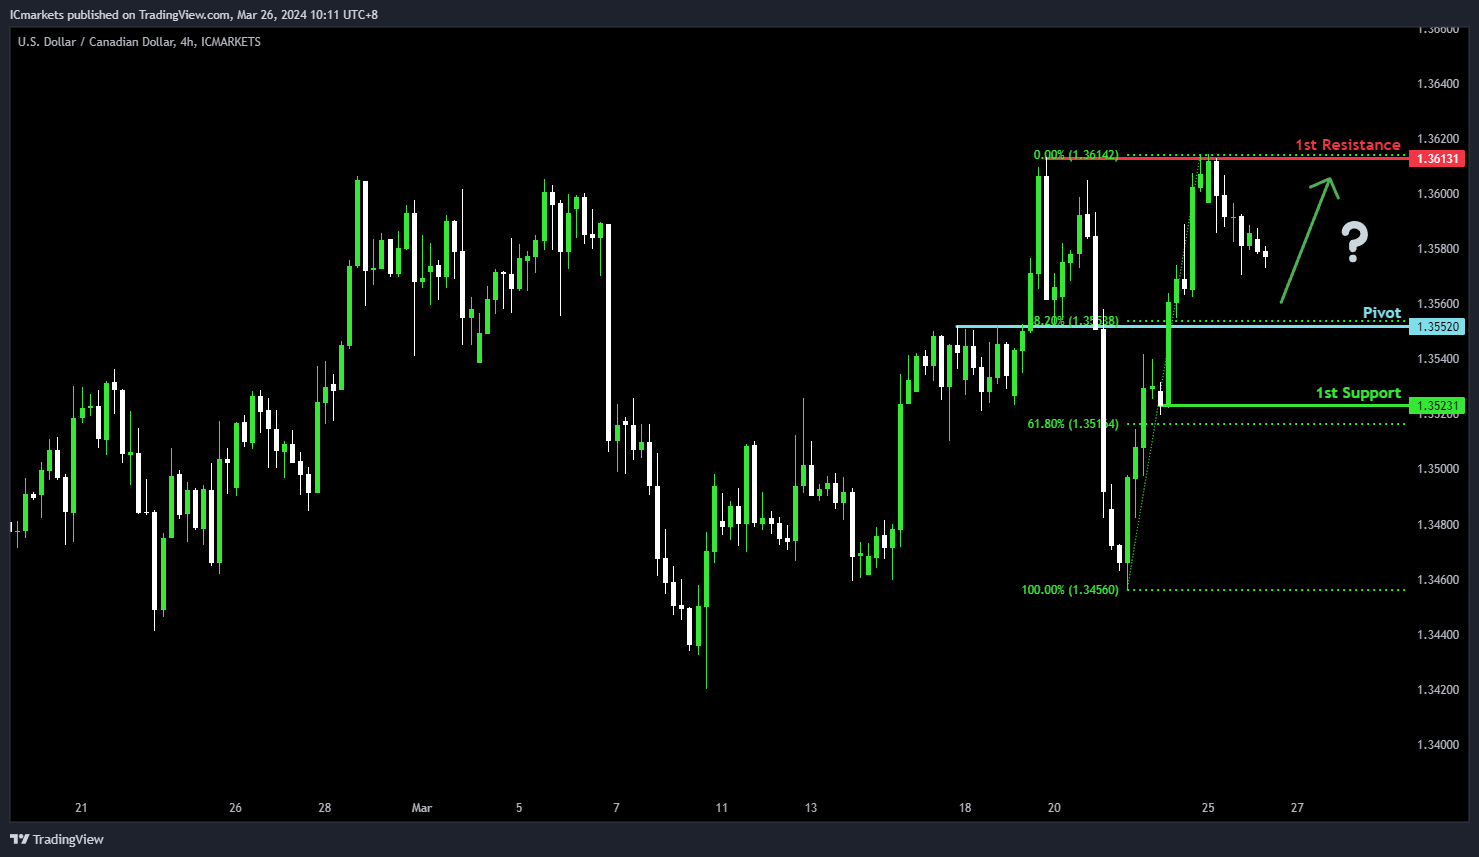
USD/CAD:
Potential Direction: Medium Bearish
Overall momentum of the chart: Bullish
Price could potentially fall towards the pivot and make a bullish bounce to rise towards the 1st resistance.
Pivot: 1.3552
Supporting reasons: This level acts as an overlap support that aligns close to a 38.20% Fibonacci retracement, potentially initiating a bullish reversal if the level holds as support.
1st Support: 1.3523
Supporting reasons: This level acts as a pullback support that aligns close to a 61.80% Fibonacci retracement, indicating a level where price has found strong support in the past.
1st Resistance: 1.3613
Supporting reasons: This level is identified as a multi-swing-high resistance, aligning with a 78.60% Fibonacci retracement, marking it as a critical threshold for bullish momentum to overcome; resistance at this level could cap further upside movements.
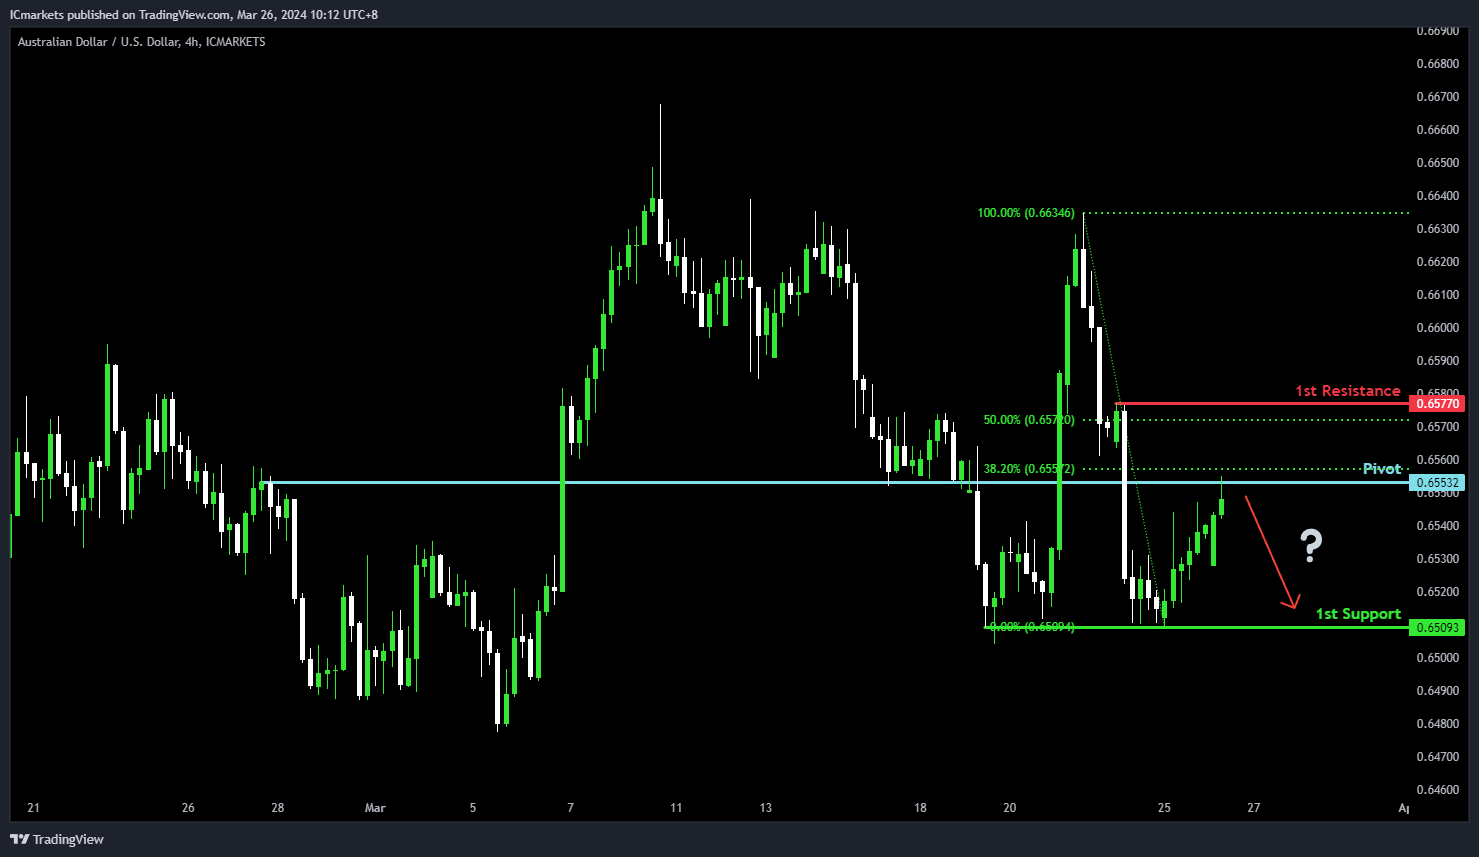
AUD/USD:
Potential Direction: Medium Bullish
Overall momentum of the chart: Bearish
Price could potentially rise toward the pivot to make a bearish reaction and then drop towards the 1st support.
Pivot: 0.6553
Supporting reasons: This level acts as an overlap resistance that aligns close to the 38.20% Fibonacci retracement, potentially initiating a bearish reversal if the level holds as resistance.
1st Support: 0.6509
Supporting reasons: This level acts as a pullback support, indicating a level where price has found strong support in the past.
1st Resistance: 0.6577
Supporting reasons: This level is identified as a pullback resistance that aligns close to a 50.0% Fibonacci retracement, marking it as a critical threshold for bullish momentum to overcome; resistance at this level could cap further upside movements.
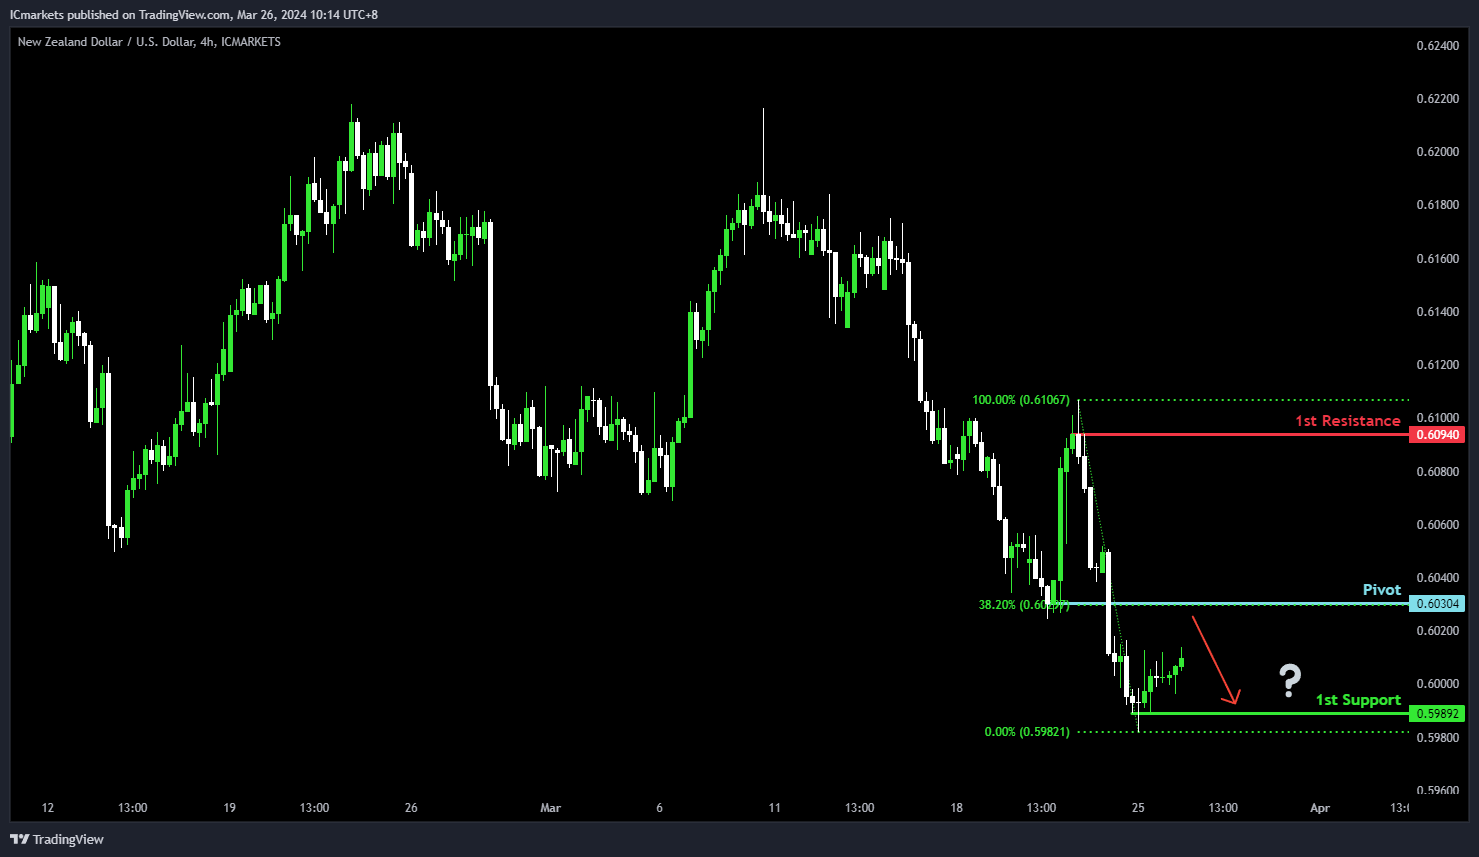
NZD/USD
Potential Direction: Weak Bullish
Overall momentum of the chart: Bearish
Price could potentially rise toward the pivot to make a bearish reaction and then drop towards the 1st support.
Pivot: 0.6030
Supporting reasons: This level acts as a pullback resistance that aligns with the 38.20% Fibonacci retracement, potentially initiating a bearish reversal if the level holds as resistance.
1st Support: 0.5989
Supporting reasons: This level acts as a pullback support, indicating a level where price has found strong support in the past.
1st Resistance: 0.6094
Supporting reasons: This level is identified as a pullback resistance, marking it as a critical threshold for bullish momentum to overcome; resistance at this level could cap further upside movements.
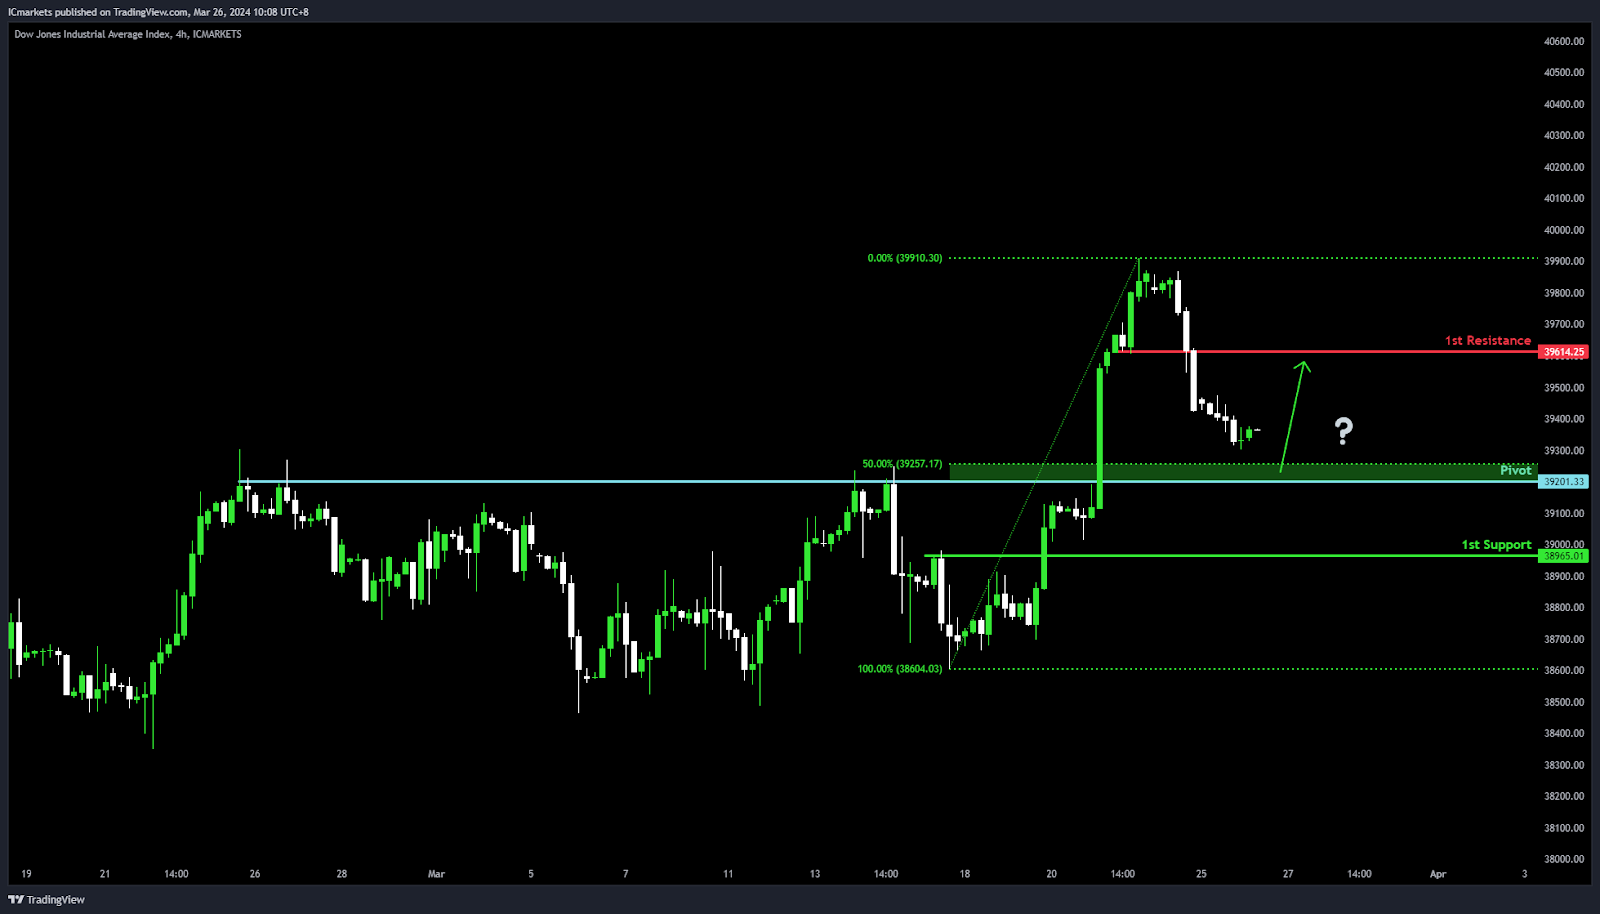
DJ30:
Potential Direction: Weak Bullish
Overall momentum of the chart: Bullish
Price could potentially make a bullish reaction off the pivot and rise towards the 1st resistance
Pivot: 39,201.33
Supporting reasons: This level acts as a pullback support, potentially initiating a bullish reversal if the level holds as support.
1st Support: 38,965.01
Supporting reasons: This level acts as a pullback support, indicating a level where price has found strong support in the past.
1st Resistance: 39,614.25
Supporting reasons: This level is identified as a pullback resistance, marking it as a critical threshold for bullish momentum to overcome; resistance at this level could cap further upside movements.
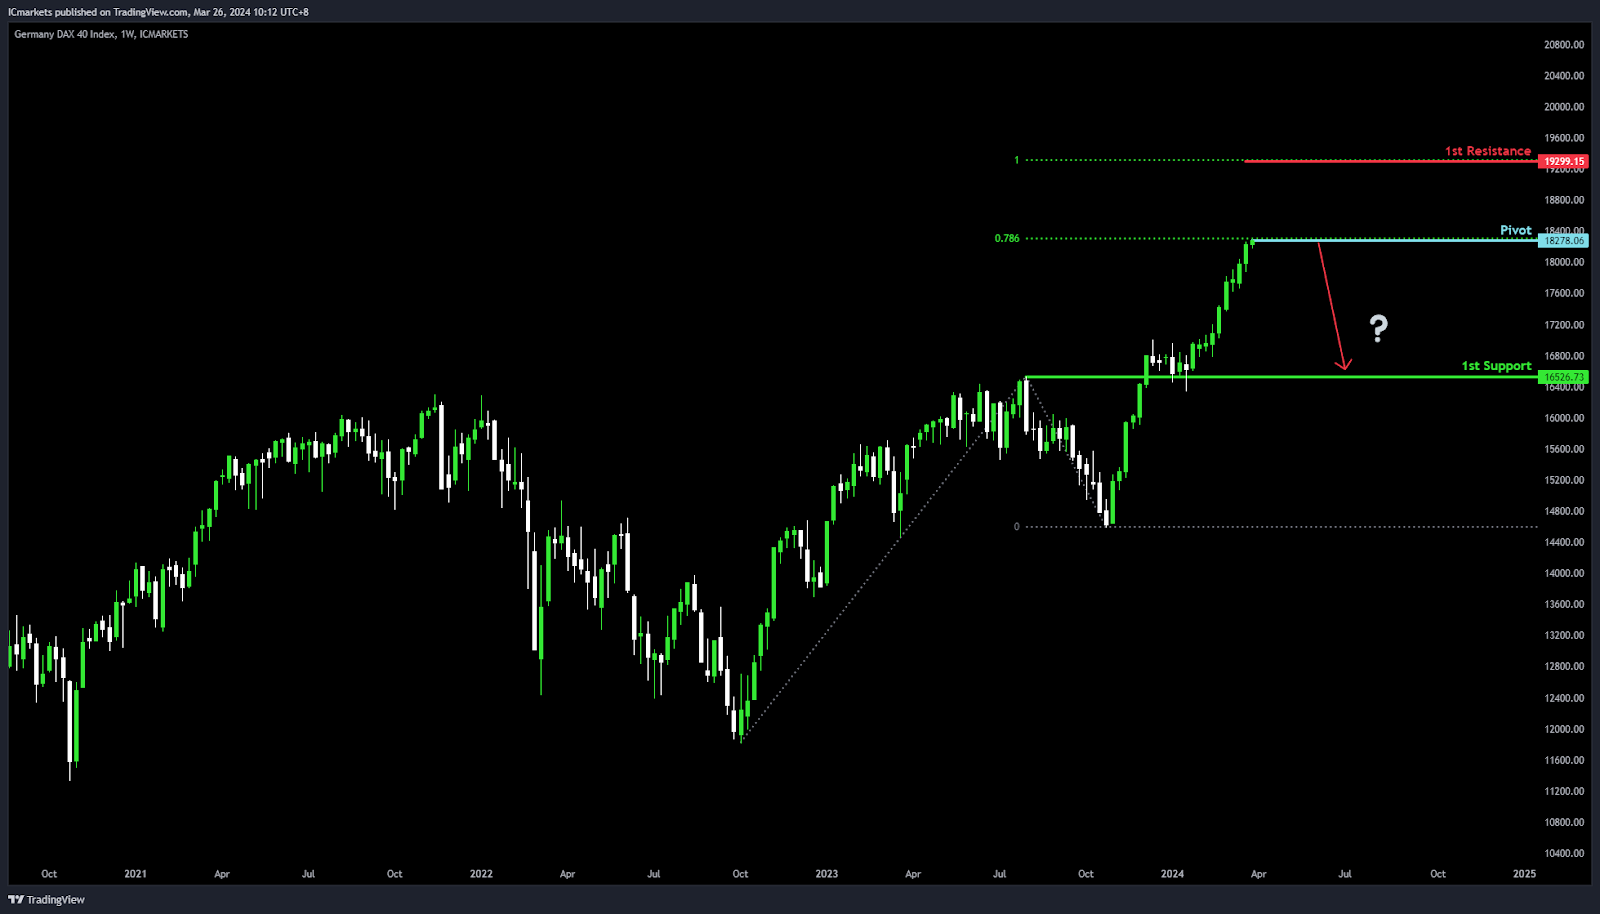
GER40:
Potential Direction: Weak Bearish
Overall momentum of the chart: Bullish
Price could potentially rise toward the pivot to make a bearish reaction and then drop towards the 1st support.
Pivot: 18,278.06
Supporting reasons: This level acts as a pullback resistance that aligns with a 78.60% Fibonacci projection, potentially initiating a bearish reversal if the level holds as resistance.
1st Support: 16,526.73
Supporting reasons: This level acts as an overlap support, indicating a level where price has found strong support in the past.
1st Resistance: 19,299.15
Supporting reasons: This level is identified as a resistance level that aligns with a 100.00% Fibonacci projection, marking it as a critical threshold for bullish momentum to overcome; resistance at this level could cap further upside movements.
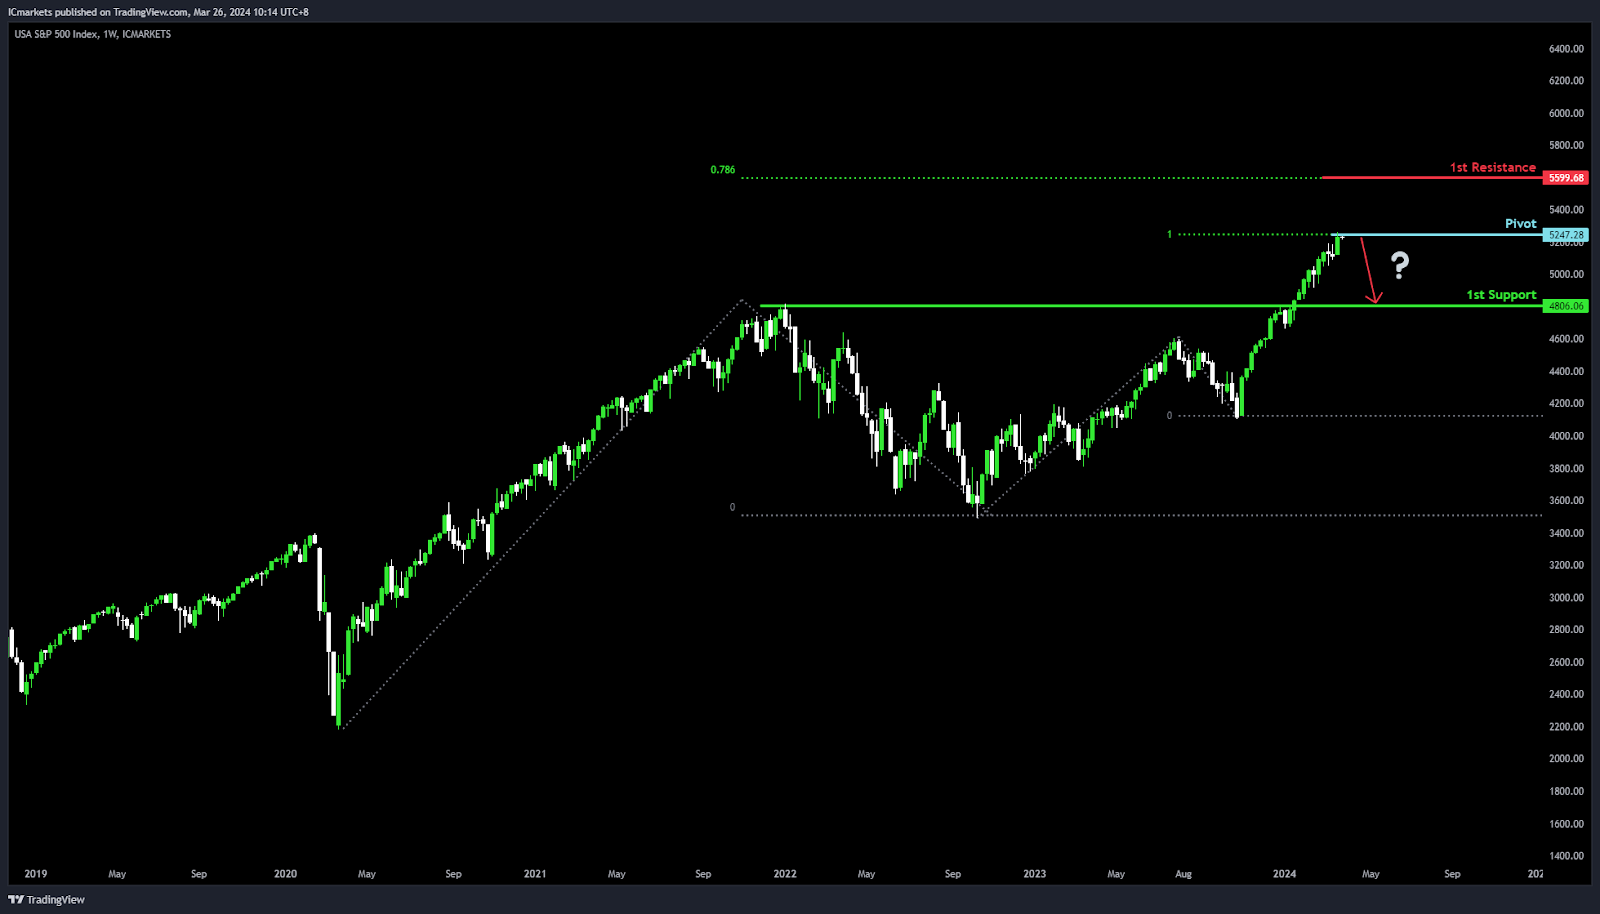
US500:
Potential Direction: Weak Bearish
Overall momentum of the chart: Bullish
Price could potentially rise toward the pivot to make a bearish reaction and then drop towards the 1st support.
Pivot: 5,247.28
Supporting reasons: This level acts as a pullback resistance that aligns with a 100.00% Fibonacci projection, potentially initiating a bearish reversal if the level holds as resistance.
1st Support: 4,806.06
Supporting reasons: This level acts as a pullback support, indicating a level where price has found strong support in the past.
1st Resistance: 5,599.68
Supporting reasons: This level is identified as a resistance level that aligns with a 78.60% Fibonacci projection, marking it as a critical threshold for bullish momentum to overcome; resistance at this level could cap further upside movements.
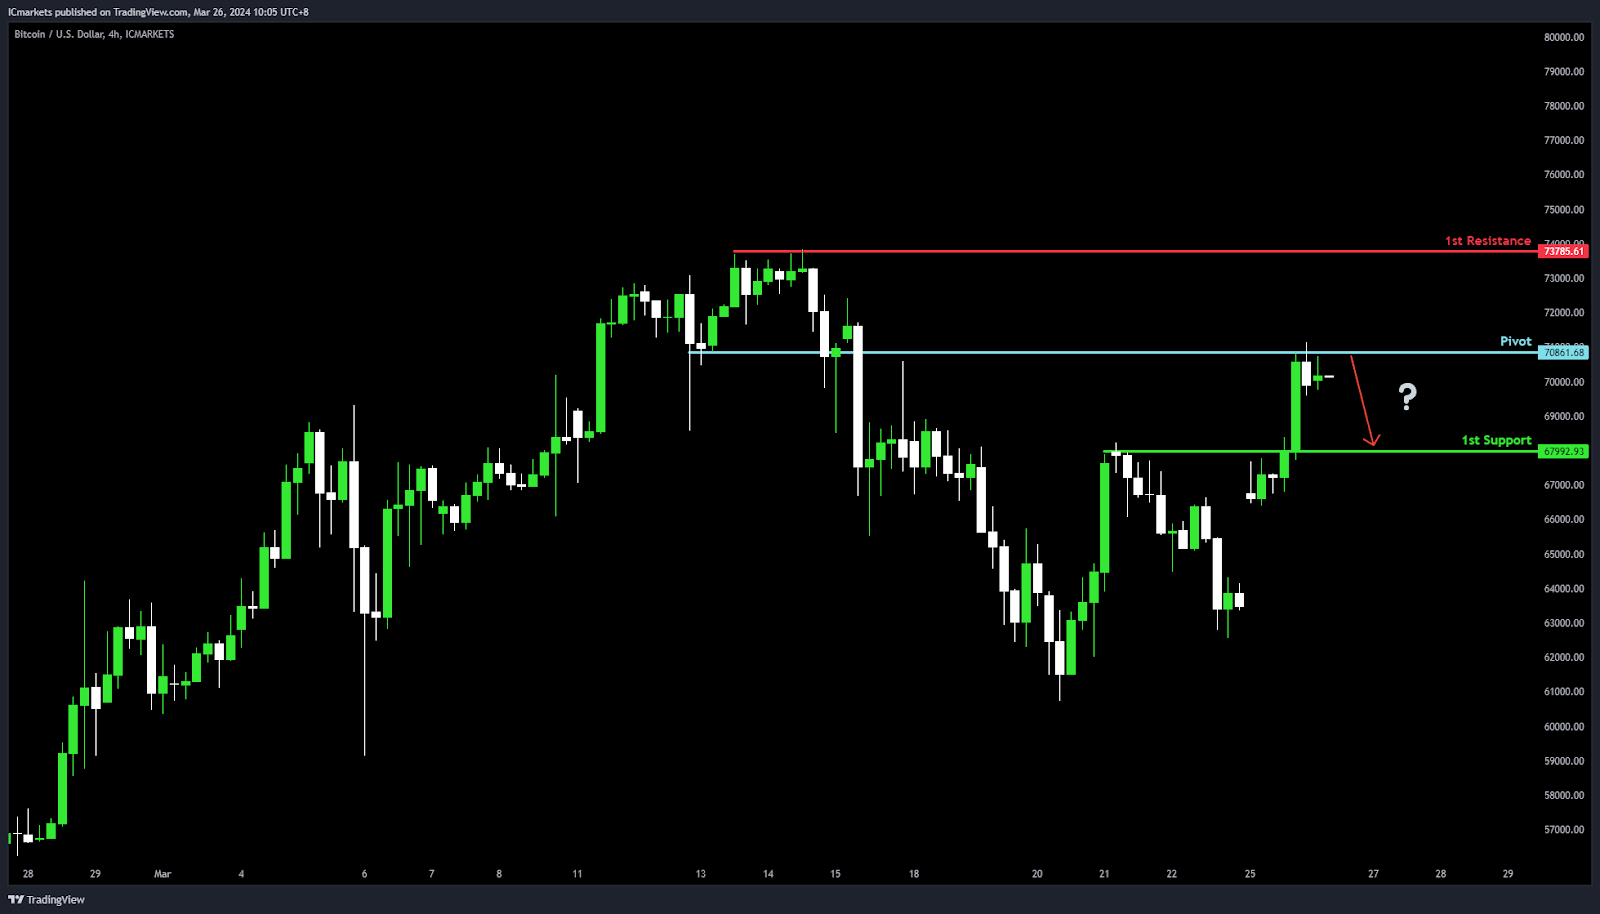
BTC/USD:
Potential Direction: Weak Bearish
Overall momentum of the chart: Bullish
Price could potentially rise toward the pivot to make a bearish reaction and then drop towards the 1st support.
Pivot: 70,861.68
Supporting reasons: This level acts as an overlap resistance, potentially initiating a bearish reversal if the level holds as resistance.
1st Support: 67,992.93
Supporting reasons: This level acts as a pullback support, indicating a level where price has found strong support in the past.
1st Resistance: 73,785.61
Supporting reasons: This level is identified as a swing-high resistance at the all-time high marking it as a critical threshold for bullish momentum to overcome; resistance at this level could cap further upside movements.
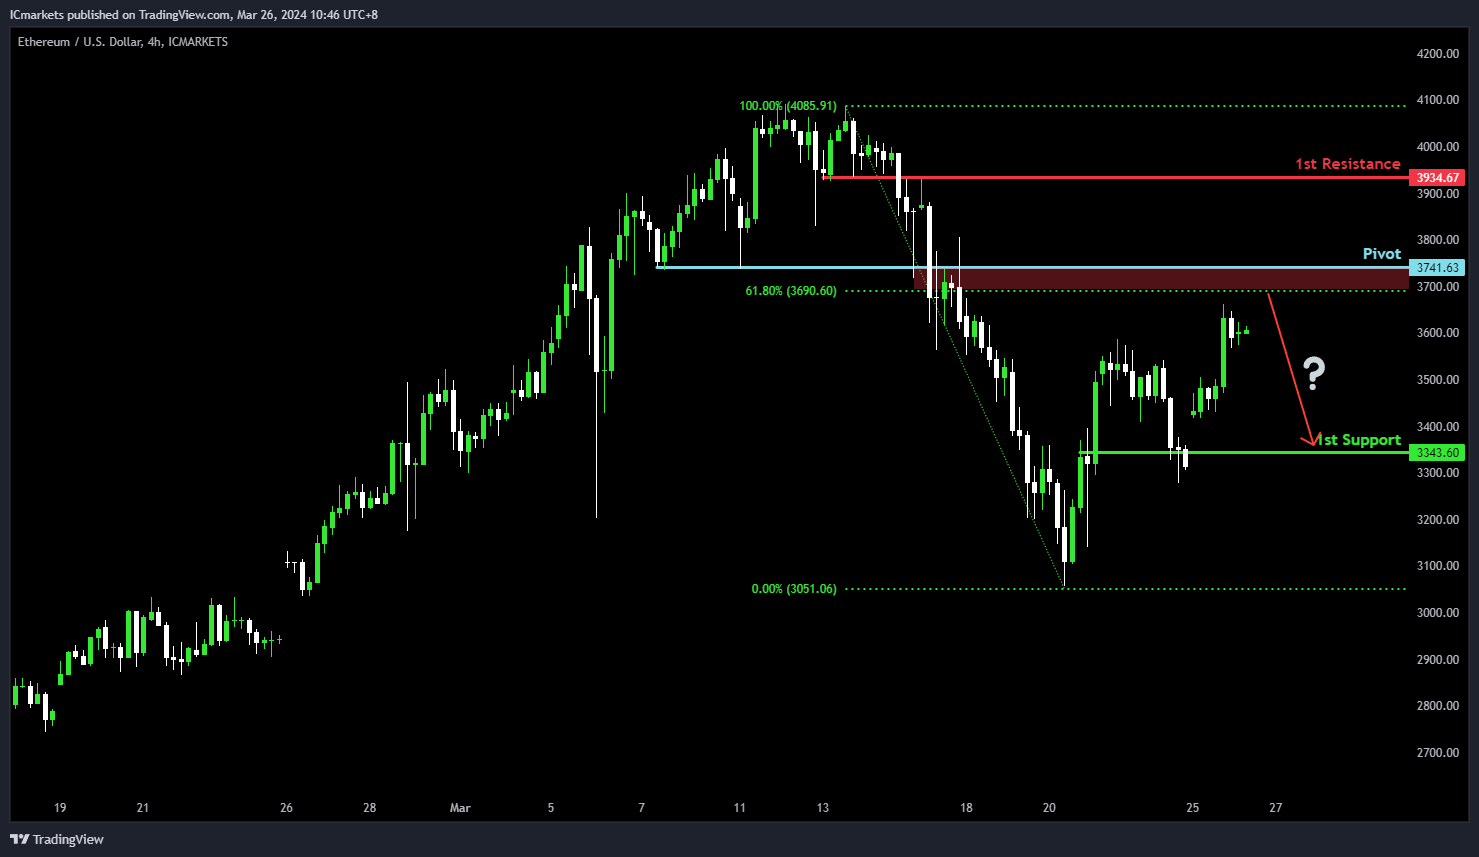
ETH/USD:
Potential Direction: Weak Bearish
Overall momentum of the chart: Bullish
Price could potentially rise toward the pivot to make a bearish reaction and then drop towards the 1st support.
Pivot: 3,741.63
Supporting reasons: This level acts as an overlap resistance that aligns close to a 61.80% Fibonacci retracement, potentially initiating a bearish reversal if the level holds as resistance.
1st Support: 3,343.60
Supporting reasons: This level acts as a pullback support, indicating a level where price has found strong support in the past.
1st Resistance: 3,934.64
Supporting reasons: This level is identified as an overlap resistance, aligning close to a 50.00% Fibonacci retracement, marking it as a critical threshold for bullish momentum to overcome; resistance at this level could cap further upside movements.
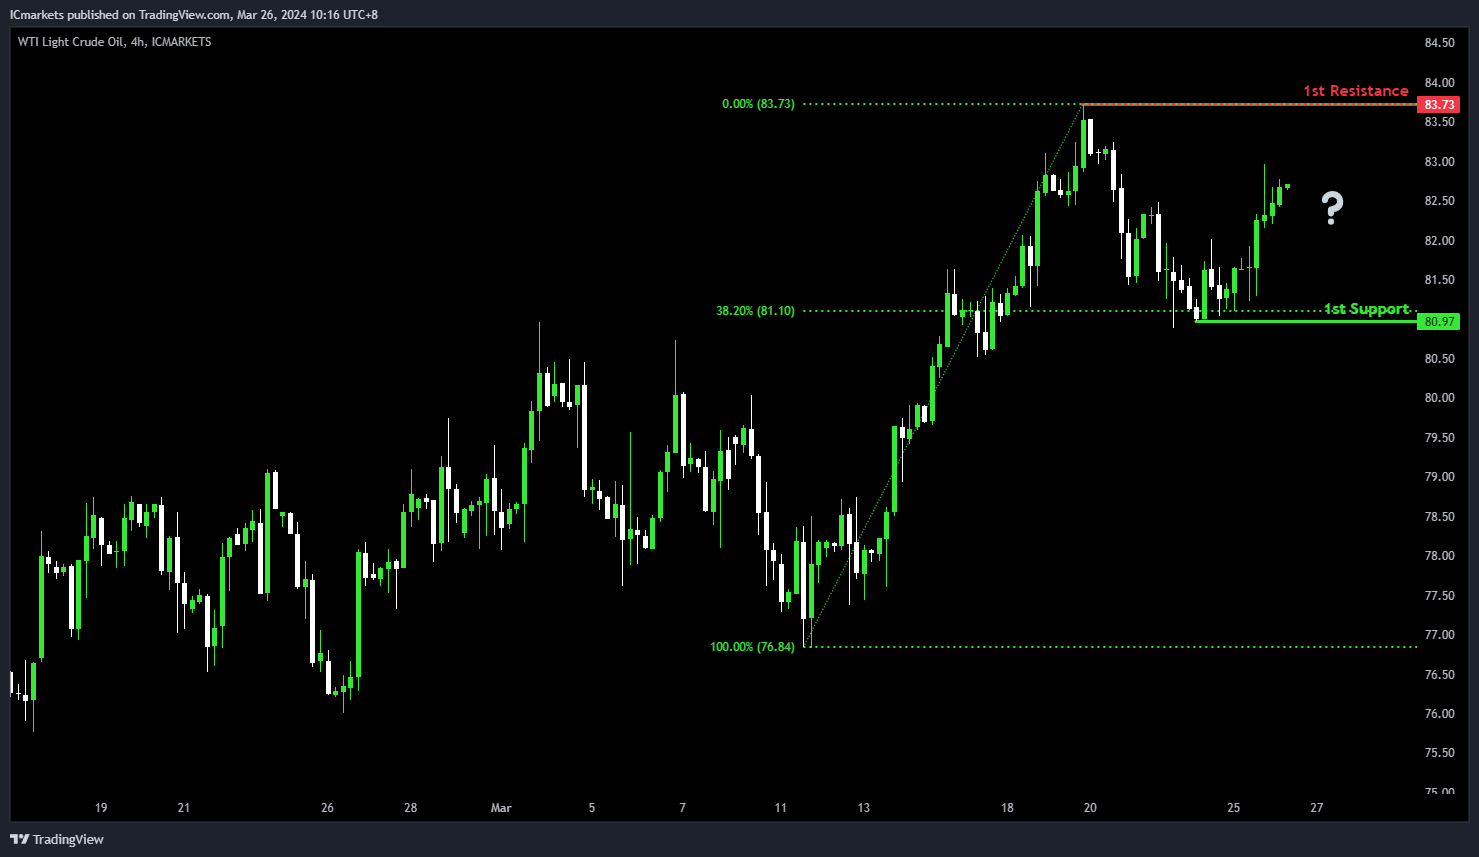
WTI/USD (Oil):
Potential Direction: Medium Bullish
Overall momentum of the chart: Neutral
Price could potentially make a bullish rise towards the 1st resistance.
1st Support: 80.97
Supporting reasons: This level acts as a pullback support that aligns with a 38.20% Fibonacci retracement, indicating a level where price has found strong support in the past.
1st Resistance: 83.73
Supporting reasons: This level is identified as a swing-high resistance, marking it as a critical threshold for bullish momentum to overcome; resistance at this level could cap further upside movements.
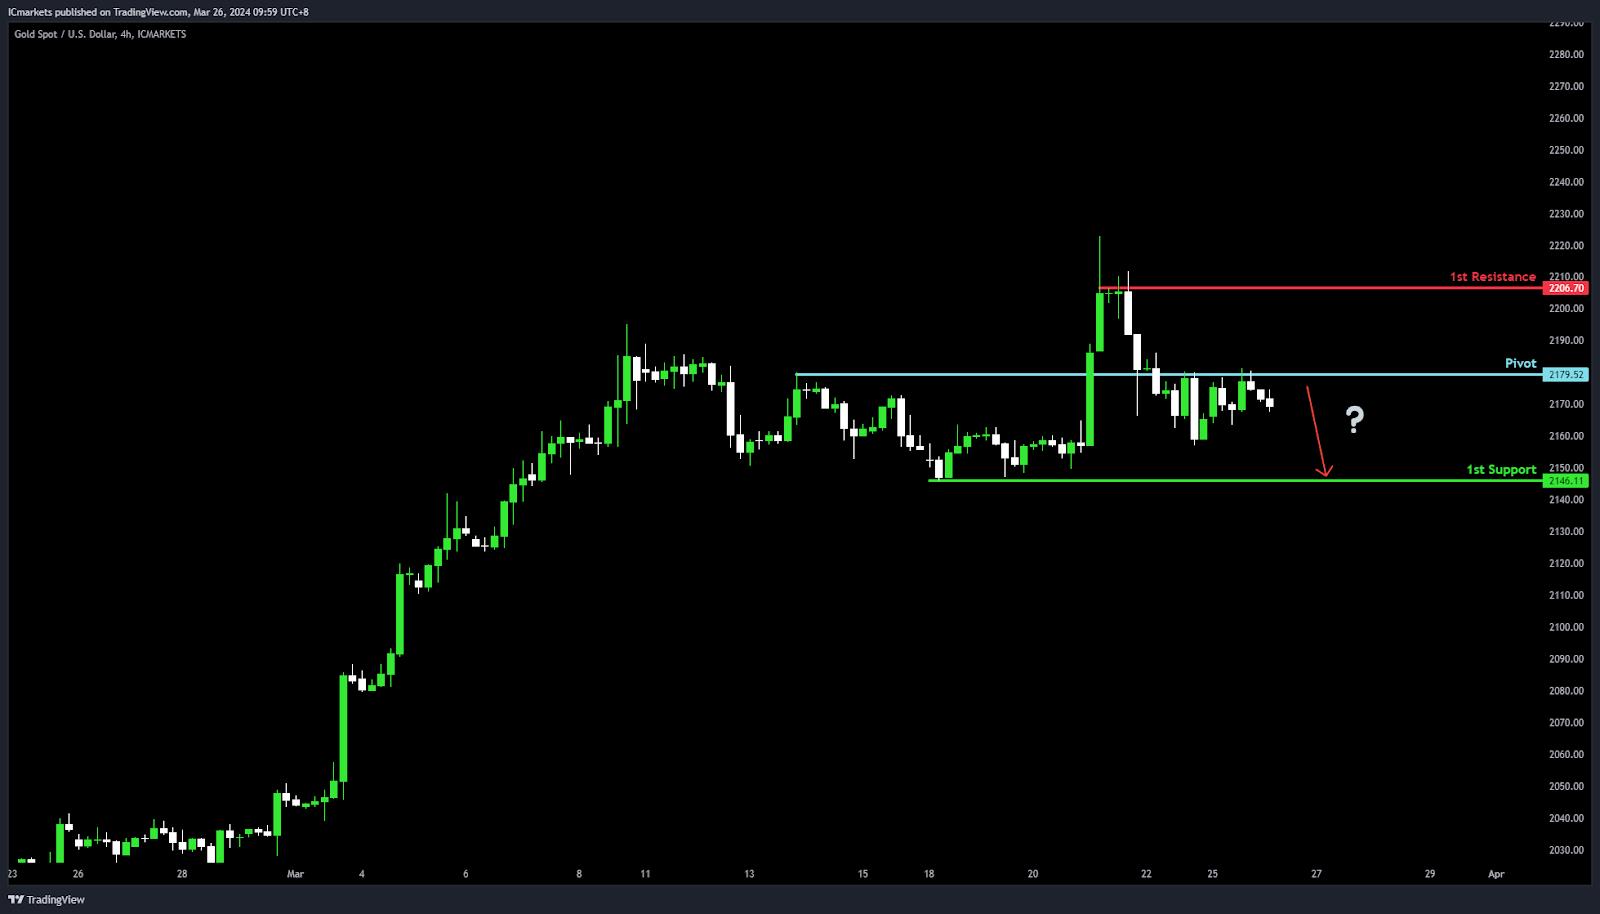
XAU/USD (GOLD):
Potential Direction: Bearish
Overall momentum of the chart: Bullish
Price could potentially make a bearish continuation towards 1st support
Pivot: 2179.52
Supporting reasons: Serves as an Overlap resistance, a key point where sellers could start to push prices down, showing it’s an important spot for possible changes in how the price moves.
1st support: 2146.11
Supporting reasons: Identified as Multi-swing low support, marking a key level where the market has previously found a foundation for rebounds, indicating its pivotal role in halting bearish momentum
1st resistance: 2206.70
Supporting reasons: Characterized by Multi-swing high resistance, highlighting a major barrier that has historically limited upward movements, positioning it as an essential threshold for bulls to breach in order to resume the bullish trend


