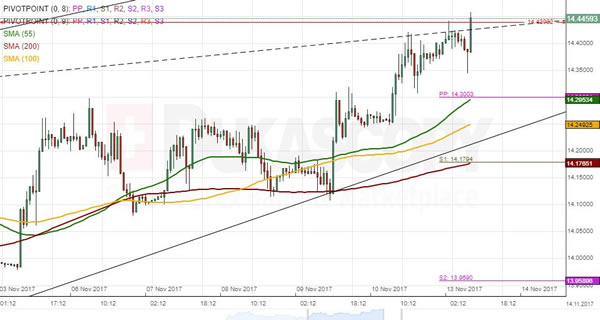
USD/ZAR is trading in an up-trend since mid-July; however, the pair has failed to form an ascending channel due to a diminishing trading range. Thus, an ascending wedge is a more accurate representation of its movement. Meanwhile, the US Dollar has managed to hold this pattern for the last two and a half months; thus, it is currently located at a 2017 high of 14.4393. As apparent on the chart, the pair has failed to reach the upside boundary of the aforementioned wedge for two weeks. This factor suggests that this pattern is unlikely to constrain the rate any longer. The subsequent movement therefore should be to the downside. During the following two weeks, the US Dollar might approach the upward-sloping trend-line circa 13.90/14.00—an area which is likewise reinforced by the monthly PP.