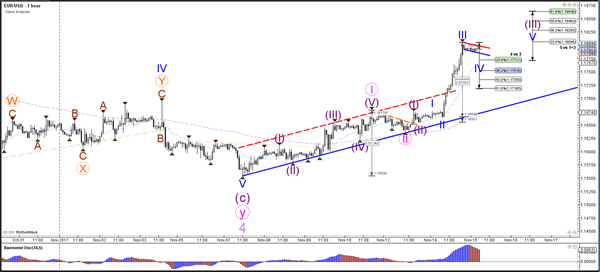
Currency pair EUR/USD
EUR/USD broke the resistance trend line (dotted red) of the bearish trend channel with strong momentum. This is indicating that the downtrend is completed and more upside is likely. The bullish price action indicates that the wave 4 (light purple) is completed and price is expected to continue within the wave 5. The current momentum is typical for a wave 3 pattern (pink).
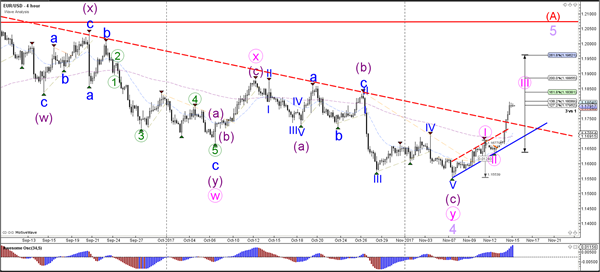
The EUR/USD is probably building multiple wave 3s now. The current wave 3-4 (blue) is building a bull flag pattern which could see an immediate bullish break or a bearish retracement towards the Fib levels of wave 4 vs 3 (blue).
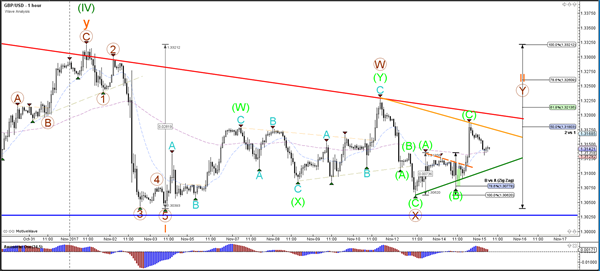
Currency pair GBP/USD
The GBP/USD remains choppy and is unable to break above and below the support (blue) and resistance (red) trend lines. A breakout is needed before a larger directional move can be expected, although a bullish breakout still faces resistance from the Fibonacci levels of wave 2 (orange).
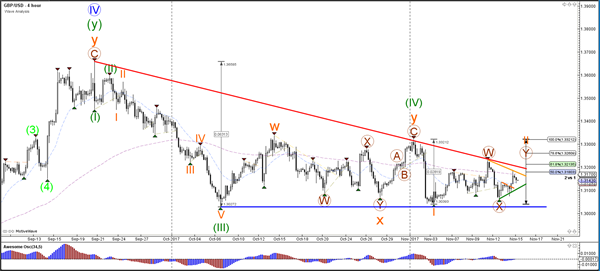
The GBP/USD completed the ABC zigzag correction (green) as expected in yesterday’s analysis. The next wave depends on the breakout direction. The main scenario is probably that the wave Y (brown) sees price extend sideways.
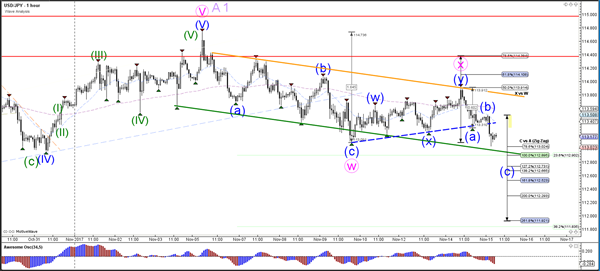
Currency pair USD/JPY
The USD/JPY is still in its choppy bearish trend channel. A bullish breakout could test the resistance levels of wave X (pink). A bearish breakout below the 23.6% Fib could see a drop lower to the Fibonacci levels of wave 2 or wave B (light purple).
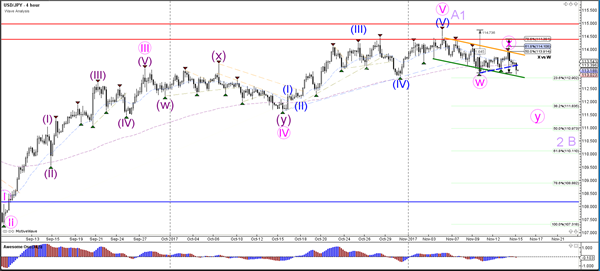
The USD/JPY is testing the Fibonacci support and trend line (green).