
Key Highlights
- WTI Crude Oil prices started a fresh decline below the $76.20 support.
- It dipped below a declining channel with support at $72.30 on the 4-hour chart.
- Gold prices extended the surge and broke the $2,825 resistance.
- EUR/USD is attempting to start a fresh increase above the 1.0300 pivot level.
WTI Crude Oil Price Technical Analysis
WTI Crude Oil price started a major decline amid Trump’s trade war. There was a steady decline below the $77.50 and $76.20 levels.
Looking at the 4-hour chart of XTI/USD, the price traded below a declining channel with support at $72.30. There was a close below the $75.00 level, the 100 simple moving average (red, 4-hour), and the 200 simple moving average (green, 4-hour).
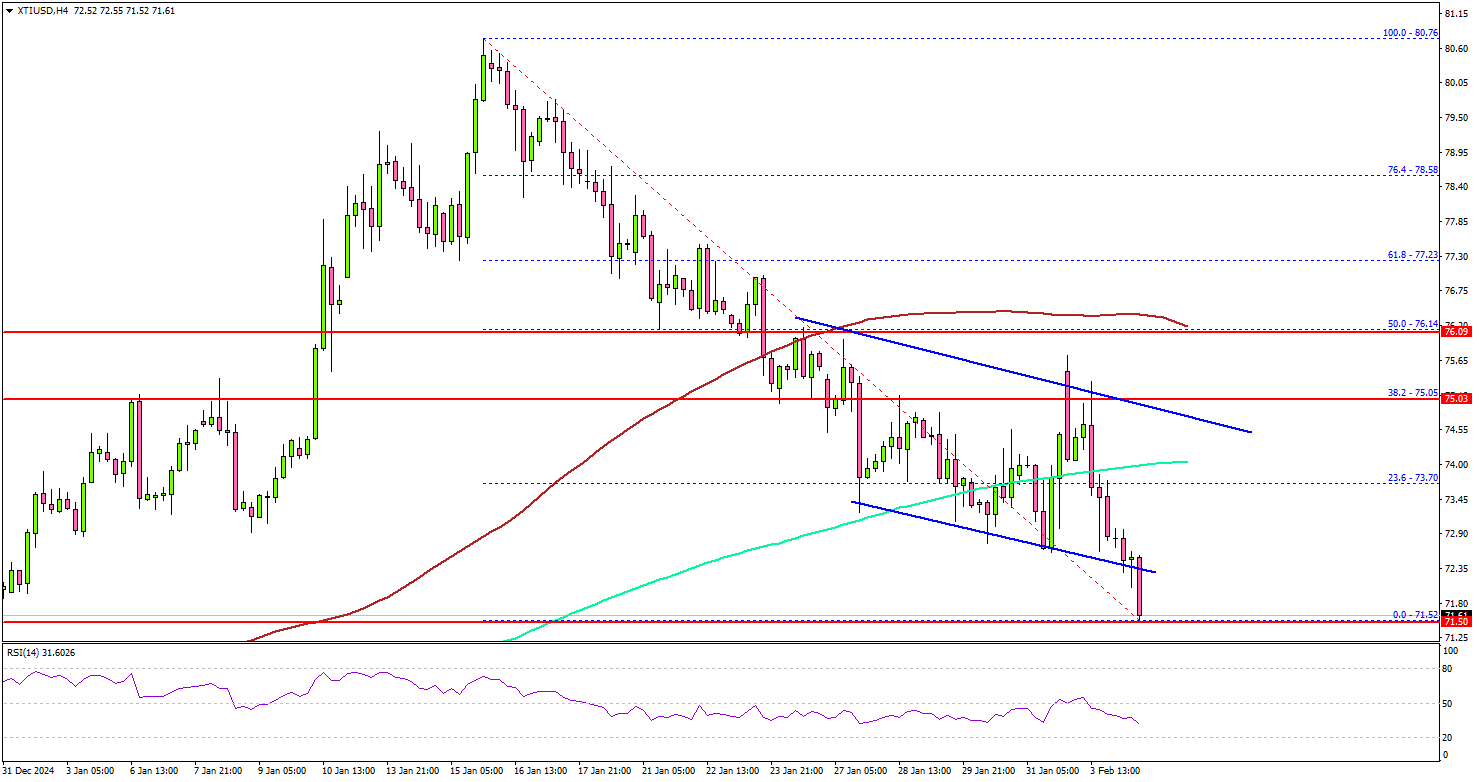
The price even spiked toward the key support at $71.50. If the bulls remain active, the price might recover. On the upside, the price is facing hurdles near the $73.50 level.
The main hurdle is now near the $75.00 zone, above which the price may perhaps accelerate higher. In the stated case, it could even visit the $77.50 resistance. Any more gains might call for a test of the $78.80 resistance zone in the near term.
On the downside, the first major support sits near the $71.50 zone. A daily close below $71.50 could open the doors for a larger decline. The next major support is $68.60. Any more losses might send oil prices toward $65.00 in the coming days.
Looking at Gold, there was a steady increase above the $2,835 level and the price is showing signs of more gains.
Economic Releases to Watch Today
- Euro Zone Services PMI for Jan 2024 – Forecast 51.4, versus 51.4 previous.
- UK Services PMI for Jan 2024 – Forecast 51.2, versus 51.3 previous.
- US Services PMI for Jan 2024 – Forecast 52.8, versus 52.8 previous.
- US ISM Services Index for Jan 2024 – Forecast 54.2, versus 54.1 previous.


