
Key Highlights
- Ethereum rallied over 25% and cleared the $2,500 resistance.
- ETH surpassed a key bearish trend line with resistance at $1,820 on the daily chart.
- Bitcoin price also rallied and surpassed the $102,500 resistance.
- XRP is showing positive signs and might soon aim for a move above $2.65.
Ethereum Technical Analysis
Ethereum remained stable above $1,650 and started a fresh increase. ETH cleared a few key hurdles near $2,000 to start a fresh surge.
Looking at the daily chart, the price surpassed a key bearish trend line with resistance at $1,820. The price even surpassed the 50% Fib retracement level of the downward wave from the $3,740 swing high to the $1,379 low.
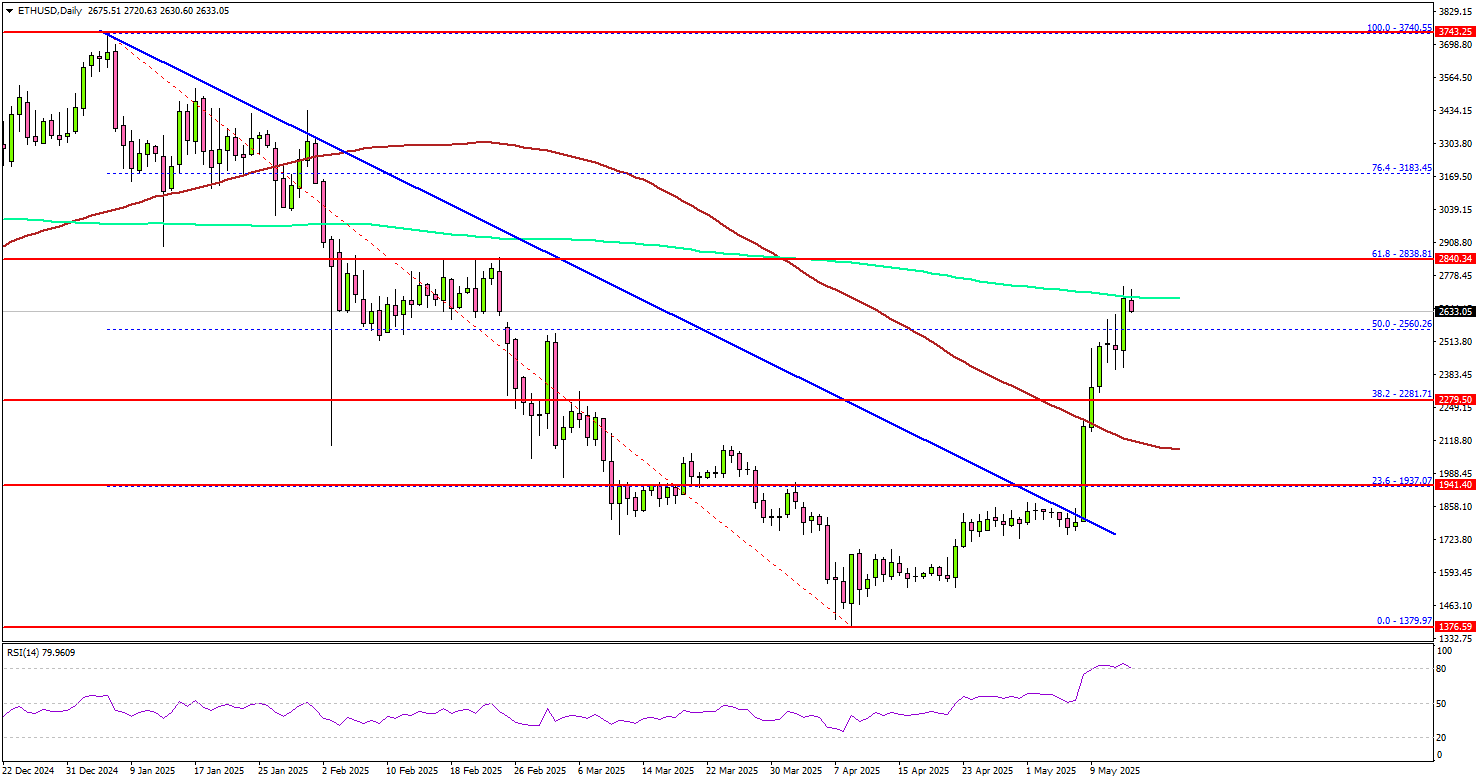
ETH settled above the 100-day simple moving average (red) and now approaches the 200-day simple moving average (green). Immediate resistance is near the $2,720 level.
The next major resistance is near the $2,840 level and the 61.8% Fib retracement level of the downward wave from the $3,740 swing high to the $1,379 low. A daily close above the $2,840 resistance zone could start another steady increase. In the stated case, the price may perhaps rise toward the $3,000 level. The next stop for the bulls may perhaps be $3,120.
On the downside, Ethereum might find support near the $2,350 level. The next major support is $2,280, below which the price could slide toward $2,120. Any more losses might call for a move toward the $2,000 level.
Looking at Bitcoin, there was a steady increase above the $102,000 level, and the price might continue to rise toward the $108,000 level.
Economic Releases
- Fed’s Waller speech.
- Fed’s Jefferson speech.