
Key Highlights
- GBP/USD started a fresh increase above the 1.3520 resistance.
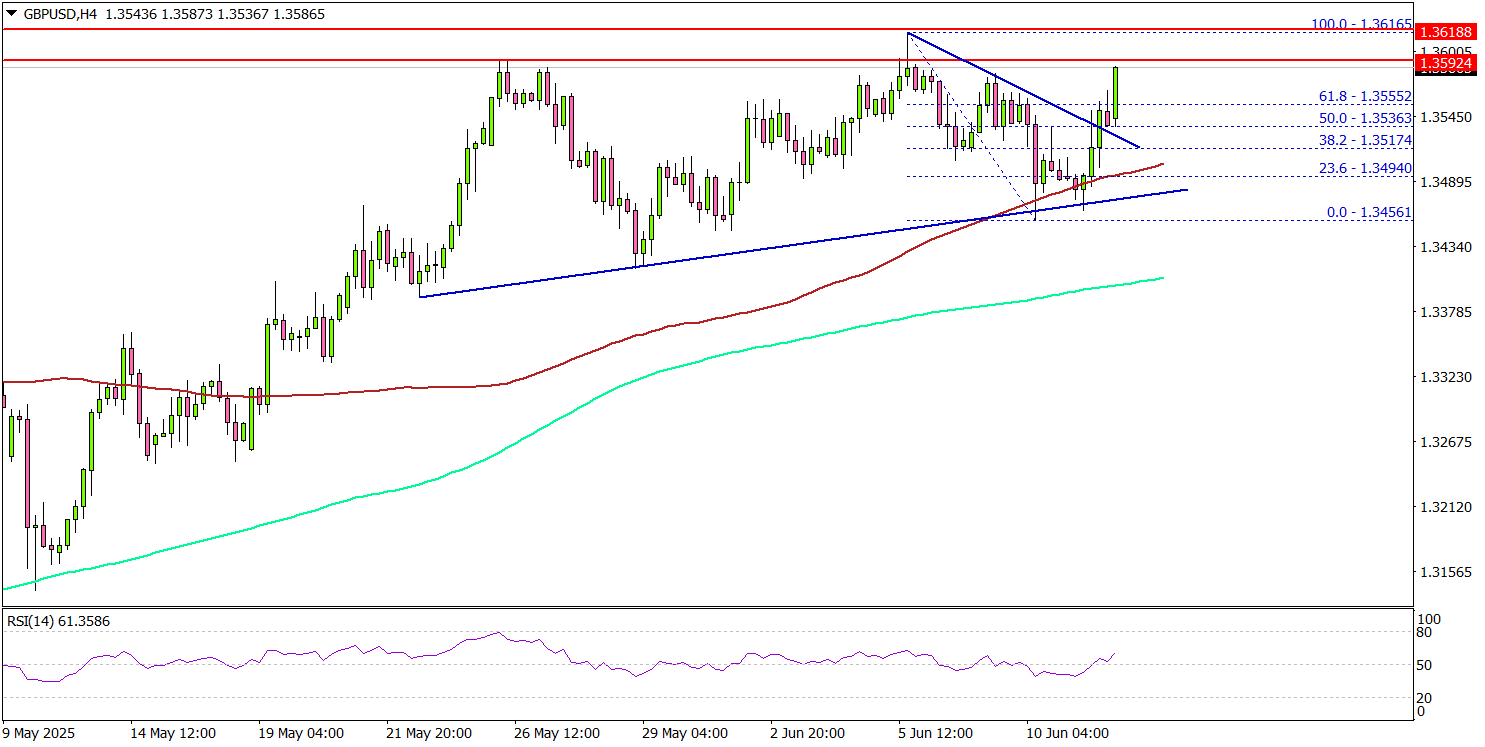
- It cleared a contracting triangle with resistance at 1.3535 on the 4-hour chart.
- EUR/USD is gaining pace and might clear the 1.1550 resistance.
- Bitcoin price struggled to clear the $110,500 resistance zone.
GBP/USD Technical Analysis
The British Pound remained well-bid above 1.3350 against the US Dollar. GBP/USD climbed above the 1.3450 and 1.3500 resistance levels.
Looking at the 4-hour chart, the pair settled above the 1.3520 level, the 100 simple moving average (red, 4-hour), and the 200 simple moving average (green, 4-hour). It cleared a contracting triangle with resistance at 1.3535.
On the downside, immediate support is near the 1.3550 level. The next key support sits near 1.3520. Any more losses could send the pair toward the 1.3500 pivot level and the 100 simple moving average (red, 4-hour) in the near term. The main support could be near 1.3440.
On the upside, the pair could face resistance near the 1.3620 level. The next key resistance sits near the 1.3650 level. The first major resistance sits at 1.3700. A close above the 1.3700 level could set the pace for another increase.
In the stated case, the pair could even clear the 1.380 resistance. The next major stop for the bulls could be near the 1.4000 resistance.
Looking at EUR/USD, the pair started another increase, but the bulls seem to be facing hurdles near the 1.1550 level.
Upcoming Economic Events:
- US Initial Jobless Claims – Forecast 240K, versus 247K previous.
- US Producer Price Index for May 2025 (YoY) – Forecast +0.2%, versus -0.5% previous.


