
 rallied as expected and hit the first resistance level of 43,560 as mentioned in our previous report. It printed a fresh intraday record high of 43,943 on Monday, 18 August.)
The Japan 225 CFD Index (a proxy of the Nikkei 225 futures) rallied as expected and hit the first resistance level of 43,560 as mentioned in our previous report. It printed a fresh intraday record high of 43,943 on Monday, 18 August.
Thereafter, it staged a decline of -4% to record an intraday low of 42,330 on Friday, 22 August, before it recovered to an intraday level of 42,570 at the time of writing.
Several technical elements and a fundamental factor suggest that the ongoing 5-day decline is likely a minor corrective decline within its medium-term uptrend phase rather than the start of a medium-term bearish trend.
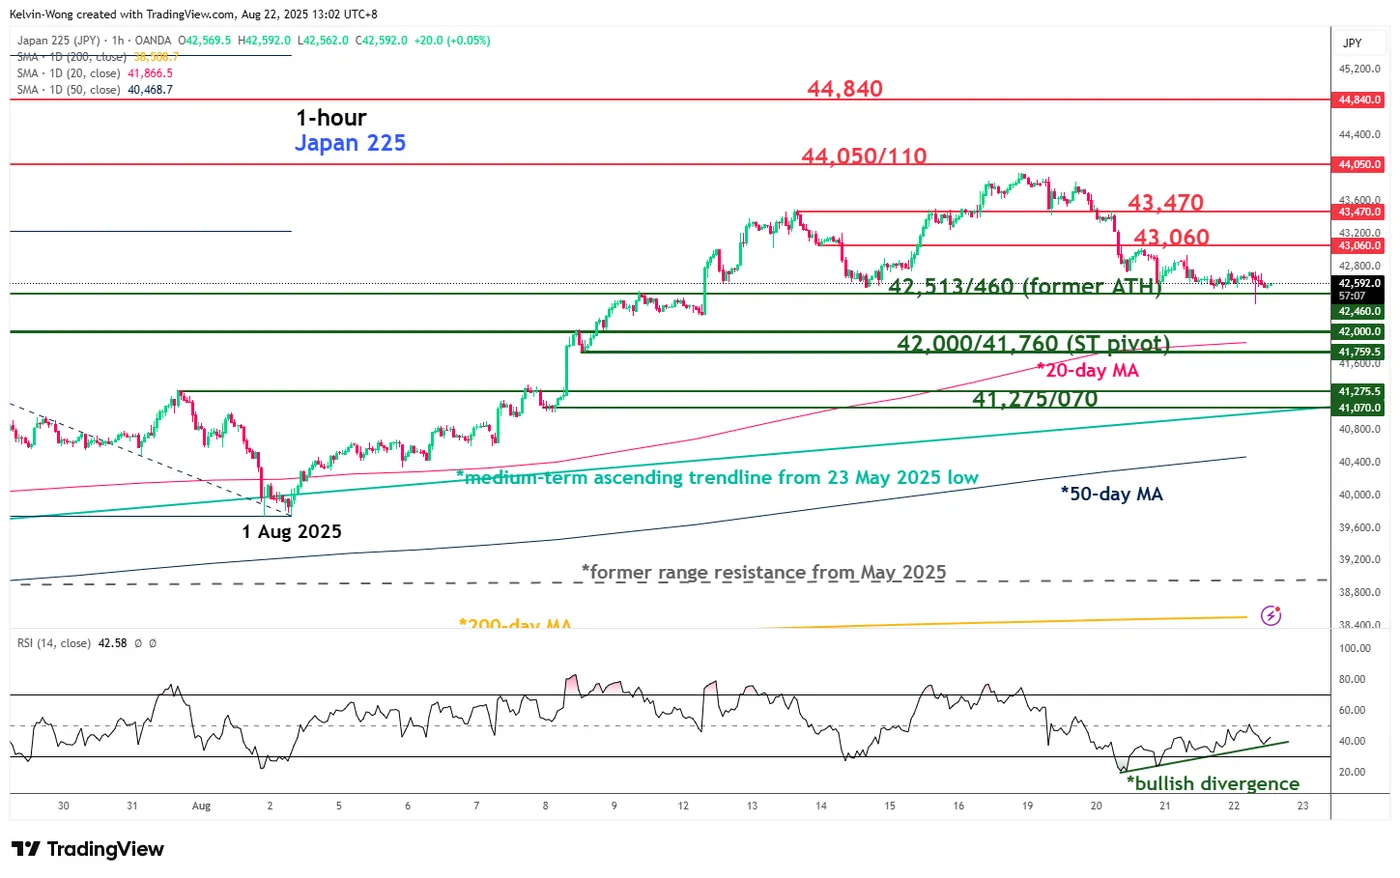
Fig. 1: Japan 225 CFD Index minor trend as of 22 Aug 2025 (Source: TradingView)
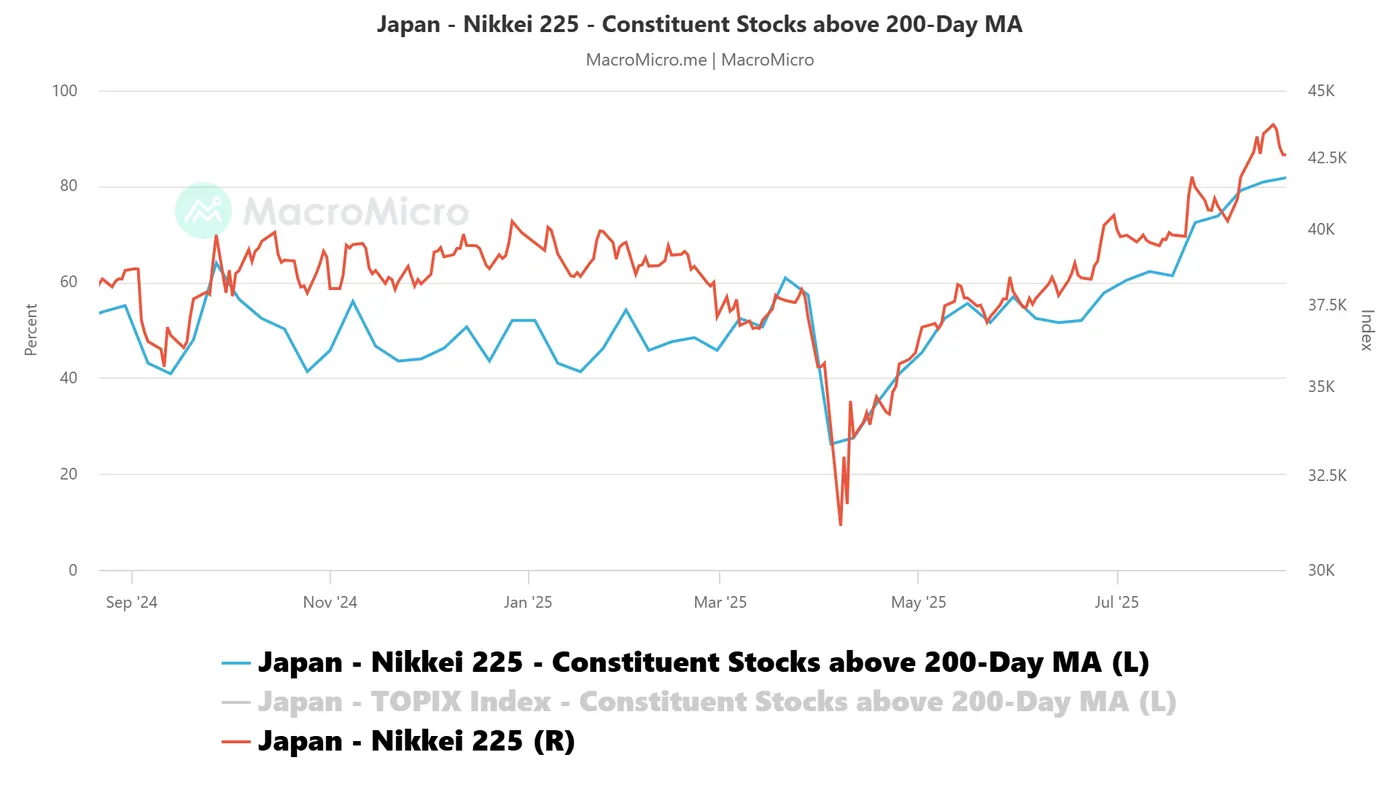
Fig. 2: Nikkei 225 component stocks above 200-day as of 22 Aug 2025 (Source: MacroMicro)
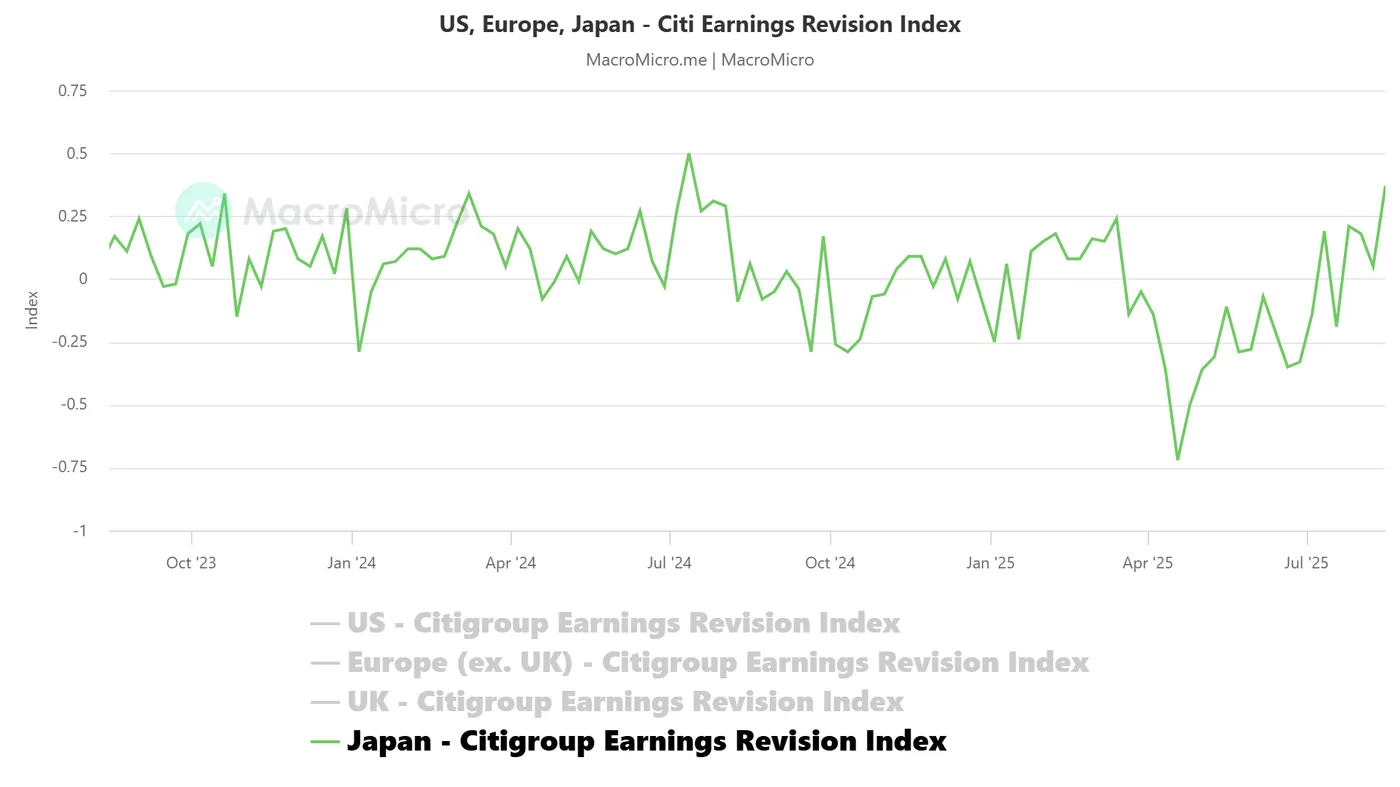
Fig. 3: Japan Citigroup Earnings Revision Index as of 15 Aug 2025 (Source: MacroMicro)
Preferred trend bias (1-3 days)
Maintain a bullish bias with short-term pivotal support at 42,000/41,760 for the Japan 225 CFD Index, and a clearance above 43,060 sees the next intermediate resistances coming at 43,470 and 44,050/44,110 (Fibonacci extension cluster levels) (see Fig. 1).
Key elements
- The 42,000/41,760 key support zone is likely an inflection point, a potential bullish reversal as it confluences with the 20-day moving average and 50% Fibonacci retracement of the prior minor up move from 1 August 2025 low to 18 August 2025 high.
- The hourly RSI momentum indicator has traced out a bullish divergence condition after it dropped towards its oversold region on Wednesday, 20 August. These observations suggest bearish momentum of the ongoing 5-day decline has started to ease.
- Market breadth has continued to improve; the percentage of the Nikkei 225 component stocks trading above their respective key 200-day moving averages has increased steadily since 1 August’s print of 74% to 82% as of Friday, August (see Fig. 2).
- Analysts, on average, have continued to upgrade their earnings outlook on Japanese corporations. The Citigroup Earnings Revision Index has been on a path of a steady uptrend since 18 April 2025’s 5-year low of -0.72; it has jumped to 0.37 as of 15 August 2025 from -0.19 printed on 18 July 2025 (see Fig. 3).
Alternative trend bias (1 to 3 days)
A break below the 41,760 key support invalidates the bullish recovery to see an extension of the corrective decline to expose the 41,275/41,070 medium-term support zone.