Hello traders. As our members know, we’ve been long in BTCUSD . The crypto has made a solid rally toward new all-time highs, gaining more than 20% since our entry on the June 22nd. In this technical article, we are going to present short term Elliott Wave forecast of Bitcoin.
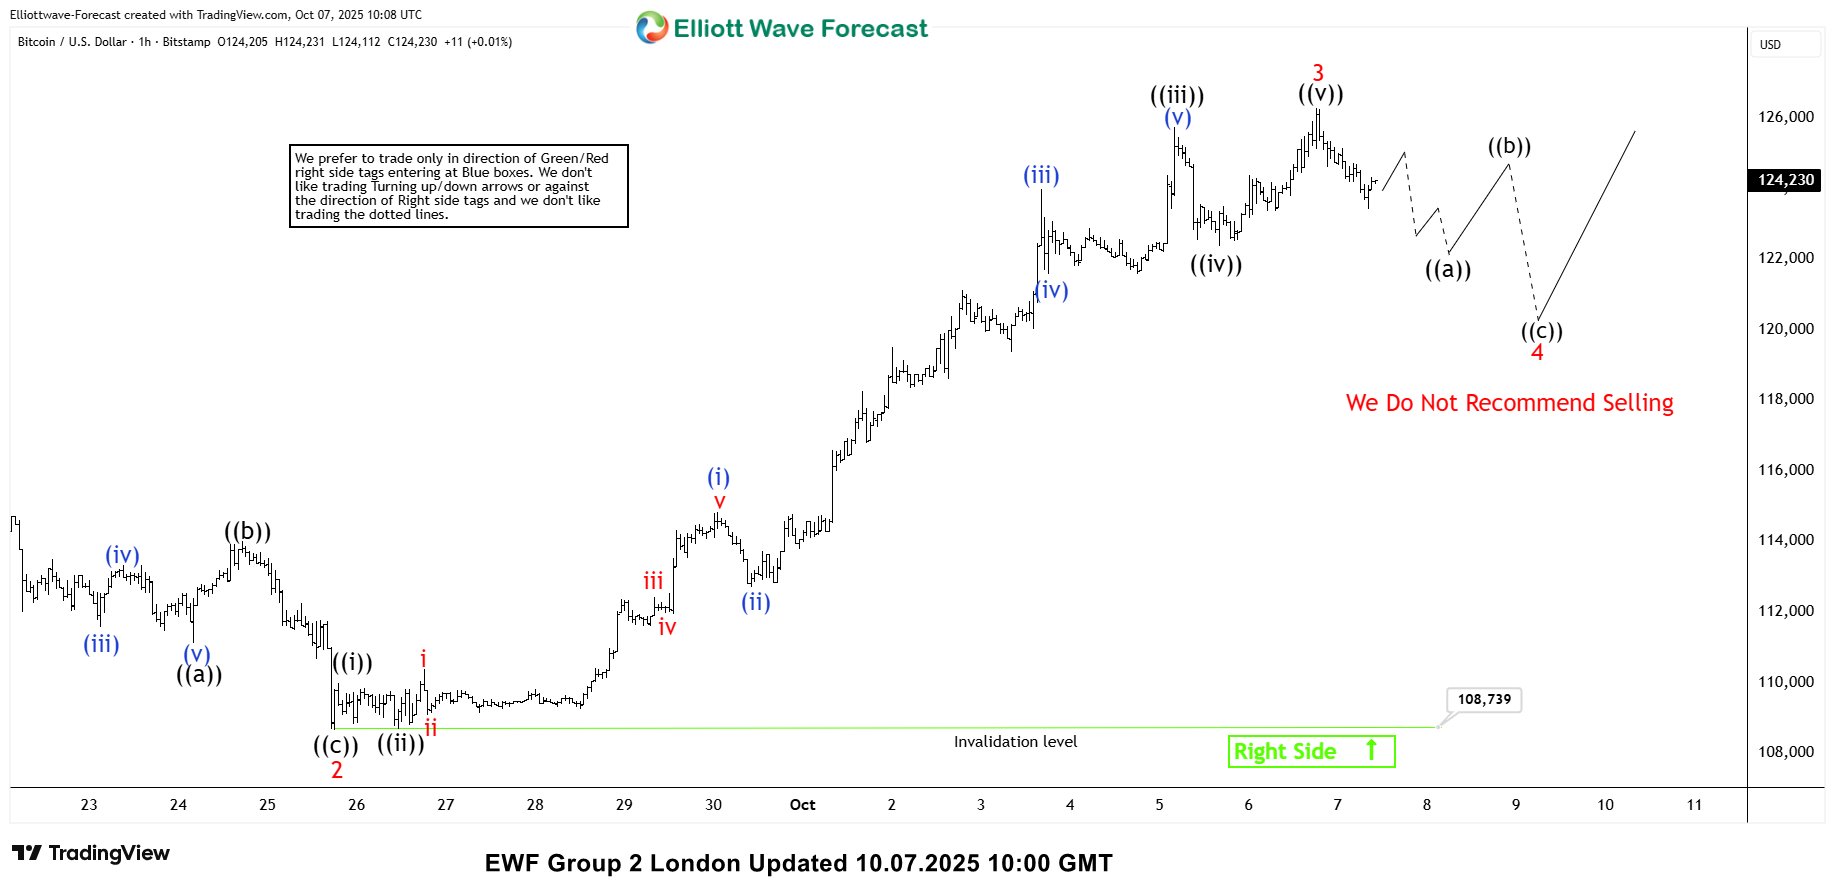
BTCUSD Elliott Wave 1 Hour Chart 10.07.2025
The current view suggests that Bitcoin is undergoing a correction against the 108,739 low. The cycle from that low unfolded in a clear 5-wave structure, completing at 126,237. While below this high, we expect to see a 3-wave pullback in wave 4 red before the next rally resumes.
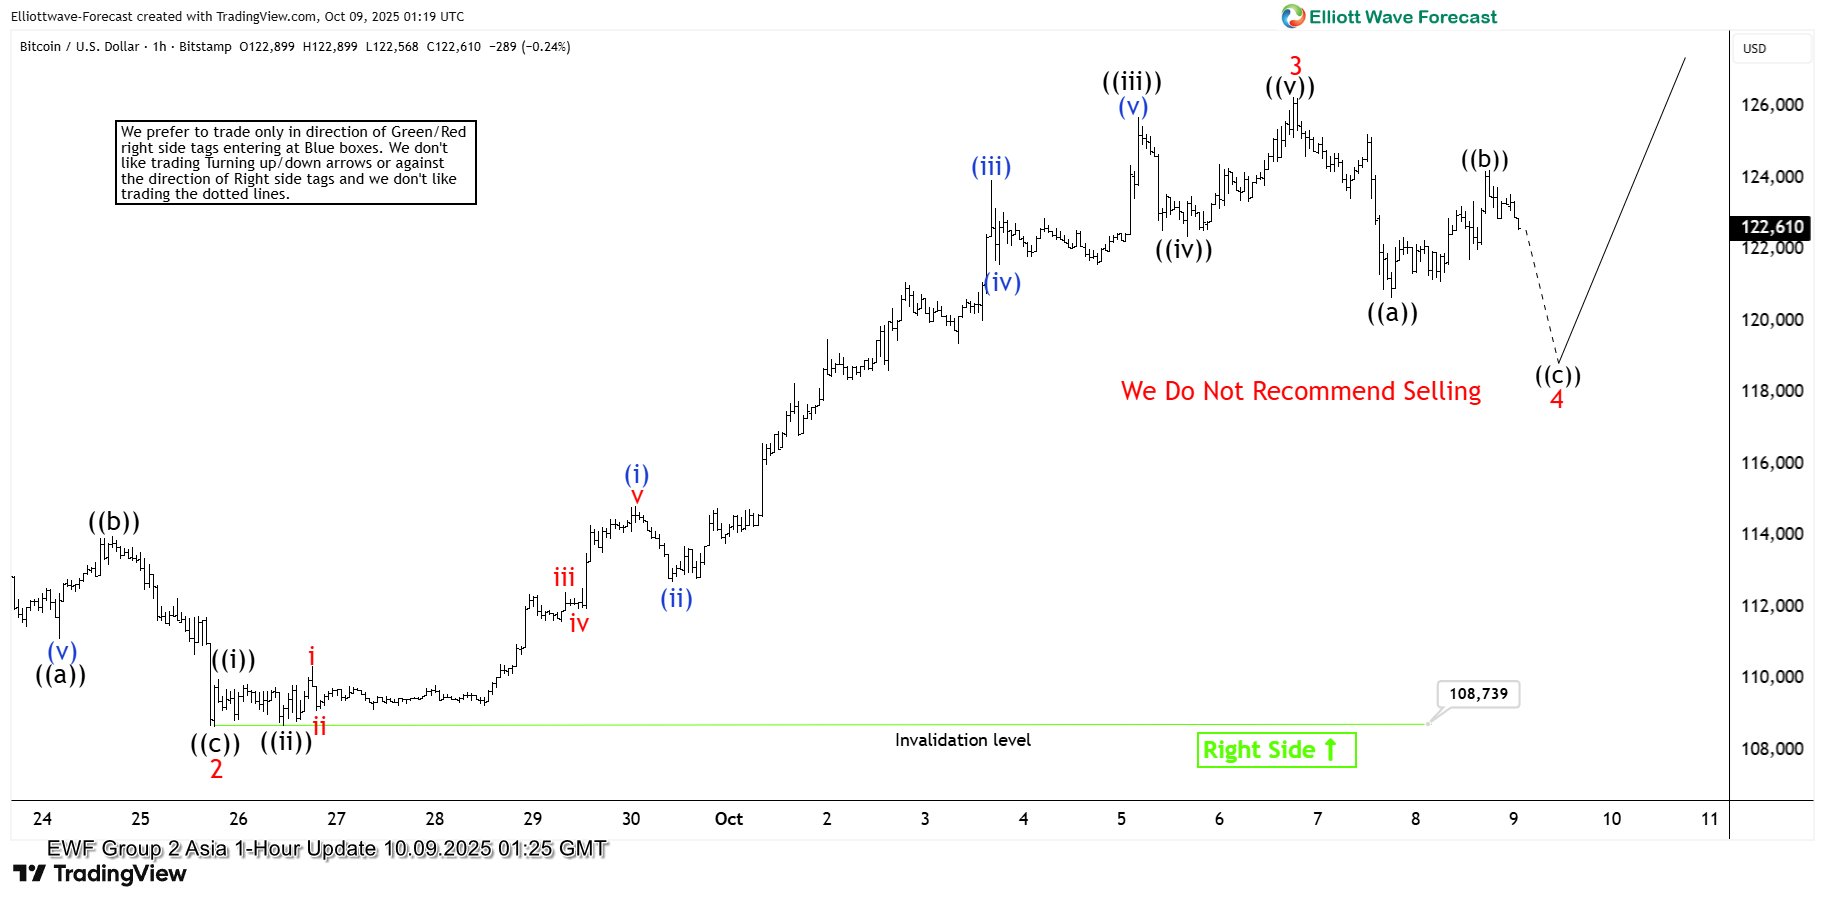
BTCUSD Elliott Wave 1 Hour Chart 10.09.2025
The pullback unfolded in 5 waves down from the peak, which is considered the first ((a)) leg of a potential Zigzag pattern. This was followed by a 3-wave bounce in the ((b)) leg. While below 124,203, we consider wave ((b)) complete and are now calling for a move lower in wave ((c)), targeting the 118,681–115,250 area (buying zone). In this area, we expect buyers to appear for either a further rally or at least a 3-wave bounce.