
As the chart shows, trading in the Nasdaq 100 (US Tech 100 mini on FXOpen) opened with a bullish gap today, with the price rising above the 25,600 mark for the first time in history.
The upbeat sentiment is being driven by:
→ expectations of a potential interest rate cut, with the Federal Reserve’s decision due on Wednesday;
→ the upcoming meeting between Chinese and U.S. leaders, where the presidents may announce a new trade agreement;
→ anticipation of quarterly earnings reports from major tech firms – Amazon (AMZN), Apple (AAPL), Microsoft (MSFT), Alphabet (GOOGL) and Meta Platforms (META) are all set to release results this week.
Technical Analysis of the Nasdaq 100 Chart
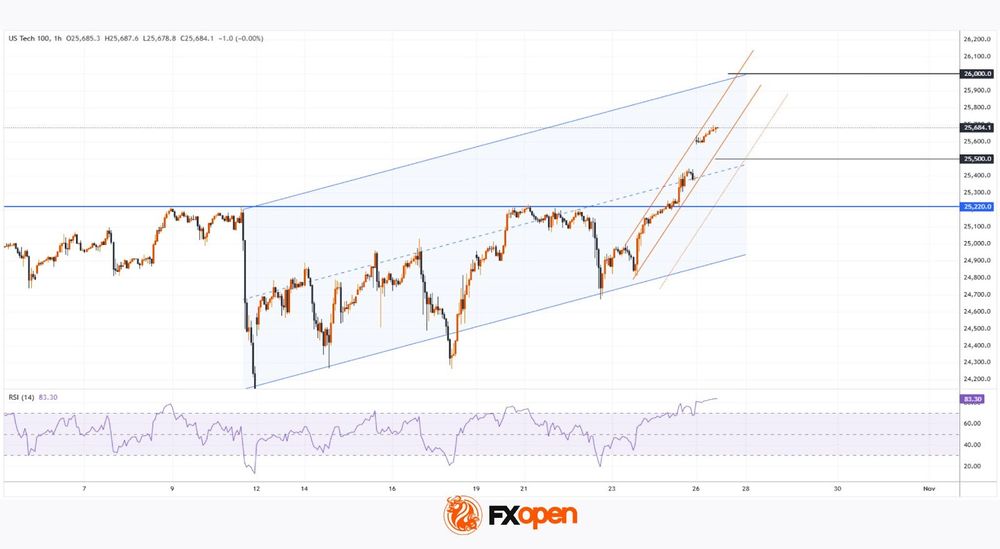
A closer look at the hourly Nasdaq 100 (US Tech 100 mini on FXOpen) chart, within the context of this month’s volatility, shows a steady recovery from the sharp drop on 10 October – the day President Trump suggested imposing 100% tariffs on Chinese goods.
The contours of that sell-off can now be used to outline an ascending channel, which neatly captures the market’s current price swings. Notably, today the index climbed into the upper half of that channel, overcoming resistance levels at:
→ the channel’s median line;
→ the 25,220 mark.
Since last Thursday’s low, the price has advanced by more than 3.5% – a strong rally – forming a steep upward trajectory (highlighted in orange). In this context:
→ the next potential target lies at the upper boundary of the blue channel, which would mark a new record high near 26,000 for the Nasdaq 100;
→ however, with RSI signalling overbought conditions, a short-term correction towards 25,500 would be a healthy development.
Should this week’s key events deliver the optimism investors are hoping for, the bulls may well succeed in reaching those ambitious targets.
Trade global index CFDs with zero commission and tight spreads. Open your FXOpen account now or learn more about trading index CFDs with FXOpen.
This article represents the opinion of the Companies operating under the FXOpen brand only. It is not to be construed as an offer, solicitation, or recommendation with respect to products and services provided by the Companies operating under the FXOpen brand, nor is it to be considered financial advice.


 opened with a bullish gap today, with the price rising above the 25,600 mark for the first time in history.)