
Markets are getting rocked up and down across asset classes lately.
- Cryptos are getting sold off aggressively (Is the selling done or is it only a first wave?).
- Equities are seeing some record volatility compared to the past few years in frantic +1% up and down moves, as can be seen today.
Even Metals are failing to gather traction after reaching some new records towards the end of last month.
They are holding relatively well compared to the other asset classes that performed great throughout 2025, but the fact that they can’t seem to attract inflows during high-range risk-off profit-taking points to a deeply confused market.
The dominant 2025 trend of Stocks, Cryptos, and Metals rallying simultaneously is what has been broadly called the Debasement Trade (a trade rooted in the debasement of the US Dollar and fiat currencies in general).
But when all these anti-fiat assets fall at the same time, what is truly happening?
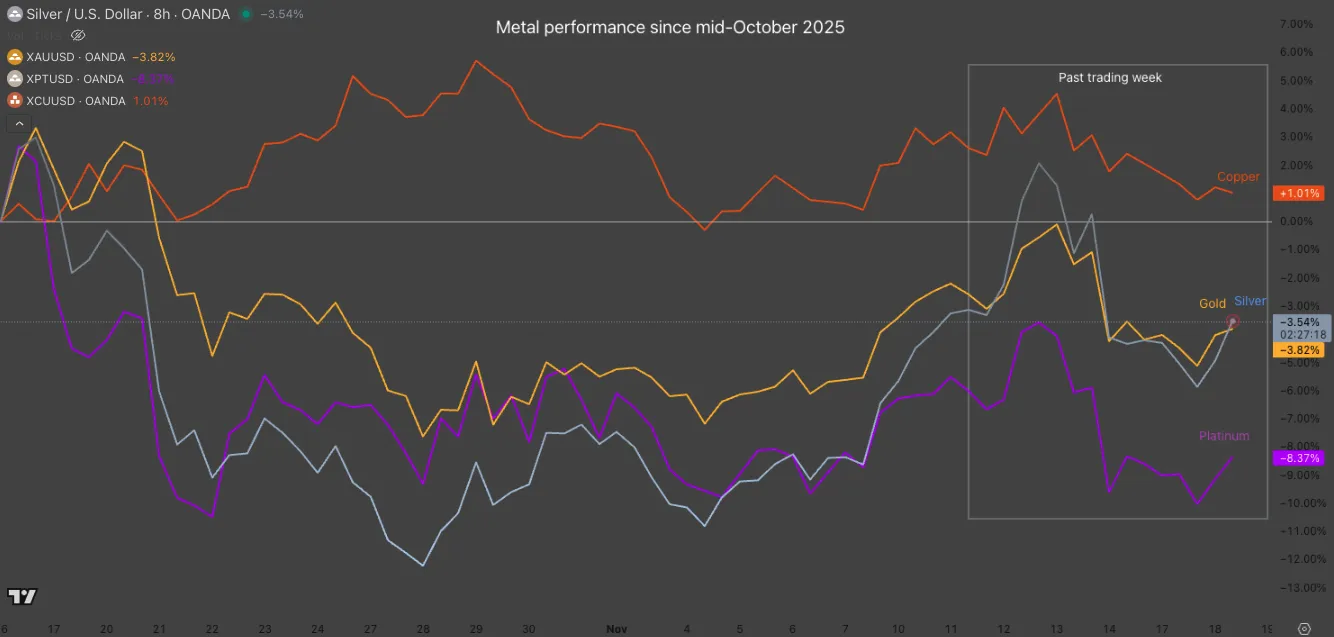
Metal Performance since Mid-October 2025. November 18, 2025 – Source: TradingView
Bank of America has sent out warnings on dangerously low cash levels, which usually doesn’t rhyme well with risk asset performance (or any asset, except Treasury bonds).
This flow could signal the start of a trend where massive profit-taking and position closing—a potential Re-basement Trade (contrary to the debasement trade)—takes hold.
In the waiting for such developments to happen (or not), let’s dive into two timeframe charts for Gold (XAU/USD) and Silver (XAG/USD) to spot what key levels can come into play for upcoming trading.
Gold maintains its triangle formation
Gold (XAU/USD) Daily Chart
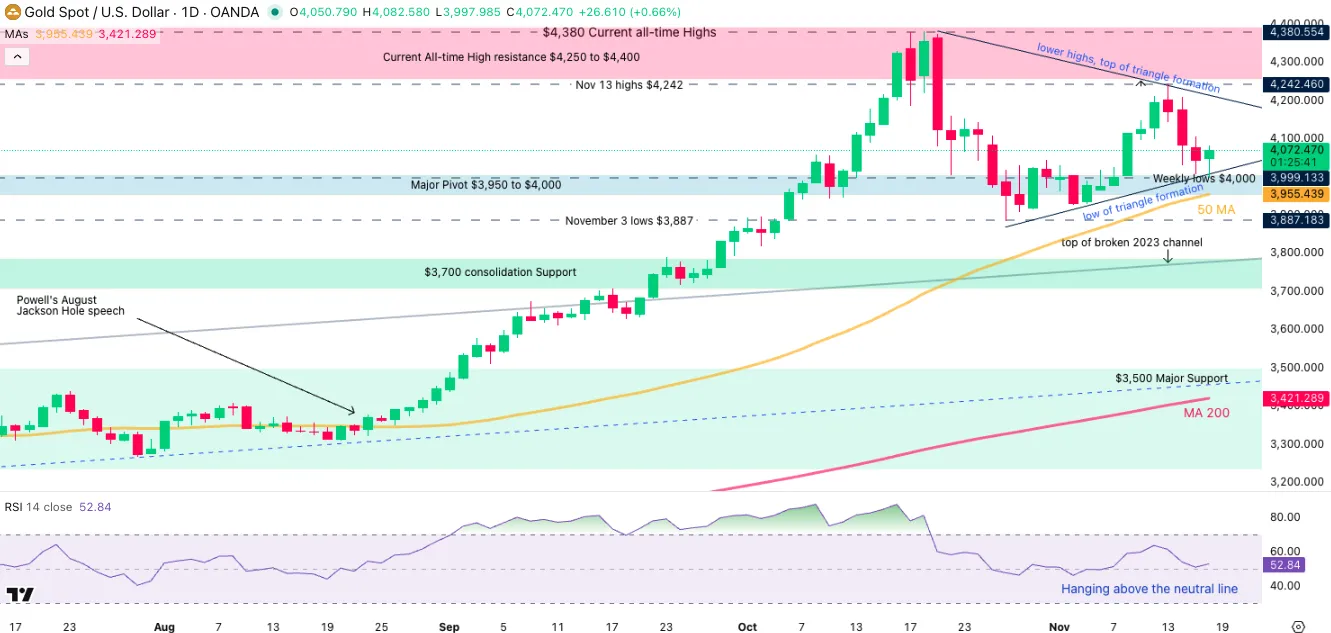
Gold (XAU) Daily Chart, November 18, 2025 – Source: TradingView
Gold has been holding its triangle formation (mentioned in our recent Gold analysis) with precision, indicating that Markets are still more on the mood for consolidation.
To tilt the scales one way however, the Daily RSI has been holding strong above the neutral line, indicating that buyers remain in control. This also corroborates with the price action holding above $4,000 – Keep this level closely in check.
Traders might have to be more patient in order to see a definite breakout (both upside and downside are still possibilities).
In the meantime, the triangle formation is the one key technical aspect to watch.
Gold (XAU/USD) 2H Chart and levels
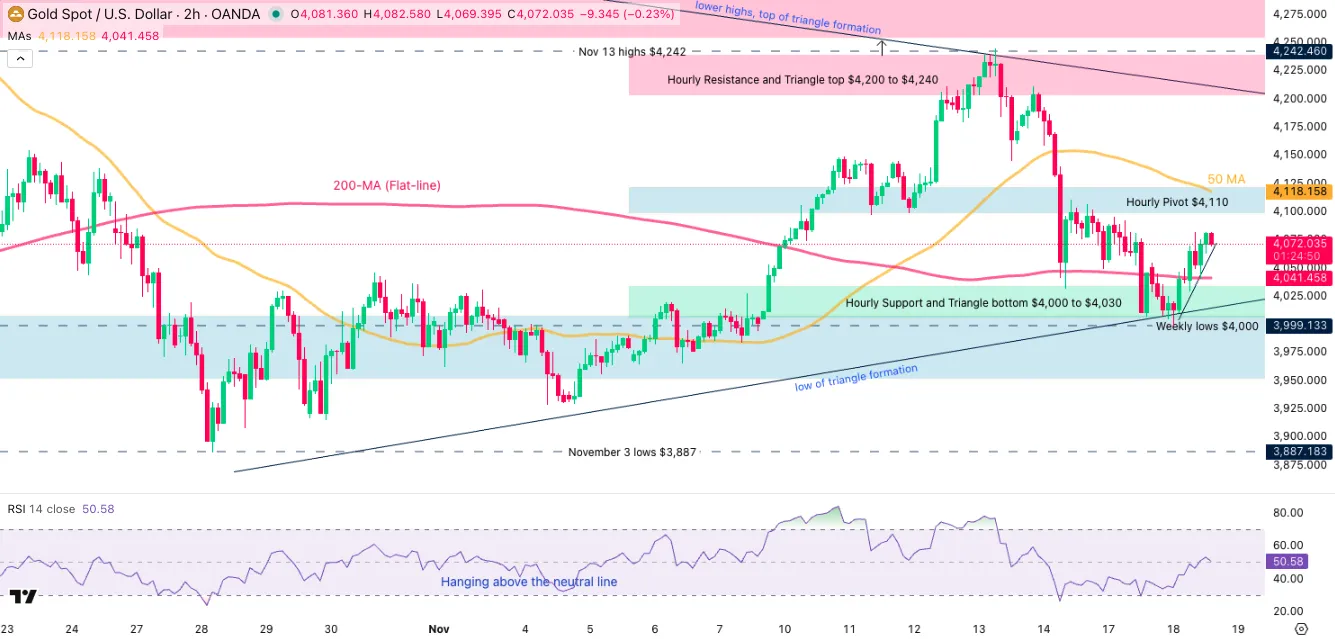
Gold (XAU) 2H Chart, November 18, 2025 – Source: TradingView
Gold is still holding within a $4,000 to $4,240 range but seems to be contracting as things unroll.
The MA 200 largely flatlining confirms this point, therefore watch for a breakout of the Triangle formation if you want to trade a directional price action.
If not, one can look at opportunities within the triangle formation (strong support and resistances are there for now).
Gold technical levels of interest:
Resistance Levels
- Current All-time High resistance $4,250 to $4,400 (ATH $4,380)
- Hourly Resistance and Triangle top $4,200 to $4,240
- Session highs $4,080
Support Levels
- Hourly Support and Triangle bottom $4,000 to $4,030
- Major Pivot $3,950 to $4,000
- $3,700 consolidation Support
- $3,500 Major Support
Silver (XAG) holds a strong range
Silver (XAG/USD) Daily Chart
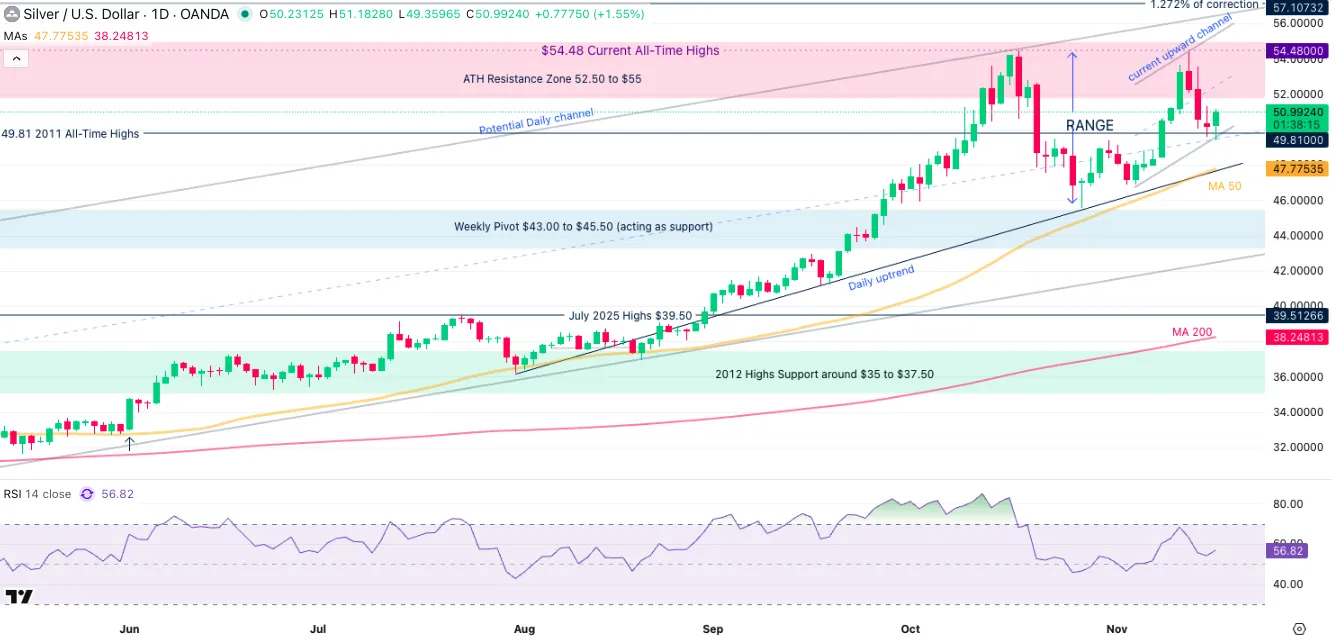
Silver (XAG) Daily Chart, November 18, 2025 – Source: TradingView
Silver has had quite a run to its new all-time highs, even outperforming Gold towards its rise.
However, momentum as calmed down quite suddenly, leading to a $47 to $52 broad range in the past week of action.
The action is more sideways than anything, but bulls are trying to accumulate some momentum as can be seen in the few breakout attempts that need more strength.
Still, some small consistent buying is currently playing out, so watch for any breakouts beyond hourly support and resistance levels – more details on them right below.
Silver (XAG/USD) 4H Chart and levels
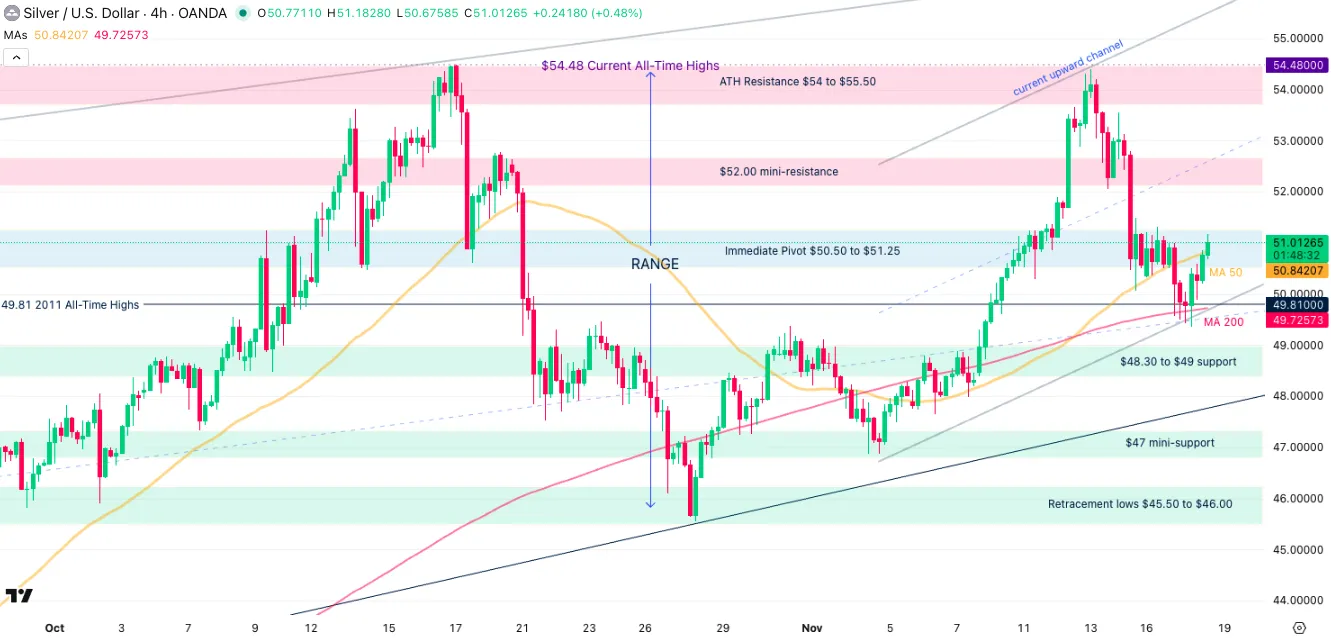
Silver (XAG) 4H Chart, November 18, 2025 – Source: TradingView
Levels to watch for Silver (XAG) trading:
Resistance Levels:
- Immediate Pivot $50.50 to $51.25
- 2025 record $55.48
- $52 to $53 mini-resistance
- $51.18 session highs
- Potential resistance 1 $57.50 to $60 (1.382% from 2022 lows)
- Potential resistance 2 $62 to $65 (1.618 from Impulsive Move)
Support Levels:
- $48.30 to $49 support
- $47 low of potential daily channel
- $45.55 October 28 lows
- $43.00 to $45.00 Weekly pivot
- $39.50 to $40 higher timeframe support
- 2012 Highs Support around $37.50
Safe Trades!


 with precision, indicating that Markets are still more on the mood for consolidation.)