
 to see how the turn in the pricing for the December 10 meeting led to strong reversals.)
Strongest Major currency of the past month, the Dollar had swept through most of its peers powered by a hawkish repricing, assumed by the Market after Powell’s speech at the October 29th FOMC (You can access it right here).
The Federal Reserve Chair made many more mentions of their dual mandate to monitor both Employment and Inflation compared to the September meeting which had seen a tilt towards employment (meaning tariffs were posing an issue yet again).
The rough numbers and downward revisions to NFP in August and many other labor releases had warranted such a dovish turn from the Fed during the early Summer, but also caught people by surprise when data did not continue to worsen consequently – Explaining by the way the steep rally from 97.50 all the way to above 100.00 in the Dollar Index.
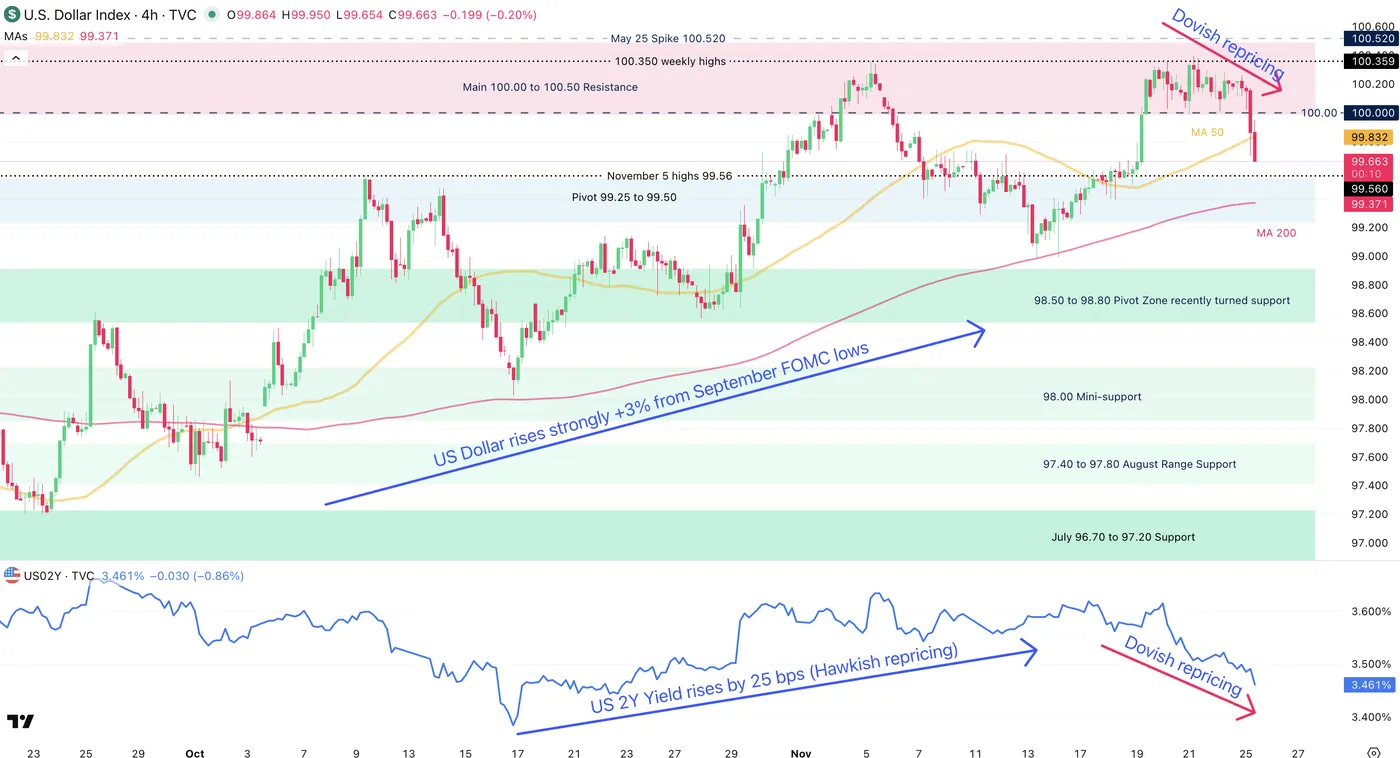
Dollar Index (DXY) since end-September 2025 (top panel) with US 2-Year Yield (bottom panel) – Source: TradingView
Turning to today, late releases from the Bureau of Labor Statistics haven’t corroborated with a high inflation and better employment picture; Quite the opposite actually:
Despite better Jobless Claims last Thursday, consecutive misses in US Retail Sales (particularly ex. Auto and Gas at 0.1% vs 0.4% exp), PPI (Headline as expected, but a 0.1% miss on the Core) and Private Labor Data (-13.5K vs -2.5K previous) confirmed the more protective tone from Fed’s Williams at his speech last Friday.
Since the end of last week, the Pricing for a 25 bps cut consequently went from lows of 20% all the way to the current 85%.
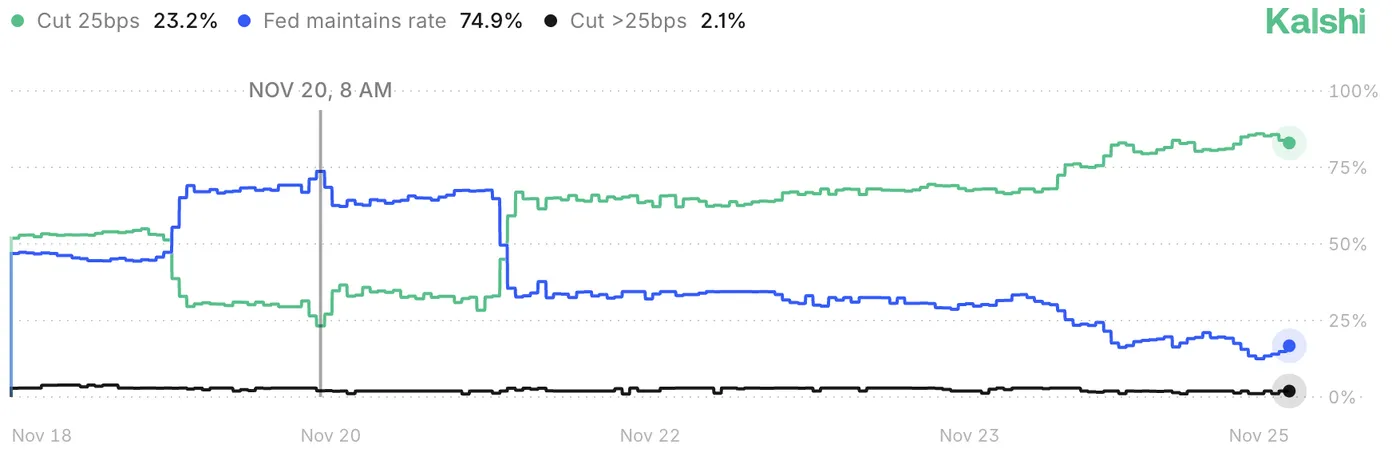
Evolution of the Fed’s Rate Cut odds, November 25, 2025 – Source: Kalshi
Let’s have a look at a few intraday FX Major Pairs (USD/JPY, EUR/USD and AUD/USD) to see how the turn in the pricing for the December 10 meeting led to strong reversals.
USD/JPY – Is the Squeeze done?
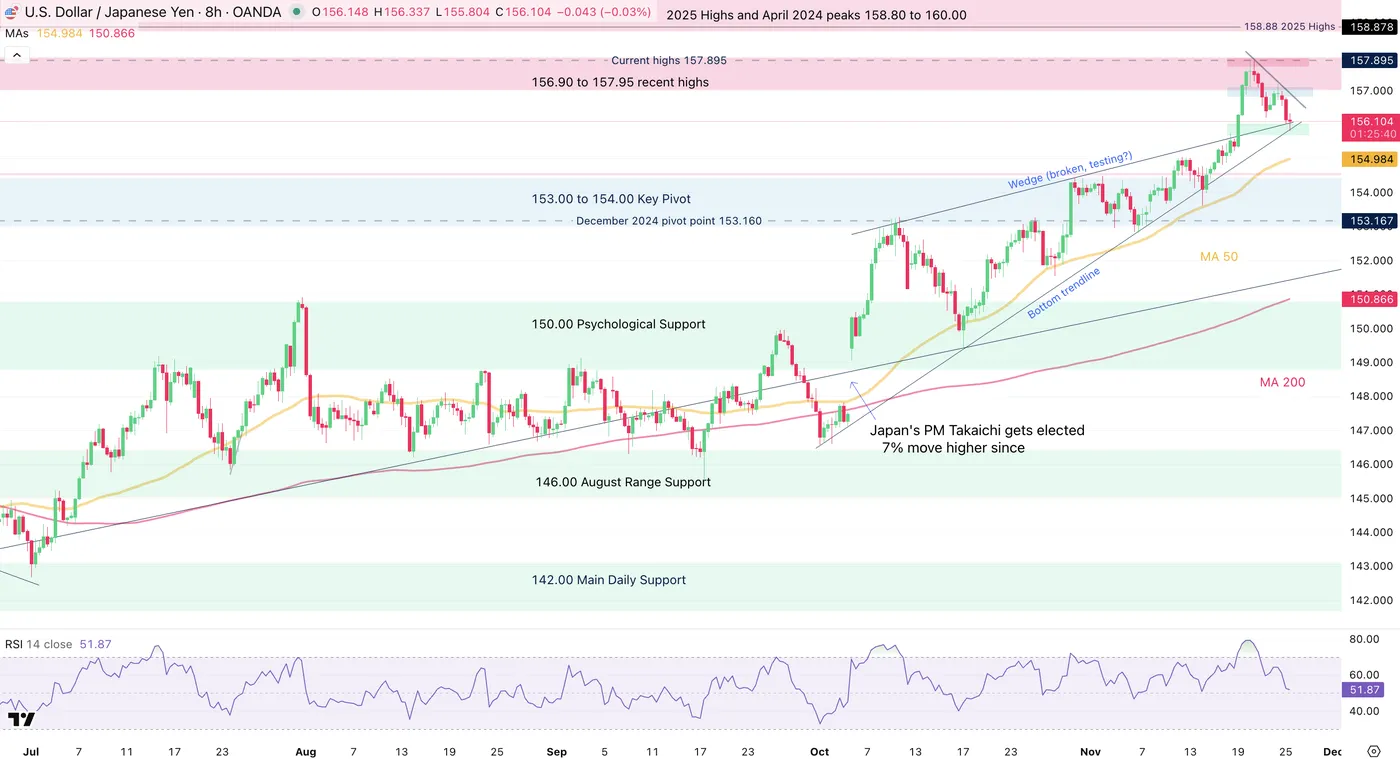
USD/JPY 8H Chart. November 25, 2025 – Source: TradingView
USD/JPY, subject to a 10,000 pip, one-way up-move since beginning October, has just initiated a turn lower since the speech from Fed’s Williams.
A monetary policy convergence trade (where rates differential between US –at 4% – and Japan –at 0.5%– bearish for the pair had been put on the side after PM Takaichi’s appointment.
However, the Bank of Japan is showing their teeth after the one-sided move, pointing towards a potential rate hike in December to help the yen.
Fears of intervention which could come during Thanksgiving have also calmed the squeeze.
Currently at 156.00 after reaching 158.80, the pair is holding tight at an hourly support.
- An hourly close below the 156.00 handle opens the door for a Major retracement all the way to 153.00.
- A rebound from here would point to 157.00, a test of the descending trendline
Levels of interest for USD/JPY Trading
Resistance levels
- 156.90 to 157.95 Recent top resistance
- 2025 Highs and April 2024 peaks 158.80 to 160.00
- 1990 and July 2024 Peak 161.00 to 162.00
- November highs at 157.895
Support levels
- 156.00 to 156.20 Short-timeframe Support
- 153.00 to 154.00 Key high timeframe pivot
- 150.00 Psychological support
- 146.00 August range support
- 2025 142.00 Main daily support
EUR/USD holds its range
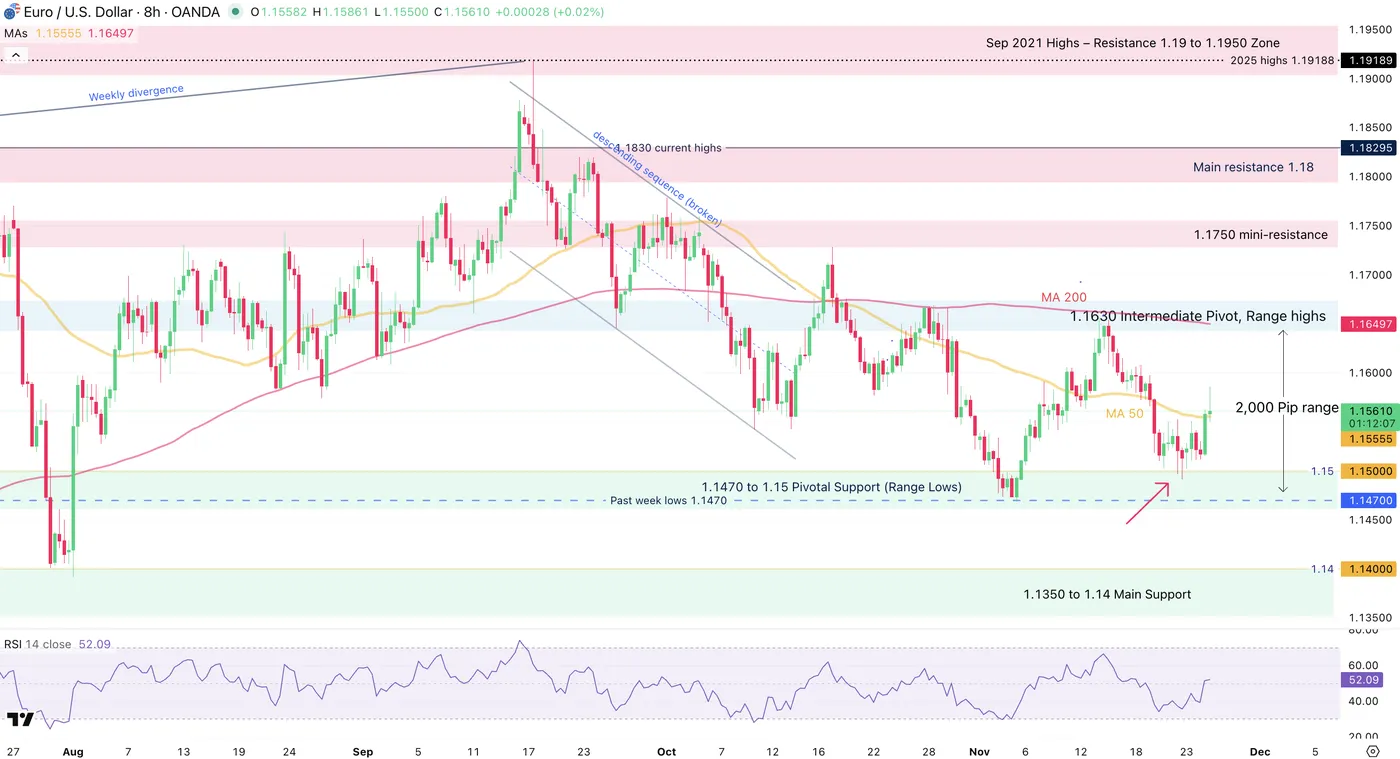
EUR/USD 8H Chart. November 25, 2025 – Source: TradingView
The range in EUR/USD, mentioned throughout our recent detailed analysis of the pair, is holding extremely well in those current conditions.
Since October 27, Fiber has been holding between 1.1470 lows and 1.1650 highs.
Confirmed by a flattening MA 200 and with fundamentals not coinciding with major breakouts, the range can be expected to hold ; Directional trends have the tendency to slow down before FOMC meetings– However, always watch for fakeouts and don’t forget that everything can happen .
Levels of interest for EUR/USD Trading
Resistance levels
- 1.1630 to 1.1670 Pivot zone (range Highs)
- 1.1750 mini-resistance
- Resistance Zone around 1.18 (+/- 150 pips)
- Sep 2021 Highs – Resistance 1.19 to 1.1950 Zone
- Weekly highs 1.1656
Support levels
- 1.1470 to 1.15 range support
- 4H MA 200 Mini-support 1.16190
- 1.1475 to 1.15 Support Zone
- 1.1350 to 1.14 Support
- Session lows 1.14966
AUD/USD bounces back at the lows of its yearly range
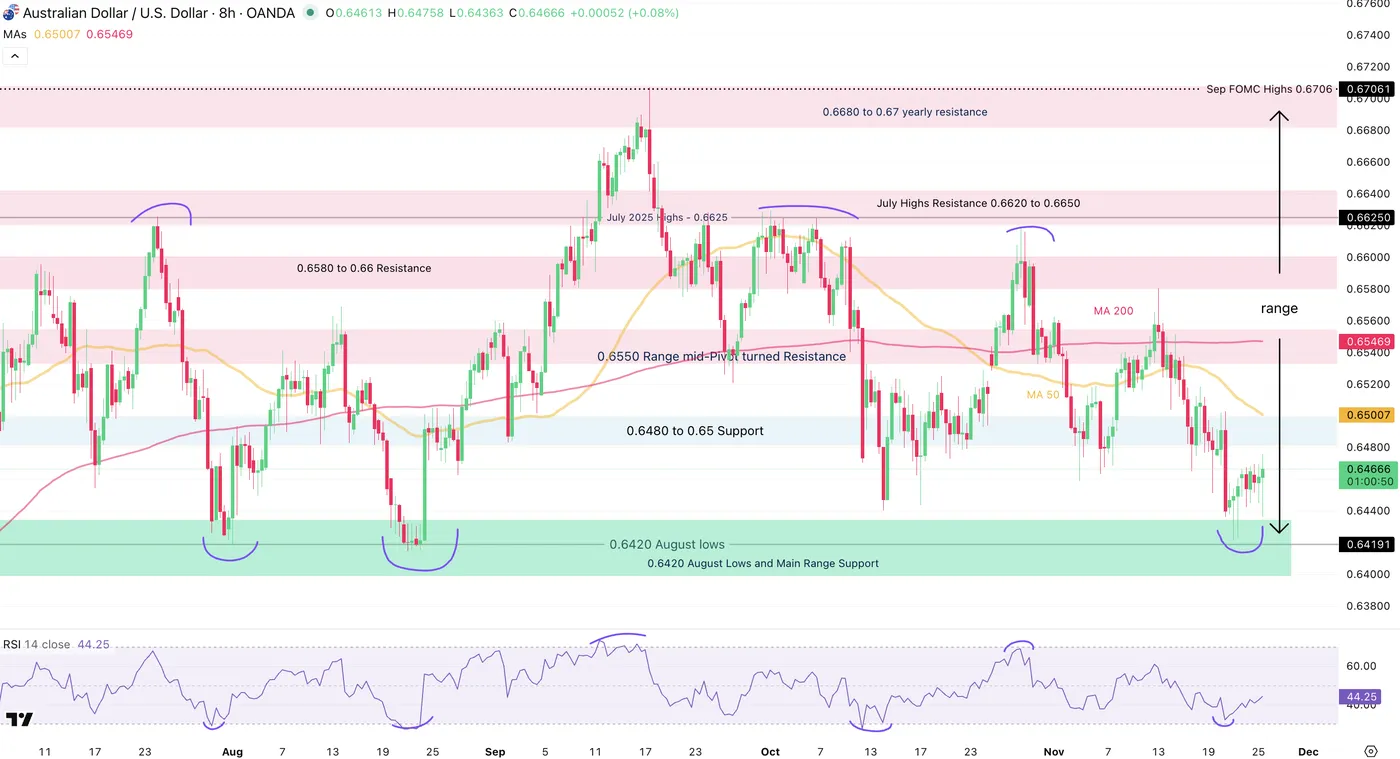
AUD/USD 8H Chart. November 25, 2025 – Source: TradingView
It is one of the first time that I noticed such an obvious range!
Since August 2025, FX Markets haven’t materialized any trends – Pretty logical when seeing the extent of the moves throughout the first half of this year.
Nevertheless, AUD/USD had caught quite a wave of weakness after a strong performance against all its major counterparts, with the “Risk-on” currency brought down by a worsening sentiment (The Aussie tends to correlate well with Equity markets).
Holding between 0.64 (Support) and 0.66 (Resistance) since August, the latest bounce can offer quite a mean-reversion setup.
Still, as always, keep an eye on any session close below support or above resistance, but same as EUR/USD, you can expect the range to hold ahead of the FOMC meeting (as fundamentals have few chances of changing much more).
Levels of interest for AUD/USD Trading
Resistance levels
- 0.6480 to 0.65 Pivot
- 0.6550 Range mid-Pivot turned Resistance
- 0.6580 to 0.66 Resistance (Range Highs)
- July Highs Resistance 0.6620 to 0.6650
Support levels
- 0.6420 August Lows and Main Range Support (recent bounce)
- 0.6250 May support
- 0.62 Psychological support
- Liberation Day lows 0.59140
Safe Trades!