
While US Markets are away for the Thanksgiving holiday, leaving the broader session fairly calm, the FX markets remain open and active, with all eyes turning to the Kiwi Dollar (NZD), posting yet another strong session.
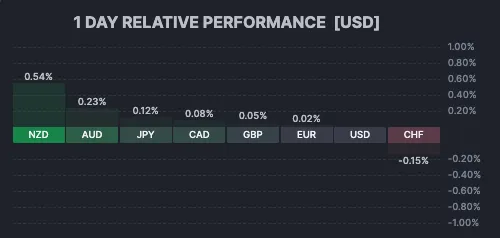
1-Day FX Performance – NZD demarks itself in the calm Thanksgiving Session – Source: Finviz
The Antipodean currency has faced its share of struggles this year, weighed down by a slowing New Zealand economy that proved more sensitive than its neighbor Australia to the slowdown in global trade post-tariffs—a weakness that was starkly evident in a terrible Q2 GDP growth rate of -0.9%.
However, after 325 basis points of cuts, the data has started to come back in a flash. New Zealand Retail Sales just posted a strong beat of 1.9% versus the 0.5% expected, a sign of strong recovery that follows stronger inflation prints and improving Manufacturing PMIs.
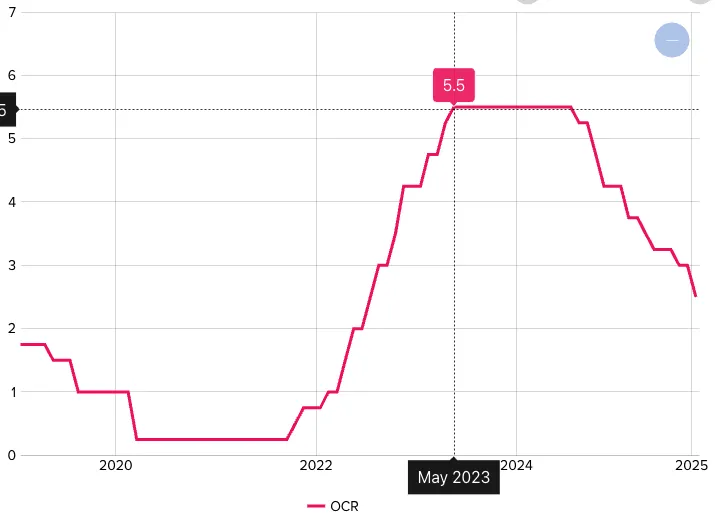
New Zealand’s Main Interest Rate (OCR) since 2020 – Source: Reserve Bank of New Zealand
Adding to the shift in sentiment, RBNZ Governor Christian Hawkesby mentioned that a future rate cut faces “significant hurdles.”
This wording sufficed the market to assume that the 2.25% rate is the lower bound for the Kiwi rate, with markets now pricing rates to stay put throughout 2026.
This fundamental pivot is a clear sign of renewed strength for the NZD, which is up 2.65% against the US Dollar since last Friday.
Let’s look at the major Kiwi pair, NZD/USD, to spot where that takes the action looking forward.
NZD/USD Multi-Timeframe Technical Analysis
Daily Chart
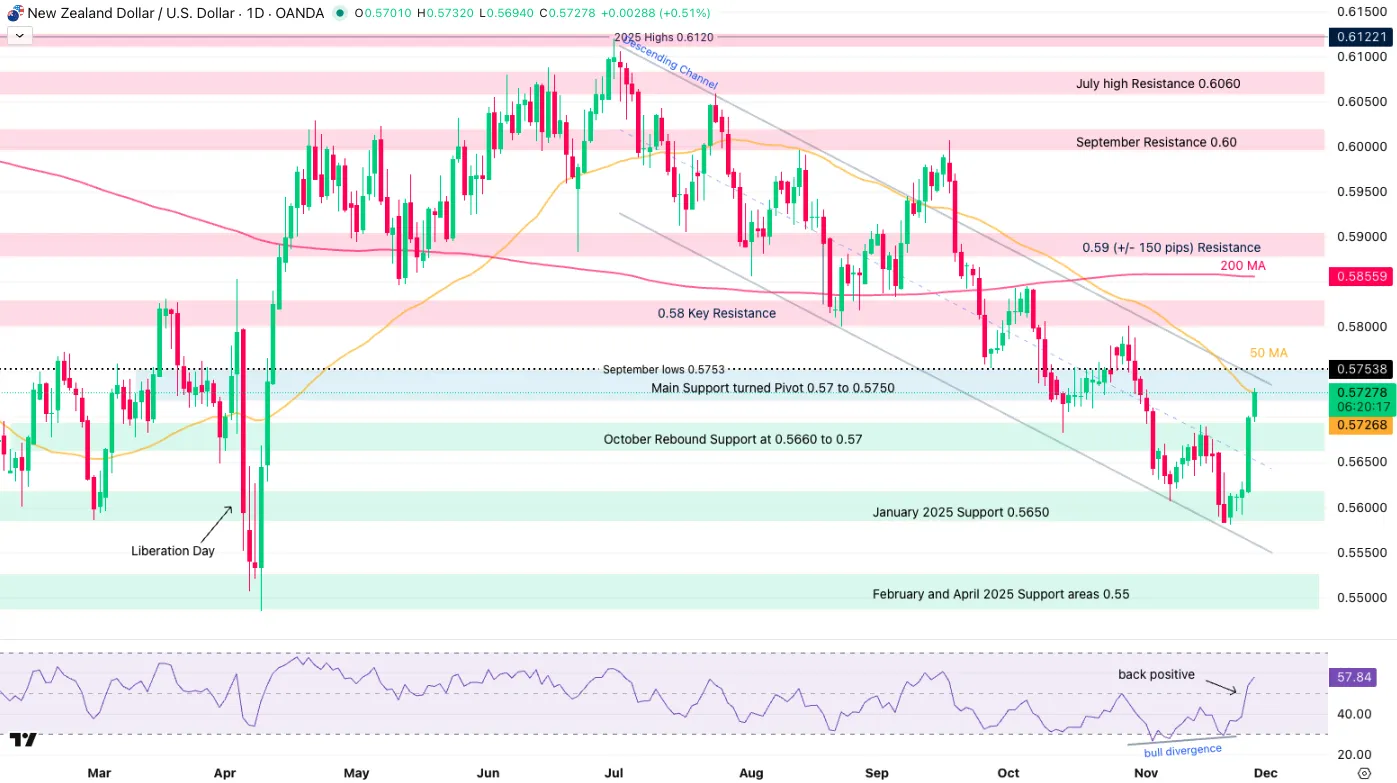
NZD/USD Daily Chart, November 27, 2025 – Source: TradingView
Since July 1st and the comeback of the US Dollar, the NZD/USD has been in a one-way descent, exacerbated by diverging policies between the Fed and the RBNZ.
Taking the pair all the way down to a retest of the Liberation Day troughs in a Monthly Downward Channel, the action is now marking a first clear rebound in months.
Propulsed by changing fundamentals and bullish daily divergences, the ongoing action is strong and will face hurdles at the 50-Day Moving Average (0.57268) and Channel highs.
Still, when looking at how strong the current candles are, these hurdles could be breached soon. For confirmation, look at a session close above the 50-MA.
4H Chart and Technical Levels
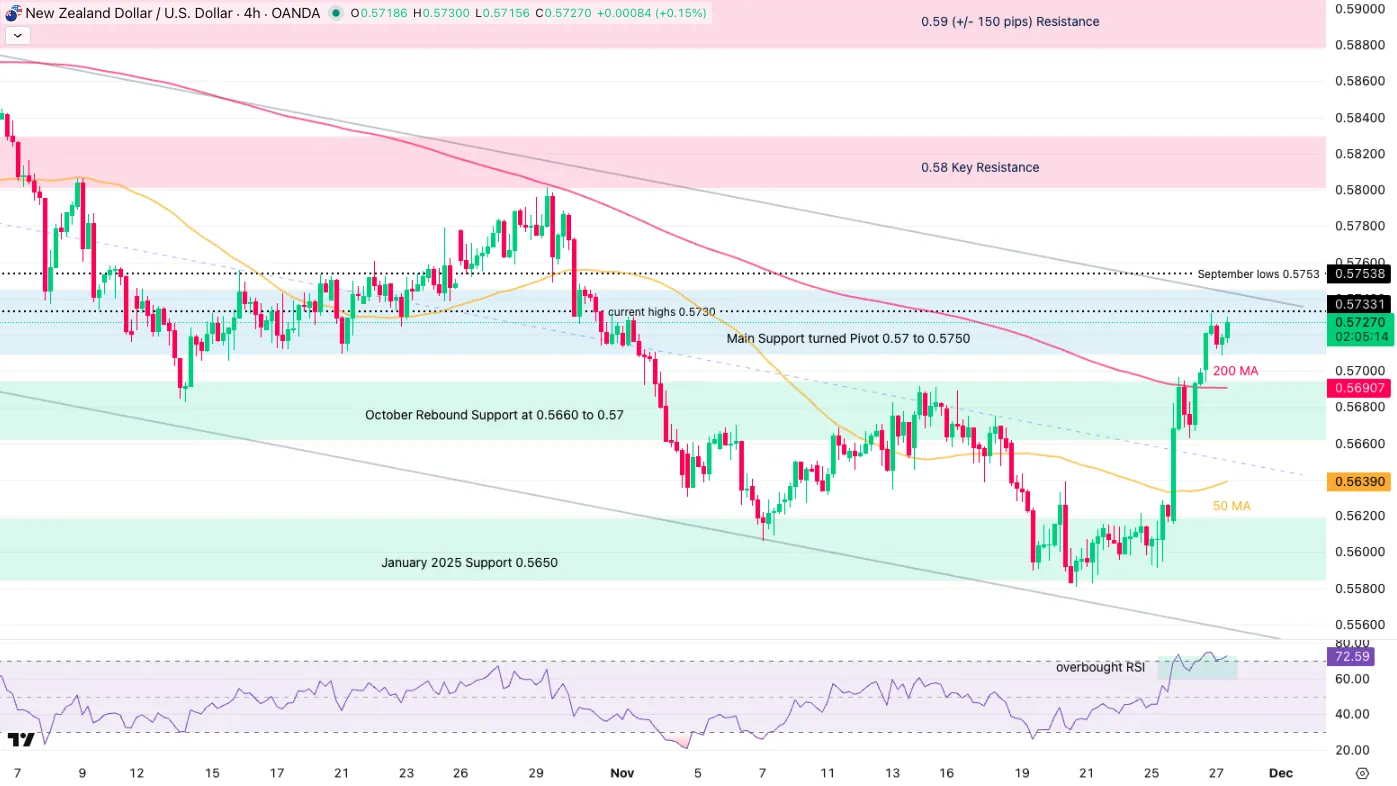
NZD/USD 4H Chart, November 27, 2025 – Source: TradingView
The ongoing rally is also facing a few hurdles on the intraday timeframe:
Overbought RSI levels within the Pivot Zone (0.5720 to 0.5750) could trigger some small mean-reversion.
A retest of the 4H-MA 200 (0.5690) could see higher probability for the action to continue its path higher.
NZD/USD Technical Levels to keep on your charts:
Resistance levels (NZDUSD)
- Main Support turned Pivot 0.5720 to 0.5750 (testing)
- Daily highs 0.5730
- 0.58 Key Resistance
- 0.59 (+/- 150 pips) Resistance
Support levels
- 4H 200 MA at 0.5690
- October Rebound Support at 0.5660 to 0.57
- 4H 50-period MA 0.56385
- January 2025 Support 0.5650
1H Chart
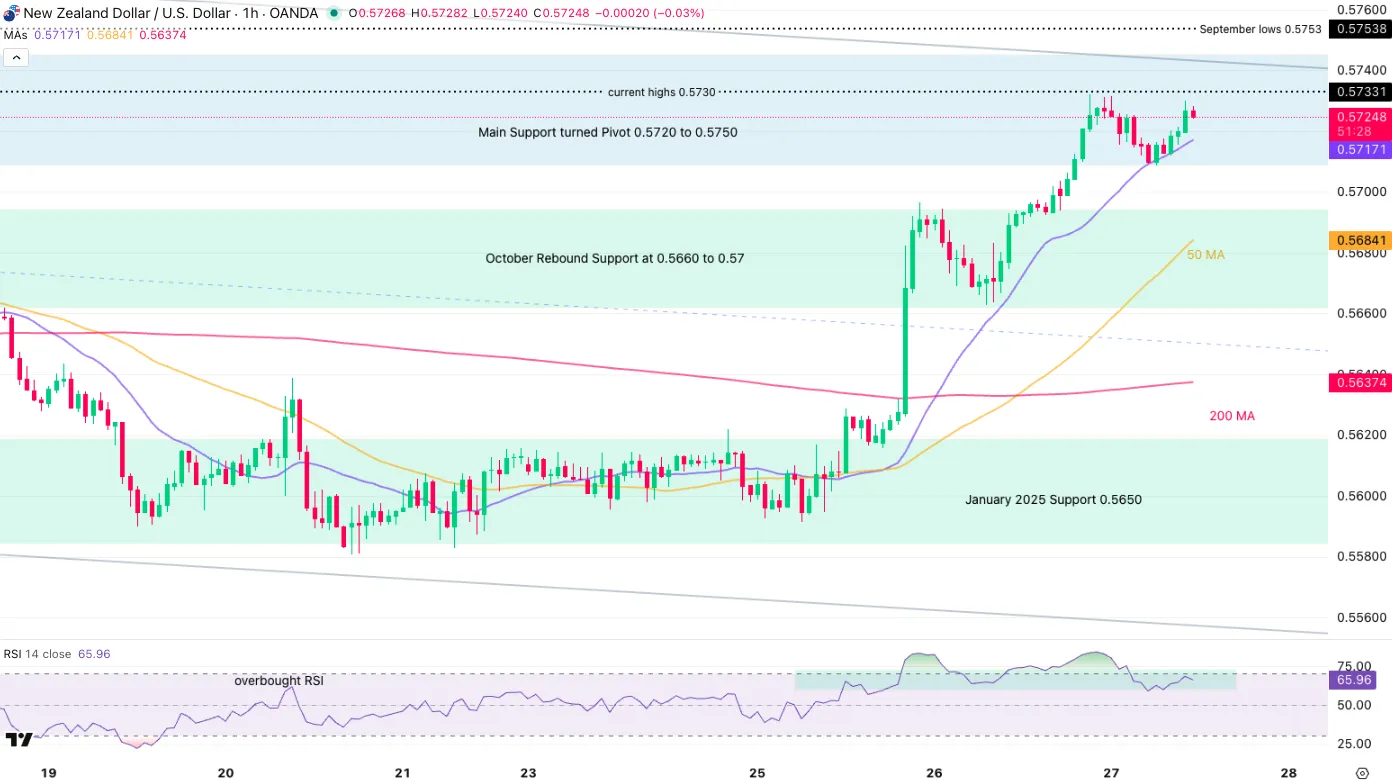
NZD/USD 1H Chart, November 27, 2025 – Source: TradingView
Looking even closer, the action is strongly following the 20-Hour MA at 0.57140;
- A break below would point to a retest of the 4H MA 200 mentioned on the 4H Timeframe
- A break and close above the Daily highs (0.5730) will then face a 100-pip resistance to breakout of the Weekly bear Channel
- Above this, the next Resistance is 600 pips higher.
Safe Trades!