
, US Indexes are plummeting.The move reflects overbought conditions amid rising geopolitical tensions and ongoing diversificationExploring Technical Levels for the Dow Jones, Nasdaq and S&P 500)
- After yesterday’s not-so-bullish CPI trading (despite a positive report), US Indexes are plummeting.
- The move reflects overbought conditions amid rising geopolitical tensions and ongoing diversification
- Exploring Technical Levels for the Dow Jones, Nasdaq and S&P 500
Yesterday sent a clear warning shot to US Traders: even a positive CPI report—arguably the Fed’s primary concern—failed to hold the bid.
Indexes finished in the red, leaving sell-the-news hints.
And that hesitation is materializing into a full-blown pullback in today’s session.
Nasdaq is leading US Indexes in their fall, down 1.50% as I write this.
After the relentless Freedom Rallies across equities last week, the market shrugged off everything, including the unprecedented investigation into Chair Powell.
However, the escalating tensions in Iran are now being used as the pretext for a significant selloff in equities.
On paper, the past week rally made perfect sense: record low credit spreads, record high bond issuance (signaling robust economic confidence), and solid earnings from early reporters all supported the bull case.
But the tone has shifted.
With Oil bouncing above $62—up 10% since the Maduro capture—volatility has returned, and it is rarely an investor’s best friend.
As JP Morgan’s Jamie Dimon noted, geopolitical risk remains the single biggest headwind for equities across asset classes.
This focus naturally overshadows Black Swan risks, such as potential credit distress or fears of an AI peak – Keep a close eye on those throughout 2026.
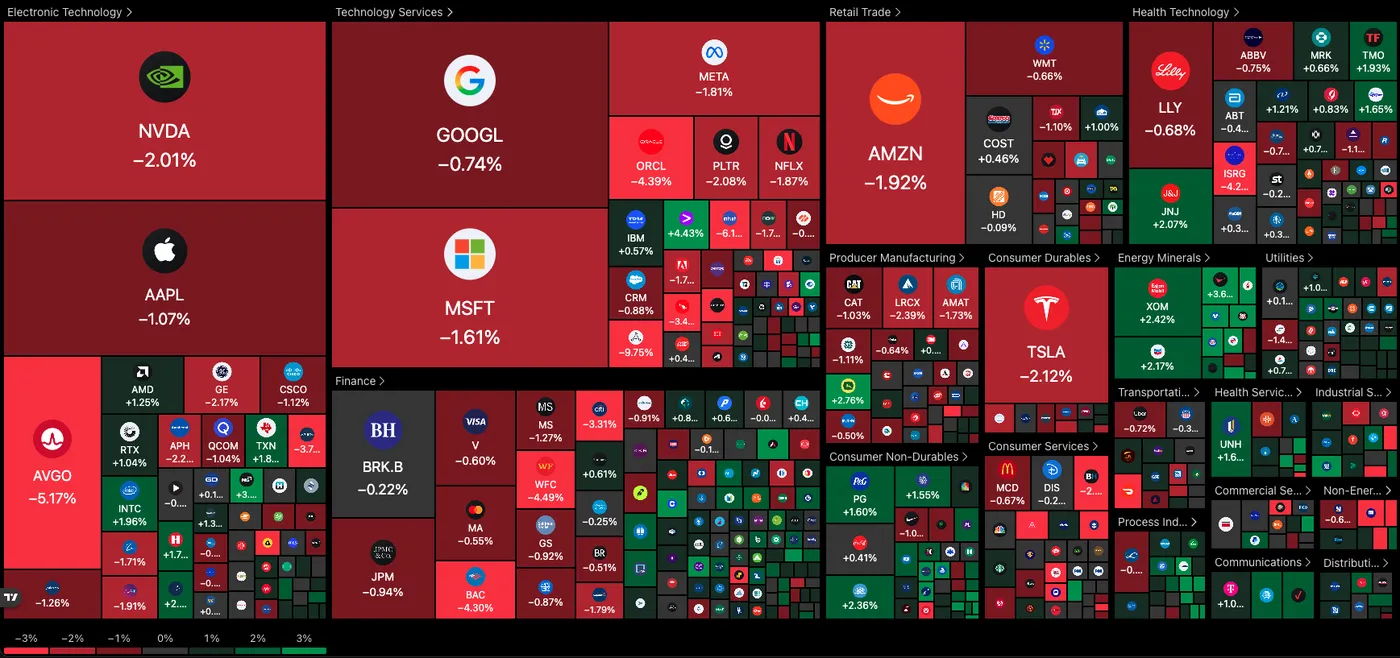
Current picture for the Stock Market (11:39 P.M. ET) – Source: TradingView – January 14, 2026
Looking at the tape today, the Magnificent 7 are taking a hit, with losses ranging from -0.85% for Google to -2.30% for Nvidia. The broader market picture isn’t faring much better.
Energy stocks are the lone outperformers, profiting from the WTI surge despite high inventory levels. Outside of the oil patch, capital is rotating strictly into defensive havens, with Household Products and select Healthcare names holding the line.
Let’s dive into our daily intra-session charts and trading levels for the major US Indexes: Dow Jones, Nasdaq, and S&P 500.
Dow Jones 4H Chart
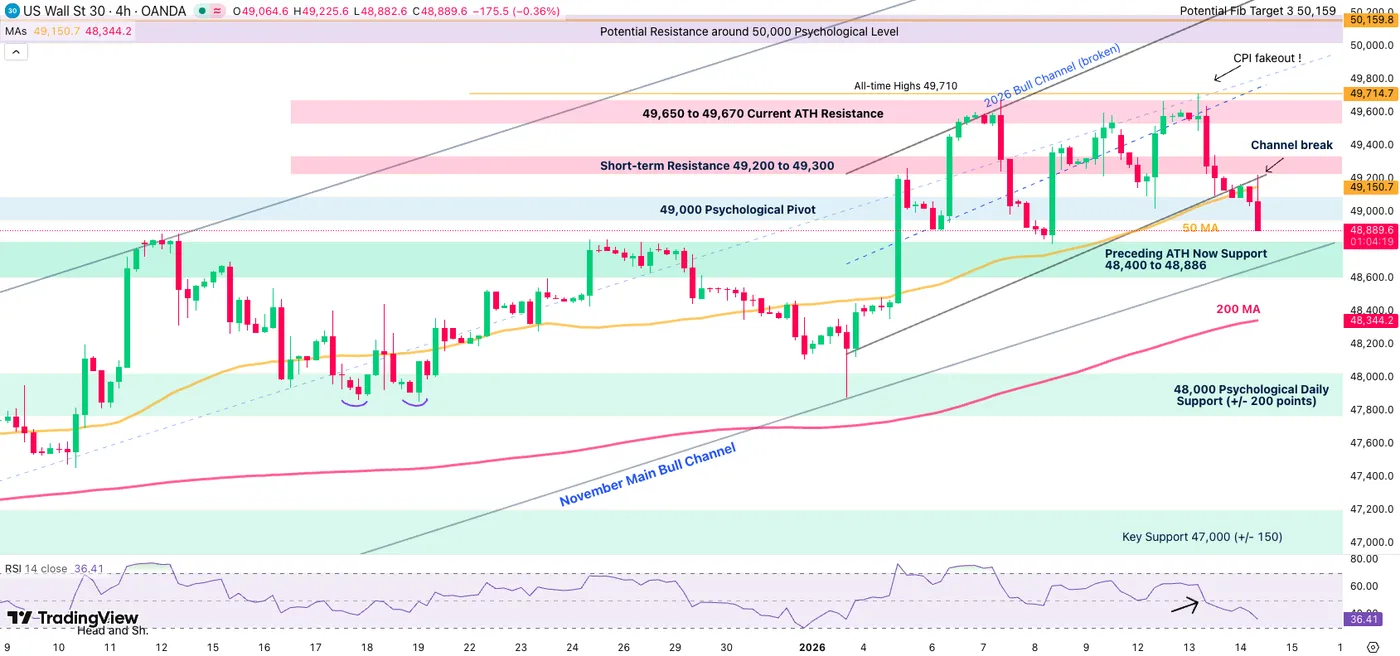
Dow Jones (CFD) 4H Chart – January 14, 2026 – Source: TradingView
Dow Jones is suddenly turning bearish after yesterday’s All-Time High fakeout.
Now breaking its 2026 rising channel and passing below its 4H 50-Period MA, momentum is turning bearish – Confirmed with the descending RSI.
As the selloff attempts to ram through the 49,000 Psychological, look at the November Channel lows:
- Bouncing from there could provide a decent dip-buying opportunity if sentiment gets better
- The Channel and 48,600 Support Zone breaks, hinting at pursued downside (which could lead to 45,000 being retested)
- Still far but this scenario is rising in probability. Be careful for extreme long positions.
Dow Jones technical levels for trading:
Resistance Levels
- 49,151 4H 50-MA
- Short-term Resistance 49,200 to 49,300
- 49,650 to 49,670 Current ATH Resistance
- 46,710 All-Time Highs
- 50,000 Potential Psychological Resistance
Support Levels
- 48,600 to 48,800 Major Support and November Channel Lows
- Psychological Support at 48,000
- 45,000 psychological level (Main Support on higher timeframe)
Nasdaq 4H Chart
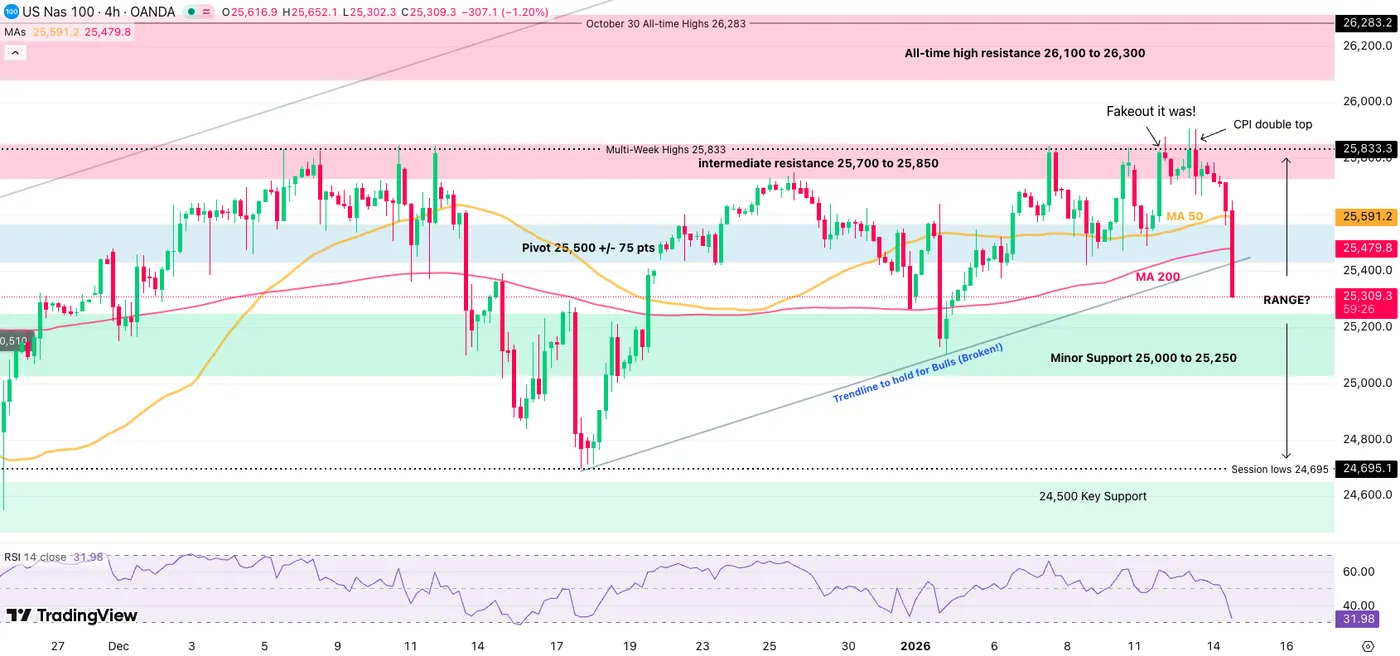
Nasdaq (CFD) 4H Chart – January 14, 2026 – Source: TradingView
The picture is looking very grim for Nasdaq despite its stronger performance yesterday:
Bears are now fully in control after a double top fakeout at the CPI release and a break of its 2026 upward trendline.
Looking out, it seems that the Nasdaq is stuck in a 24,700 to 25,800 large consolidation, but as Supports are breaking, keep a close eye on Higher Timeframe charts to see if things materialize into something worse.
On the immediate picture, the selloff is showing oversold on the 4H CPI – Hence, look at whether a pullback higher comes at the 25,500 Minor Support or if lower consolidation points to continued downside.
Nasdaq technical levels of interest:
Resistance Levels
- 4H MA 200 (25,480)
- intermediate resistance 25,700 to 25,850 Fakeout
- Momentum Pivot 25,500 +/- 75 pts
- Session highs 25,877
- All-time high resistance zone 26,100 to 26,300
- Current ATH 26,182
Support Levels
- Minor Support 25,000 to 25,250 (immediate test)
- 25,850 Mini Support
- 24,500 Main support
- Early 2025 ATH at 22,000 to 22,229 Support
S&P 500 4H Chart
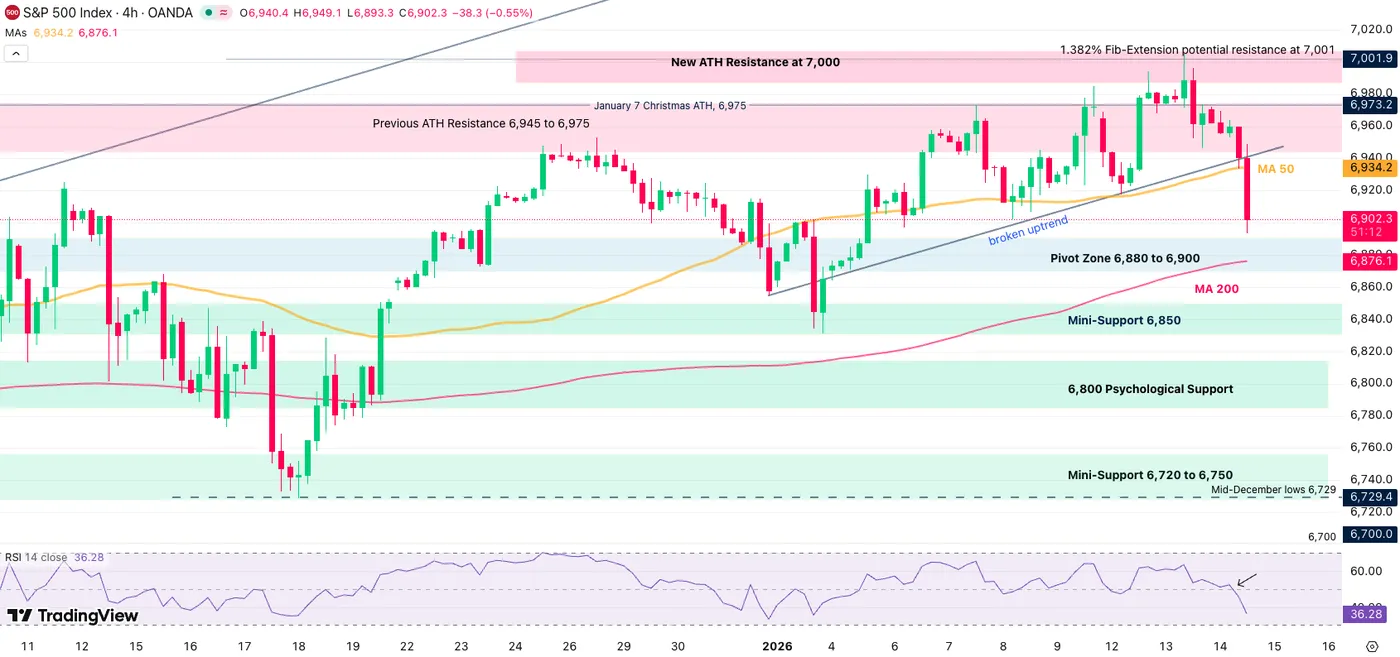
S&P 500 (CFD) 4H Chart – January 14, 2026 – Source: TradingView
Now rejecting its 7,000 new Major All-Time Highs, the S&P 500 picture is also looking grim.
Bulls will face a key test at the 6,880 to 6,900 Psychological Pivot after breaching the 4H 50-MA (6,935).
Breaking below will lead to a fully bearish price action.
Holding there would hint at a simple yet scary retracement.
S&P 500 technical levels of interest:
Resistance Levels
- 4H 50 MA at 6,935
- Previous ATH Resistance 6,945 to 6,975
- Current ATH Resistance at 7,000
Support Levels
- Pivot Zone 6,880 to 6,900
- Session lows 6,893
- 6,800 Psychological Support
- Support 6,720 to 6,750
- 6,400 Major psychological support
Safe Trades!